
Abstract
Since many factors affect the fatigue life of welded structures and the relationships between them are complex, finding effective ways to improve the fatigue reliability of welded structures has always been a challenge for the industry. A fatigue reliability assessment model and design method for welded structures based on the structural stress method is proposed. According to the limit state equation of the model, the design-life fatigue reliability and the service fatigue reliability assessment approaches are presented. Then, a first-order second-moment method is employed to reveal quantitative fatigue reliability for welded joints and structures. The relationships between the fatigue reliability and the influence variables are used to analyze and improve the welded structure design. Fatigue reliability of T-joint examples was assessed by accounting for weld leg sizes, plate thicknesses, penetration depths, and single-sided and double-sided forms. Furthermore, the assessment model was verified with a welded bogie frame. The fatigue reliability of the frame was improved based on the evaluation results. The model and method can be applied to other types of welded joints and welded structures.
Keywords
Introduction
Welding is one of the most dominant structural joining methods and is widely used in engineering machinery, vehicle engineering, marine engineering, aerospace, and other fields. Usually, welded structures are the main load-bearing components and key components in industrial structures. These typical welded structures include bridge bodies, ship hulls, train bogies, etc. In welded structures, fatigue failures predominantly occur at welded joints.1,2 In order to ensure the fatigue safety of welded structures, it is absolutely essential to study and understand the fatigue stability and reliability evolution law of welded joints during long-term service. However, the reliability assessment of welded joints based on fatigue phenomena is a difficult task because it is influenced by many factors (such as weld leg size, plate thickness, and penetration depth) and the relationships between them are complex. It has been a challenge for the industry to find effective methods to improve the fatigue reliability of welded structures. Fatigue reliability is critical for industrial welded structures, but due to its complexity, there is still a paucity of relevant research. Currently, the reliability assessment of welded structures is still mainly limited to the range of structural static strength, while the research on fatigue reliability assessment is still mainly limited to the field of structural fatigue reliability.
In recent years, some studies have been carried out on structural fatigue reliability. Considering not only the effects of load interactions but also the phenomenon of the strength degradation of materials induced by loading history, a new method was developed to predict the reliability and fatigue life of mechanical components. 3 A time-varying reliability analysis model was established, and the application for the composite structure fatigue problem based on the non-probability of the time-varying reliability analysis was put forward. 4 The methods for numerical evaluation of reliability were suggested for deterministic strength degradation and cumulative damage employing the simulation method and inversion theorem. 5 Static and tension–tension fatigue experiments were conducted on the cross-ply composite laminates. Reliability fatigue life incorporating reliability was calculated using the single-side allowance factor. 6 A DDRT reliability model was proposed to save time on fatigue reliability evaluation. Then, a reliability calculation flow for a gear transmission system was proposed based on the model considering the time-domain characteristic of gears. 7 To determine the fatigue reliability of the metro train bolster during real service, a fatigue reliability model was established based on the stress-life interference model. 8 For the fatigue failure characteristics of the compressor disk in an aero engine, the fatigue reliability of its damage structure in service was analyzed by using the probability cumulative damage criterion. 9 A novel cumulative damage model was proposed for assessing the time-dependent reliability analysis of deteriorating structures. 10 An improved dynamic reliability model for the compressor rotor system was developed. Using the new model, the relationship between reliability and time, the compressor rotor system are analyzed, respectively. 11 A dynamic reliability model with mixed uncertain parameters was proposed, and the dynamic reliability index of steel specimens under fatigue load was obtained to verify the presented method. 12
In the research on fatigue reliability evaluation of welded structures, Dong et al. 13 evaluated the fatigue reliability of misaligned butt welds based on the structural hot spot stress approach. The time-variant fatigue reliability of T-plate welded joints under stochastic loading was evaluated using the PHI2-based method. 14 Considering the initial welding deformation, the weld joint results of lateral deformation limit under different reliability indexes were presented using the renewed critical stress amplification factor method. 15 Gao et al. 16 used the notch strain approach to assess the fatigue reliability of welded joints, accounting for the effects of misalignment, local notch, and crack-like imperfection. Although the above studies have made some achievements, the studies are limited to welded joints, not industrial welded structures. Moreover, their shortcomings are that they use the traditional nominal stress method and the hot spot stress method which have limitations in fatigue life prediction. In addition, the current fatigue reliability research papers are focused on welded joints, and there are almost no papers on the fatigue reliability of complex industrial welded structures.
Fatigue properties of welded structures are usually evaluated according to standards and codes based on the conventional nominal stress method or hot spot stress method (e.g. IIW, 17 BS7608 18 ). These methods use one welded joint form corresponding to one S-N curve to predict fatigue life. However, since the joint and load forms in the traditional method standard are limited, it is far from covering the joint and load forms of actual industrial welded structures. Therefore, it is difficult to find the corresponding S-N curve for a large number of welds of engineering structures. 19 In addition, the conventional methods are also affected by the mesh size of the Finite Element (FE) model problem.20,21
The usual hot spot stress approach for fatigue analysis applies only to situations where the potential mode of failure is by fatigue crack growth from the toe of a weld. In addition, it has the disadvantage of dependence on the FE mesh and massive curves selected.22,23 Thus, in terms of finite element modeling and simulation efficiency, the structural stress method, which can be applied to complex weld orientation, toe and root, mesh-insensitive, one master S-N curve, has significant advantages over the hot spot stress method. Further, comparisons of hot spot stress and structural stress evaluation methods are presented in the literature.24,25
Unlike the traditional nominal and hot spot stress methods, the structural stress method (the master S-N curve method) provides an effective method for solving the problems above.19–21 The method has been adopted by welding fatigue standards and guidelines such as ASME 2007 26 and NT 3199, 27 and has been successfully applied in the fatigue life prediction of industrial welded structures.28–33 Because the method has mesh-insensitive properties and uses a master S-N curve to predict fatigue life for complex joints,34–36 new possibilities are provided to study the fatigue reliability assessment for complex industrial welded joints and structures.
Ye et al. 37 performed a reliability-based assessment of welded joints in orthotropic anisotropic steel bridge panels using the structural stress approach. But the research is preliminary and restricted because it only analyzes the reliability of the static strength from the yield strength and has no discussion about the fatigue reliability. Currently, the structural stress method is an effective method for fatigue life prediction of welded structures. So far, however, there has been little published information on fatigue reliability research employing the method. In addition, the quantitative analysis of fatigue reliability for welded structures in service is understudied.
Therefore, this research is conducted and the main contributions of this study to accessing and improving fatigue reliability of welded structures are as follows:
(1) A fatigue life reliability assessment model based on the structural stress method is proposed. A fatigue life limit state function for welded structures is presented and a first-order second-moment method is adopted to quantitatively evaluate the fatigue reliability of the welded structure.
(2) Based on the limit state function, the design-life fatigue reliability and the service fatigue reliability are defined to reveal the characteristics of the welded joint and the laws of fatigue reliability of welded structures in service.
(3) A new design method is presented to improve the fatigue reliability of welded structures. The method improves the fatigue reliability for welded structures through the relationships between fatigue reliability and influence variables.
For verifying the effectiveness of the model and method, T-joint examples were used to evaluate the fatigue reliability accounting for weld leg sizes, plate thicknesses, penetration depths, and single-sided and double-sided welded joints. In addition, the fatigue reliability of a welded bogie frame of a high-speed train was assessed and improved by the proposed method. The model and method develop a novel way of assessing the fatigue reliability of welded structures.
The structural stress method
The structural stress method provides a robust approach to predicting the fatigue life of welded structures. The method obtains the nodal forces and nodal moments from weld toes through finite element calculations. Then, the nodal forces and moments are converted into line forces and line moments. Using them, structural stresses are gained to assess fatigue life finally. The adopting nodal force and moments approach avoids the problem that the stresses obtained by the nominal stress method are affected by the mesh size of the finite element model.
According to the conditions of force and bending moment balance at the weld toe, the structural stress method decomposes the load on the welded joint into membrane stress and bending stress and self-balancing nonlinear stress on the weld toe section, as shown in Figure 1. The membrane stresses


Structural stress definition at weld toe.

Illustration of the structural stress calculation procedure for a curved weld.
where t is the plate thickness, fy’ and mx’ are the line force and line moment, respectively. Equation (1) deduces equation (2).

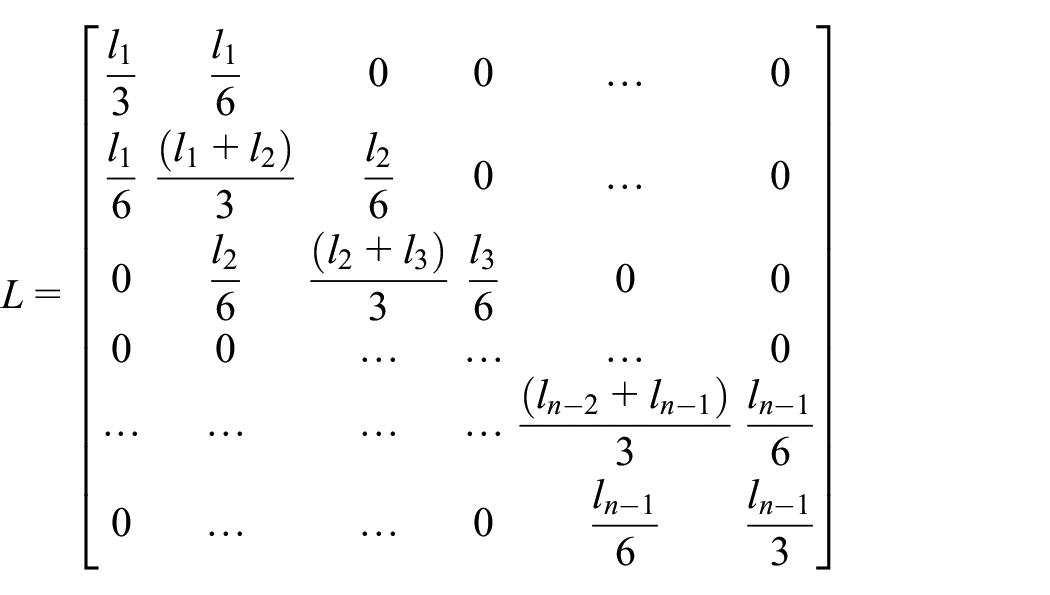
where L is the nodal distance matrix of the weld toe, Fyn is the nodal force matrix of the weld line, and Mxn represents the nodal moment matrix of the weld line. L is related to the distance between the nodes of the weld line, and is expressed as:
In terms of the definition of equivalent structural stress, the equivalent structural stress range

where m is the constant 3.6, I(r) is the dimensionless function of the load bending ratio r. Equation (4) is the fitting formula for I(r).

where the load bending ratio r is equation (5).
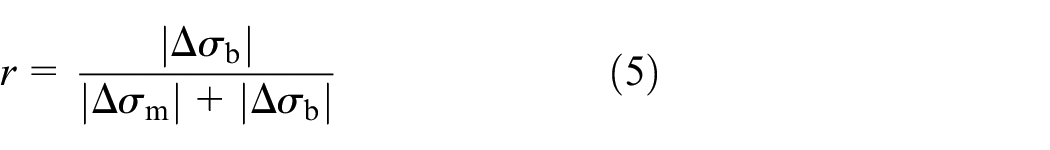
where

where N is the fatigue life, Cd is the material constant of the welded joint, and h is the inverse slope of the master S-N curve. The values of Cd and h for steel joints are shown in Table 1.
Main S-N curve parameter of steel.

There are studies on fatigue mechanism and life analysis of welded joints.35,38–41 Equations (3) and (6) are derived from the fracture mechanics theory in the fatigue mechanism. 35
Methodology
The proposed fatigue reliability assessment model and design method for welded structures based on the structural stress method are shown in Figure 3. The assessment model uses the design-life fatigue reliability and the service fatigue reliability to evaluate quantitatively evaluate fatigue reliability. The specific steps are described as follows:
Step 1: Determine the influence variables of the model inputs.
Step 2: FE models of the welded structures are established according to the influence variables. The loads and constraints of the calculated work conditions are applied to the FE models.
Step 3: The membrane stress range
Step 4: Through the constructed limit state function, access the design-life fatigue reliability and service fatigue reliability with the first-order second-moment method. The relationships between the influence variables and the fatigue reliability of the structure are obtained and outputted.
Step 5: Improve the design of welded structures according to the relationships between the influence variables and the fatigue reliability.
Step 6: If the fatigue reliability meets the requirements, the design is finished. If it does not, return to modifying the original design.
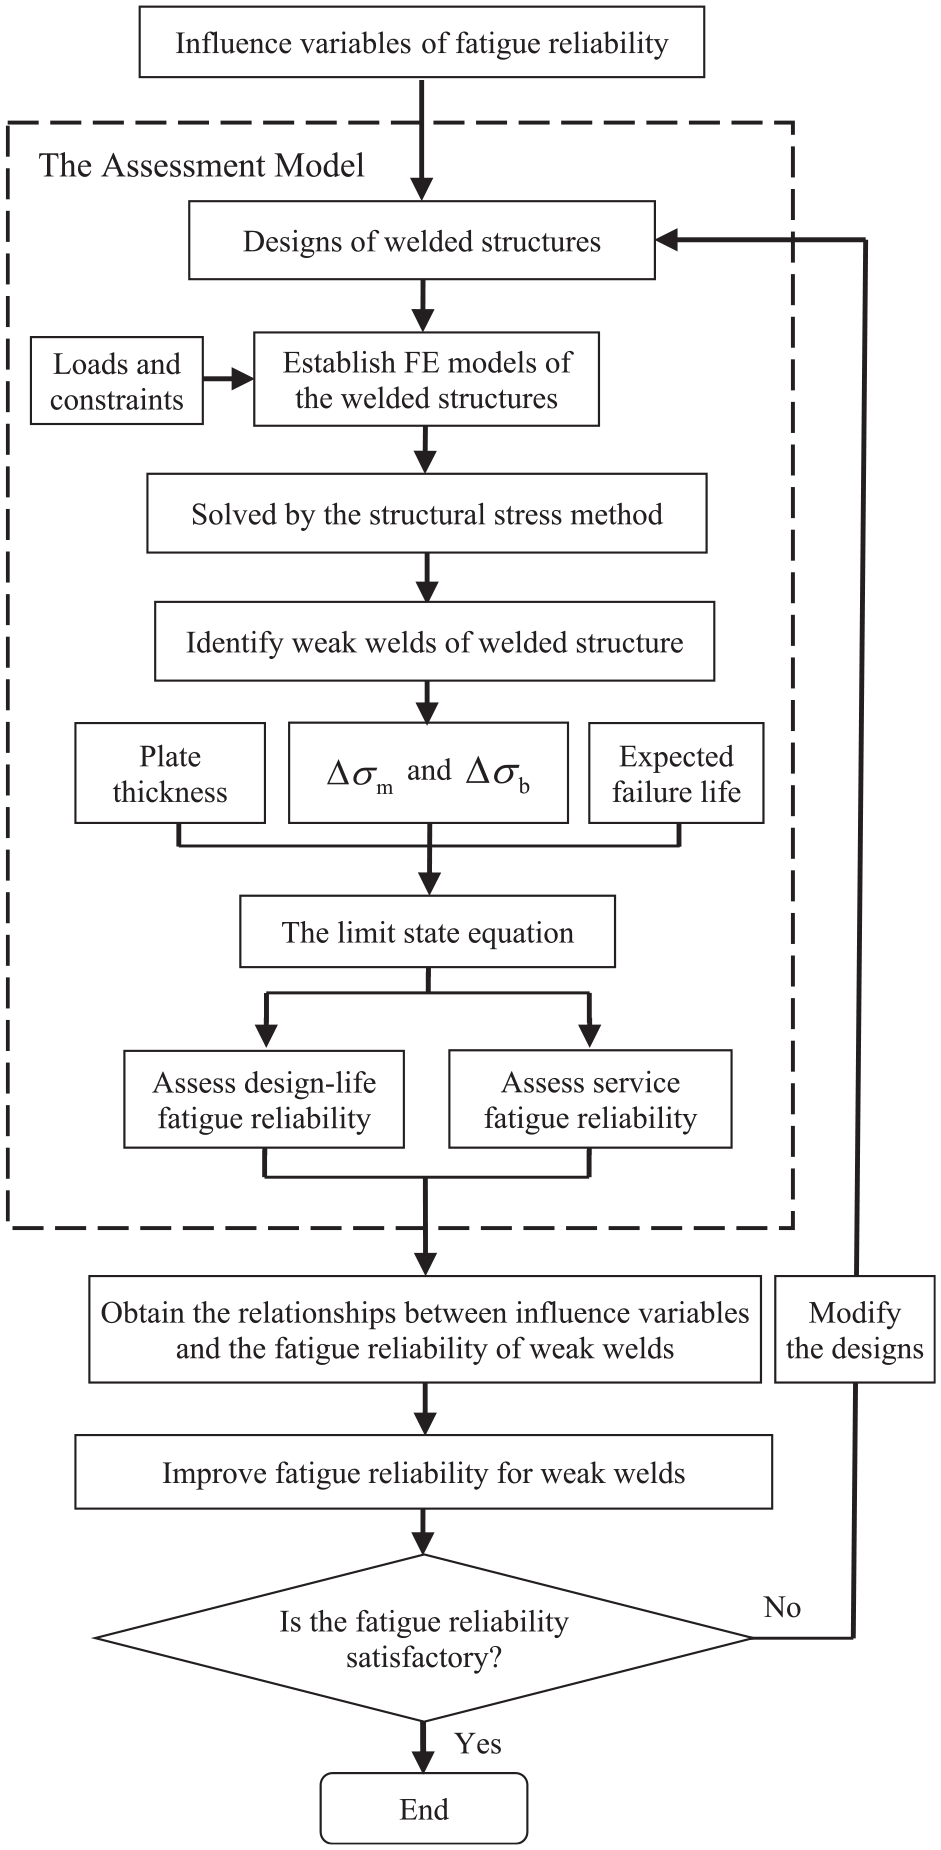
Flowchart of the fatigue reliability assessment model and design method for welded structures based on the structural stress method.
The following sections are the key detailed descriptions for the above steps.
Establishment of the limit state equation
The limit state function in Step 3 is established by equation (7).

where NE is the expected fatigue life and N is the fatigue life obtained by the structural stress method. When Z is greater than 0, the welded joint is in a safe state; when Z equals 0, the welded joint is in a critical state; and when Z is less than 0, the welded joint is in a failure state.
From equations (1), (3), (6), and (7), the limit state equation of the fatigue life model for welded structures based on the structural stress method is expressed as follows.

Equation (8) reveals that the four key parameters affecting fatigue reliability are
The influence variables of fatigue reliability
Figuring out the quantitative relationship between the influence variables and the fatigue reliability of the concerned welds is the key condition to improving the fatigue reliability of the original welded structure. These influences, also called random variables, directly affect the three key parameters
As can be observed from equation (8), the plate thickness and load ratio are explicated because they are directly present in the limit state equation. The variables such as weld leg size and penetration depth are implicit since they are not directly involved in the limit state function. The effect of implicit variables on joint fatigue reliability is expressed by the effect on the membrane stress range, and bending stress range.
Definitions of the design-life fatigue reliability and the service fatigue reliability
To measure the fatigue reliability of welded structures, the design-life fatigue reliability and the service fatigue reliability are proposed.
In Step 3, define the design-life fatigue reliability to evaluate the fatigue reliability in the design life. In this case, the expected fatigue life NE is set as a constant design life value in equation (8). The outputs of design-life fatigue reliability include the fatigue life reliability index and reliability. Different design-life fatigue reliability is obtained according to the influence variables of different welded joints. Then, the relationships between fatigue reliability and influence variables are obtained.
In order to access fatigue reliability during service, the service fatigue reliability is defined. In this case, in equation (8), the expected fatigue life NE is set as the service life variable. In equations (7) and (8), the service fatigue reliability indicates that as the service time increases, the expected fatigue life (service fatigue life) NE is getting greater and closer to the fatigue life N, and the probability of failure of welded joints will increase. Afterward, the structural change laws of service fatigue reliability are achieved.
The first-order second-moment method
The first-order second-moment method is employed to obtain quantitative fatigue reliability of welded joints and structures.
In the random variable space, the expressions for the mean and standard deviation of the limit state equation of the welded joint are obtained by using the properties of mutually independent normally distributed variables. First, the initial values of the variables are set and the initial values of the variables are assigned to the checking points. Then the standard deviation of the variable is derived from the mean and coefficient of variation of the variable. The standard deviation is substituted into the sensitivity calculation formula to get the sensitivity coefficient. After that, the mean value and standard deviation of the checking point are substituted into the expression of the limit equation, and the ratio of the two values is obtained, which is the reliability index. The above sensitivity coefficients and reliability indexes are iterated continuously until finally obtain the sensitivity coefficient and reliability index that meet the conditions.
Specifically, the fatigue reliability assessment process of the weld employing the first-order second-moment checking point method is as follows.
(1) Input the equation of the limit state of the welded structure.
(2) Take the weakest node of the weld as the calculation variables extraction point.
(3) Set the calculation variables Xi (i = 1,2,…n). Xi selects the three key parameters of weak node: plate thickness X1, membrane stress range X2, and bending stress range X3. Their mean values are μX1, μX2, and μX3. After the influence variables are input into the structural stress calculation, the mean values of membrane stress range and bending stress range are determined.
(4) Set the initial value μX for the checking points X*. That is, μX = [μX1, μX2, μX3] as the set of initial mean values of the variables.
(5) Calculate the reliability index β by X* and calculate the sensitivity coefficient α.
(6) Determine whether the error at the verification point is less than the allowed error. If it is greater than the error, enter step 7. If it is less than the error, enter step 8.
(7) Calculate a new checking point using the calculated α and β, and return to step 5.
(8) Output the reliability index β and the corresponding reliability and failure probability. The calculation process is finished.
Improvement of fatigue reliability for weak welds
Based on the obtained relationships between influence variables and fatigue reliability, the supporting data for improving the original welded structure design are acquired.
The design of structural modifications is recommended when the improvement can result in a significant improvement in the fatigue reliability of the structure. When the modified design does not produce a noticeable fatigue reliability improvement, the design is unnecessary. The quantified fatigue reliability can identify designs with excessive structural modifications, resulting in cost savings.
Example I: T-joints
To verify the validity of the method and the applicability of multiple influence variables, quantitative evaluations were performed using the T-joint examples. Through the evaluations, some of the fatigue reliability characteristics of T-joint were investigated.
T-joint is one of the most common types of welded joints in welded structures. This section studies the influence variables of weld leg size, plate thickness, penetration depth, single-sided form, and double-sided form on fatigue reliability. As shown in Figure 4(a), 2D FE models of completely penetrated T-joints were created by the ANSYS plane 42 element and steel material. Plate 1 and plate 2 are 50 and 100 mm in length, respectively. Both plate thicknesses are 10 mm and the weld leg size is 10 mm.

One of the T-joint models in the tension or bending condition. (a) The 2D FE model, (b) the Von Mises stress in the tension condition, and (c) the Von Mises stress in the bending condition.
Tension and bending loads are two typical loading methods in IIW, BS7608, and other standards. For comparison, the two specific working conditions were established as shown in Figure 4: a 100 N force F1 was applied in the Y-direction as the tension condition; a 20 N force F2 was applied in the X-direction as the bending condition. The force was applied on the top of the plate 1 model using the RIGID approach at a distance of 55 mm from plate 2 and at the centerline of plate 1. Set AA’ section as weld toe 1, BB’ section as weld toe 2, and CC’ 45° weld throat section as weld root. Employing the design-life fatigue reliability method, NE was set as the design-life constant value of 2 × 10⁶. Figure 4(b) and (c) show the results of the finite element analysis. The weaker one of the weld toe 1 and the weld toe 2 was identified by the structural stress method for different influence variables and was taken to assess the fatigue reliability.
The effect of weld leg size on fatigue reliability
The 2D FE models of 11 groups of double-sided T-joint were established with 10 mm thickness, and weld leg sizes of 4, 5, 6, 7, 8, 9, 10, 12, 14, 16, and 18 mm. After the ANSYS simulation, the structure stresses of welds were calculated according to equation (1). Then, the design-life reliability was obtained and shown in Figure 5.
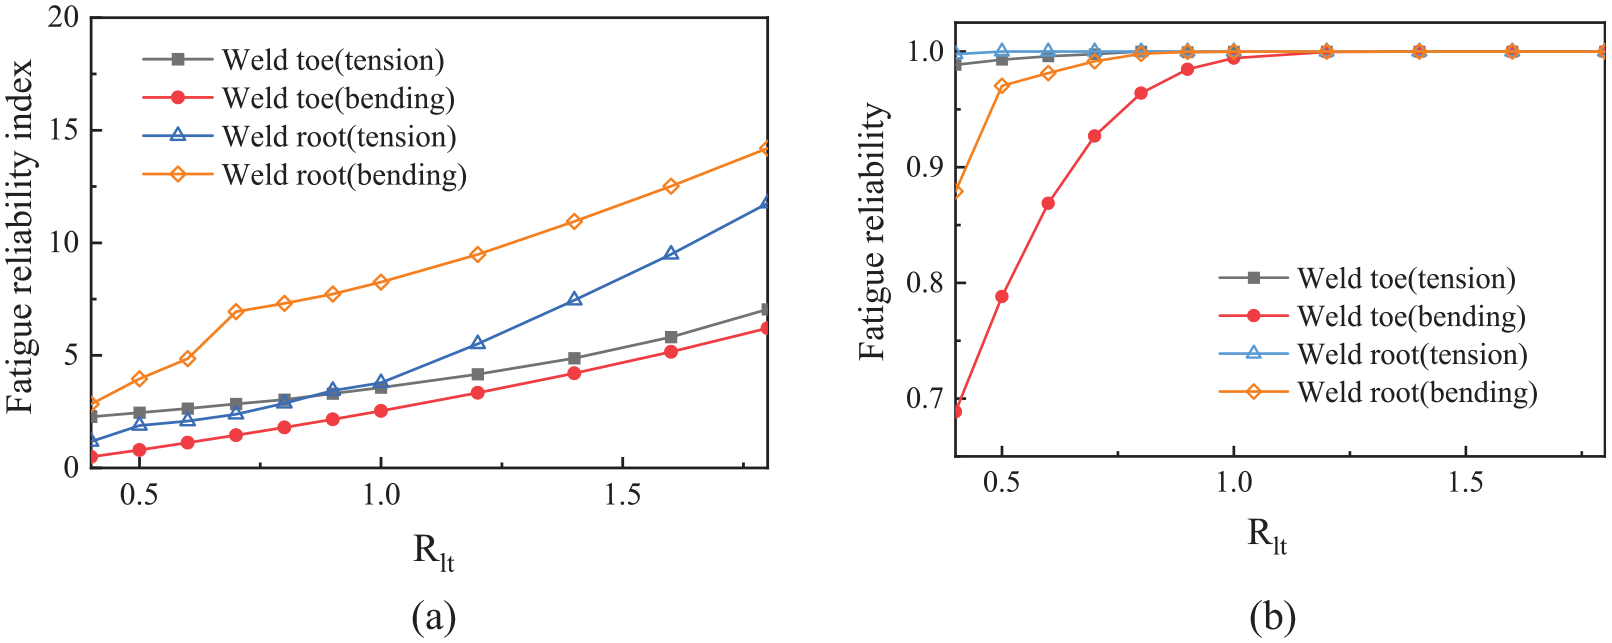
Effect of weld leg size on fatigue reliability. (a) Fatigue reliability indexes for weld leg size variation and (b) fatigue reliability for weld leg size variation.
Figure 5(a) indicates that when the thickness is a constant value and the weld leg size increase, Rlt increase. As the Rlt increases, the T-joint reliability indexes gradually improve. Figure 5(b) shows that the fatigue reliability of the weld toes is greater than the fatigue reliability of the weld roots. This reveals that fatigue failure is more likely to occur at the weld toe. When the Rlt is below 1, the fatigue reliability of the weld root and weld toe increases faster with the increase in weld leg size, and the fatigue reliability of the weld toe can be significantly improved by increasing the weld leg length. When the Rlt is greater than 1.0, the reliability of weld toe and weld root approaches 1. When the Rlt is above 1.2, the reliability of the weld root does not improve notably. Consequently, excessively increasing the weld leg size will not improve the fatigue reliability of the welded joint obviously.
The effect of plate thickness on fatigue reliability
When keeping the weld leg size at 10 mm, build seven groups of models with plate thicknesses of 5, 6, 8, 10, 12, 14, and 16 mm. The reliability indexes of the weld for the two work conditions are shown in Figure 6.

Effect of plate thickness on fatigue reliability. (a) Fatigue reliability indexes for plate thickness variation and (b) fatigue reliability for plate thickness variation.
Figure 6(a) shows that when the weld leg size is constant and the plate thickness decrease, the Rlt increase and the reliability index of the T-joint gradually decreases. The reliability change trend of tension and bending conditions is consistent. Figure 6(b) shows that when the Rlt is less than 0.71, the reliability is stable, and there is no significant improvement. That indicates that it has no obvious effect on trying to improve the fatigue reliability of the joints by increasing the plate thickness when the Rlt is less than 0.71. Besides, Figure 6 shows that when the Rlt is greater than 1.25, the fatigue reliability of the weld toe decreases rapidly. Continuing to reduce the plate thickness leads to reduces the fatigue reliability in the design life.
Figure 6(b) reveals that when the Rlt is greater than 1.0, the weld throat section is more reliable than the weld toe section. Therefore, fatigue failure is more likely to occur at the weld toe during the service of the T-joint. In the process of welded joint design, the weld toe failure mode should be given priority attention when the plate thickness ratio is greater than 1.0.
The effect of penetration depth on fatigue reliability
Double-sided welded joint
A completely unpenetrated weld is defined as 0% penetration depth, and a completely penetrated weld is defined as 100% penetration depth. The following six penetration depths of 0%, 20%, 40%, 60%, 80%, and 100% were used to produce double-sided T-joint models. Moreover, the plate thickness was set to 10 mm. The FE models were established with different Rlt: 0.6, 1.0, and 1.2. The fatigue reliability of the T-joints for three Rlt and six penetration depths is shown in Figure 7.

Effect of penetration depth on fatigue reliability of double-sided welded joints. (a) Fatigue reliability indexes for penetration depth variation and (b) fatigue reliability for penetration depth variation.
Figure 7(a) shows that the reliability indexes of the weld toe section of this model are larger than those of the weld throat section, so the failure modes of T-joints with different penetration depths are all weld toe failures. Figure 7 also reveals that when the penetration depth of welded joints changes, the fatigue reliability index and reliability show little change. It can be seen that the penetration depth of double-sided T-joints has little influence on fatigue reliability.
Single-sided welded joint
Similar to double-sided T-joints, FE models of single-sided T-joints with six penetration depths were established. Figure 8 shows the comparison results of the reliability index and reliability of the six penetration depths of single-sided welding.

Effect of penetration depth on fatigue reliability of single-sided welded joints. (a) Fatigue reliability indexes for penetration depth variation and (b) fatigue reliability for penetration depth variation.
In Figure 8, the reliability of the single-sided T-joint gradually increases rapidly with the increase in penetration depth when the penetration depth percentage is less than 50%. When the penetration percentage is greater than 60%, the reliability of single-sided T-joints shows no obvious change. When the penetration percentage is greater than 80%, the penetration has little influence on fatigue reliability. When the penetration percentage is greater than 80% and the Rlt is greater than 1.0, the reliability of the joint approaches 1, and increasing the size of the weld leg can’t obviously increase the fatigue reliability. However, when the penetration depth is lower than 60%, the fatigue reliability of the single-sided T-joint is greatly decreased. The low penetration depth of single-sided T-joints should be avoided.
Example II: The welded bogie frame
Through the analysis in Subsection 4, some T-joint characteristics were revealed, and these characteristics can help us to improve the design of bogie T-joints. In bogie welded frames of high speed train, T-joint is one of the most common joint types. Figure 9 shows a 3D finite element model of the welded bogie frame of the high-speed train with eight concerned T-joint welds.
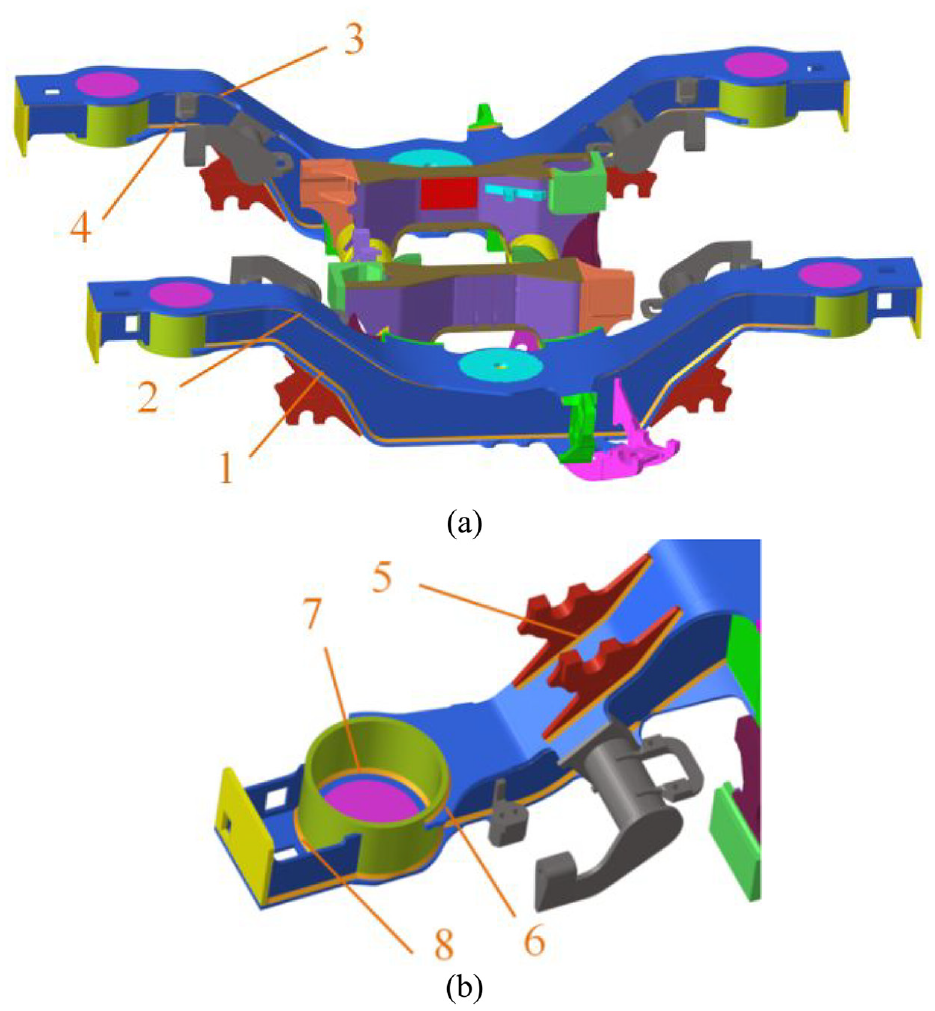
Eight concerned T-joint welds on the FE welded bogie frame of the high-speed train. (a) Welds 1–4and (b) Welds 5–8.
The fatigue strength of the frame was evaluated by using the three-stage fatigue test procedure in the UIC615-4 standard. The structural stress method was used for fatigue evaluation. After ANSYS calculation, the structural stress, equivalent structural stress, fatigue life, and damage ratio of the eight welds were determined by three load sequences. Some structural stress results are shown in Figure 10.

Structural stress curves and equivalent structural curves of some concerned welds. (a) Weld 1and (b) Weld 2.
Table 2 shows the damage ratio result data of the eight welds. The data reveal that the cumulative damage values of all eight concerned welds are less than 1, and eight welds meet the design requirements. Among them, Weld 7, Weld 2, and Weld 5 are the three welds with the largest cumulative damage ratio and are the weak welds that need to be focused on.
Accumulated fatigue damage of concerned welds in welded bogie frames.

Fatigue reliability assessment of welds on the welded bogie frame
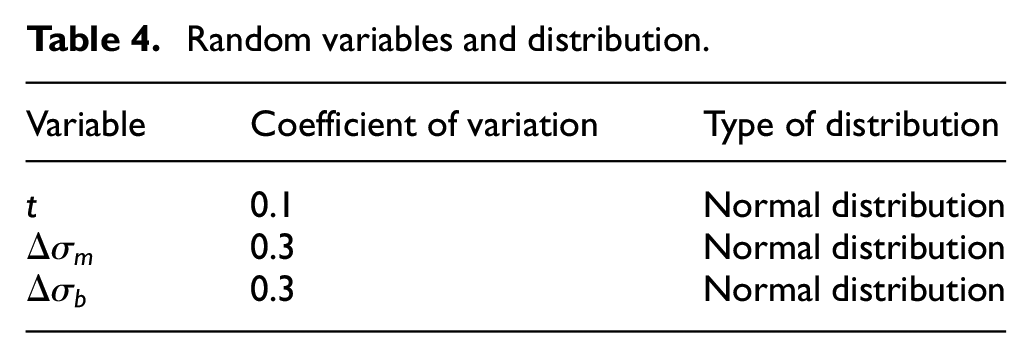
The fatigue reliability of the eight welds of the frame was evaluated. To study the variation law of the reliability of the frame welds, the fatigue reliability was calculated by taking
Mean values of each random variable for the eight concerned welds.

Random variables and distribution.
The assessment of service fatigue reliability
The service fatigue reliability and reliability index were obtained and are shown in Figure 11. The Figure shows that the fatigue reliability of all eight welds is close to 1 at low expected failure life cycles. As the NE load cycles increase, the reliability indexes of all eight welds show a decreasing trend. Especially, the three weak welds (Weld 2, Weld 5, and Weld 7) have a lower level of reliability indexes and a higher probability of fatigue damage compared to the rest of the welds. Figure 11(b) reveals that the fatigue reliability of weld 7 drops fastest. The fatigue reliability of the three weak welds decreases significantly with the increase in cycles, while the reliability of the other welds remains essentially unchanged. Therefore, an improving fatigue reliability design of the three weak welds in service is required.
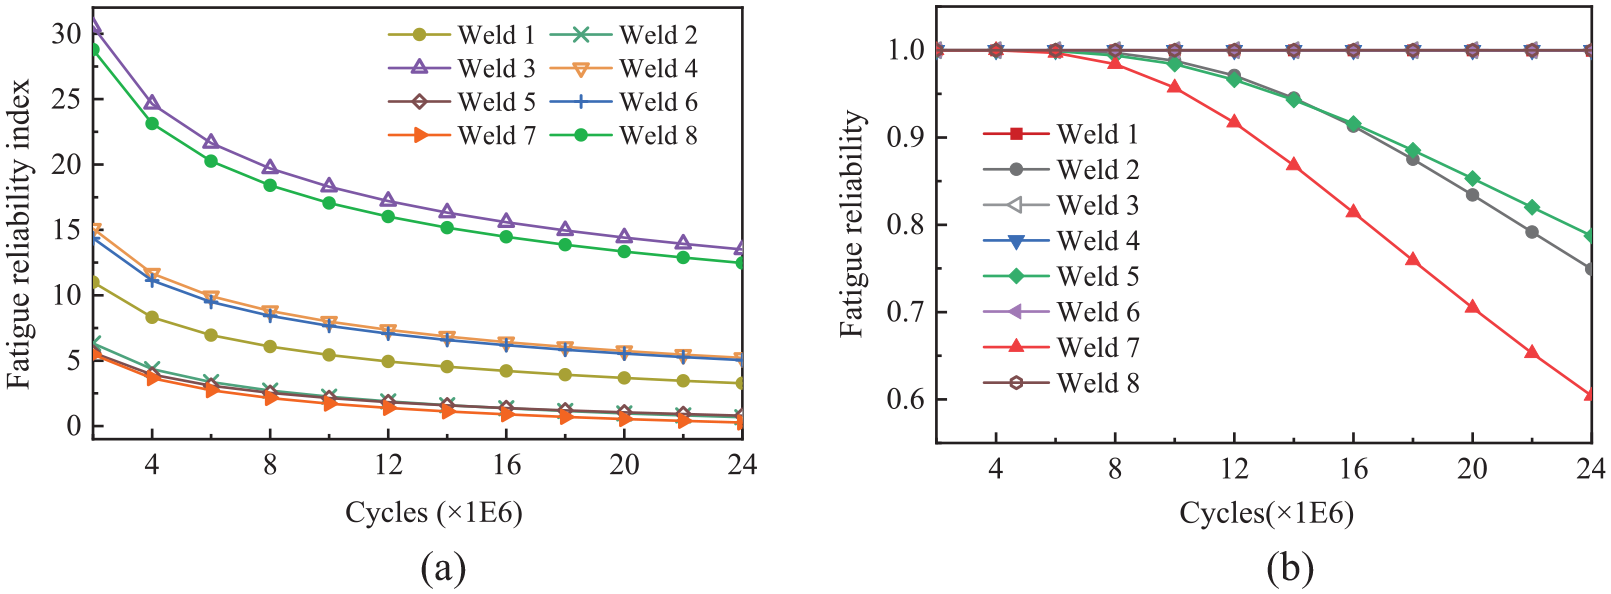
The service fatigue reliability assessment of the eight concerned welds. (a) Service fatigue reliability indexes and (b) service fatigue reliability.
The assessment of design-life fatigue reliability
The UIC615-4 design life of 1.2 × 10⁷ is adopted as a reference value for discussion. The design-life fatigue reliability index and reliability calculation results under the design life of eight welds are shown in Figure 12. The fatigue reliability of Weld 2, Weld 5, and Weld 7 in Figure 12 is relatively low, which matches the results of the assessment in Figure 11. Weld 2, Weld 5, and Weld 7 have the design-life reliability of 97.07%, 96.69%, and 91.70%, respectively.
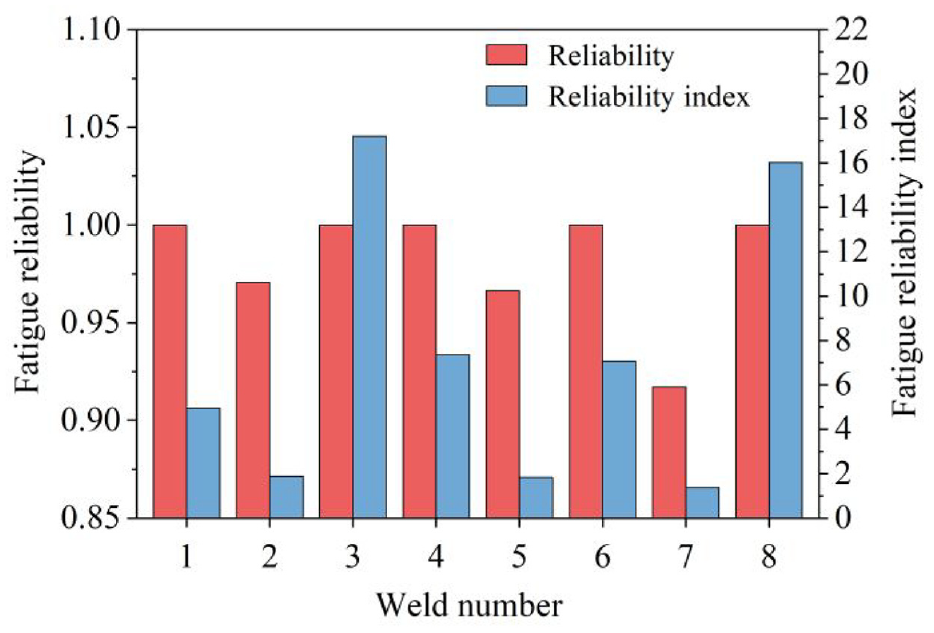
The design-life fatigue reliability of eight concerned welds.
Fatigue reliability improvement of weak welds on the welded bogie frame
From the study of the reliability of T-joints in Section 4.1, the weld leg size has a significant effect on the fatigue reliability of T-joints. Therefore, this section will change the Rlt for weak welds to investigate the assessment of fatigue reliability.
Designs for changing weld leg size
Five groups of FE models of the frame welds with the different Rlt were established without changing the plate thickness of the three welds. The changed weld leg sizes of the three welds are shown in Table 5.
Designs for weld leg size of weak welds.

Figure 13 shows that the structural stresses of Weld 2 and Weld 5 change by a small value as the weld leg size increases. With the increase in weld leg size, the structural stress of Weld 7 first decreases and then increases when the Rlt gradually increases. Unlike the monotonic falling and rising fatigue reliability produced by the simple forces on the T-joint in Subsection 4, the structural stresses in the actual work conditions of Weld 7 were more complex because the weld toe sections were subjected to multiple forces and bending moments simultaneously. With the change of geometric forms such as weld toe size and plate thickness, the fatigue reliability also shows irregular changes.

Trend of the Rlt and structural stress.
Improving fatigue reliability for weak welds
The results of the reliability assessment after changing the weld leg sizes of Weld 2, Weld 5, and Weld 7 are shown in Figure 14.

The relationship between Rlt and fatigue reliability of the weak welds. (a) Weld 2, (b) Weld 5, and (c) Weld 7.
Figure 14 demonstrates that the fatigue reliability of Weld 2, Weld 5, and Weld 7 in the design life is low with increasing weld leg size in the range of the Rlt smaller than 0.8. The fatigue reliability of all three welds is significantly reduced in designs with reduced weld leg sizes. The reason for this is that low Rlt creates stress concentrations at the weld. Therefore, the weld leg size should not be too short under the premise of a constant plate thickness. Comprehensive reliability calculation results for the three welds reveal that the Rlt is appropriate to be above 0.8.
As the weld leg size increases, the rate of growth of the design-life fatigue reliability of the three welds decreases. When the Rlt is greater than 0.8, the reliability of Weld 2 and Weld 5 does not rise with the increase in the weld leg size. When the Rlt is greater than 1.13, the reliability of Weld 7 appears to decrease rather than increase. In summary, when the Rlt is 1.14, 1.07, and 1.13, respectively, it is the appropriate design size. The fatigue reliability of the three welds was improved from 97.07%, 96.64%,91.70%, 99.30%, 99.29%, and 98.57%, respectively.
The preceding analysis shows that blindly increasing the weld leg size of welded joints will not only not improve fatigue reliability but also waste welded materials in welded structures. With the examples studied above, the selection of a reasonable weld leg size can improve the fatigue reliability of the welded joint. Furthermore, that can reduce manufacturing and maintenance costs.
Conclusions
In this paper, a quantitative fatigue reliability assessment model and design method for welded joints and structures based on the structural stress method is presented. This model provides a practical and effective way to improve the fatigue reliability of welded structures, and is of great significance in the engineering field. The conclusions reached in this study are as follows:
(1) The presented fatigue reliability assessment model and design method based on the structural stress method are effective in obtaining quantitative fatigue reliability for welded structures. T-joint and bogie frame examples show that the method can achieve quantitative design-life fatigue reliability and service life reliability from simulations of FE models.
(2) Fatigue reliability characteristics of various types of welded joints can be revealed by the proposed method. The fatigue reliability of T-joints examples accounting for different plate thicknesses, weld leg sizes, penetration depths, and single-sided and double-sided welds is assessed and compared. The assessment results showed that the fatigue reliability in the tension condition was better than in the bending condition. The weld toe was more prone to failure compared to the weld root. Increases in both weld leg size and plate thickness increased the fatigue reliability of both toe and root joints. When the Rlt was less than 0.8, the change in reliability was more pronounced. When the Rlt is greater than 1.2, the fatigue reliability of the welded joint did not increase much. For joints with a penetration depth of less than 60% of single-sided welding, the penetration depth had a greater impact on fatigue reliability, while the double-sided welding head had an insignificant one.
(3) The model and the design method proposed apply to fatigue reliability analysis and design improvement of complex engineer welded structures. The fatigue reliability analysis and improvement example of the welded bogie frame of a high-speed train showed that the fatigue reliability of the three weak welds was improved from 97.07%, 96.64%,91.70%, 99.30%, 99.29%, and 98.57% by adjusting the weld leg to the appropriate size. Therefore, the reasonable design of the geometric dimensions of welded joints reduced manufacturing and maintenance costs and improved the fatigue reliability of welded structures.
The novel model proposed in this paper to quantify the fatigue reliability of welded structures is remarkable and easy to use. It provides an effective method not only for understanding the fatigue characteristics of various simple welded joints but also for improving the fatigue reliability design of complex welded structures in the engineering field. The first-order second-moment method in the model has the limitation that the reliability calculation accuracy is not very high and can be replaced by other methods such as the Monte Carlo method to improve the accuracy. The method can also be applied to the fatigue reliability assessment and design of other types of welded joints and welded structures.
Footnotes
Handling Editor: Chenhui Liang
Declaration of conflicting interests
The author(s) declared no potential conflicts of interest with respect to the research, authorship, and/or publication of this article.
Funding
The author(s) disclosed receipt of the following financial support for the research, authorship, and/or publication of this article: This work was supported in part by the Dalian Science and Technology Innovation Fund Plan under Grant 2019J11CY017, the Basic scientific research project of Liaoning Provincial Department of Education under Grant LJKMZ20220831.