
Abstract
In this study, the fatigue behavior of welded joints in an orthotropic steel bridge is simulated and analyzed. The traction structural stress method is proven to be more accurate and effective, and the predicted results agree well with the test results compared to traditional assessment methods, including the nominal stress, hot-spot stress, and effective notch stress methods. The traction structural stress concentration factor curves of welded joints under cyclic tensile and bending moment loading are obtained. The accuracy and validity of finite-element simulation methods for welded joints in orthotropic steel bridge are verified by comparing simulation results with full-scale tests results. Equivalent nominal stresses predicted by the master S–N curve method based on traction structural stress results agree well with the fatigue test results with small standard deviation. The fatigue behavior of orthotropic steel bridge analysis specifications Eurocode3 and GB50017 is combined with the traction structural stress method using unified traction structural stress concentration factor curves. This approach provides practical guidance for the fatigue behavior design of orthotropic steel bridges.
Keywords
Introduction
There are numerous advantages of orthotropic steel bridges (OSBs), 1 which consist of transverse and longitudinal stiffening ribs, transverse partitions, and a bridge deck. OSBs are widely used in long-span bridges 2 that require a lighter weight, higher strength, and bearing capacity.3,4 Fatigue failure problems are regarded as a severe disadvantage of welded joints in OSBs due to their complex structure, long weld seams, residual stresses, and local stress concentrations. 5
The fatigue behavior of welded joints in OSBs is usually studied using the traditional nominal stress method and the hot-spot stress method; however, some researchers have applied the traction structural stress method in the study of fatigue behavior. The fatigue performance of an open-rib panel of an OSB through full-size model fatigue testing and finite-element simulation was studied by Aygül et al. 6 with nominal, hot spot, and notch stress method. Xiao et al. 7 studied the transverse stress and fatigue design strength of the joints in OSBs using linear elastic fracture mechanics and finite-element method. The fatigue properties of OSBs, including fatigue cracks in decks, fatigue life evaluation, and retrofitting decks, have been experimentally and theoretically studied using the nominal stress and hot-spot stress extrapolation methods.8–11 A comprehensive comparison of the nominal stress, hot-spot stress, and structural stress methods and the techniques for measuring welding toe stress were present by Kim and Kang. 12 Ji et al. 13 and Wang et al. 14 evaluated the hot-spot stress fatigue strength and fatigue failure mode of welded joints in OSB.
As a standard method for estimating the fatigue performance of OSBs, the nominal stress method has been widely used in European (Eurocode3 2005) 15 and Chinese engineering standards (GB50017 2017). 16 The European code Eurocode3 has been accepted and adopted for the fatigue design of OSBs in many countries. The nominal stress calculations and component fatigue categories of the welded joints in OSBs are presented in the code. Due to the lack of a specialized code, the specification for design of steel structures is applied in China. However, local stress concentration effects and local plastic deformation are not considered in the nominal stress method. In addition, the classification of welded joints in OSBs is comprehensive and uncertain.
Therefore, it is of crucial practical importance to analyze the fatigue behaviors of welded joints in OSBs using equivalent structural stress method17–20 considering stress concentration states, component thickness, and fatigue loading modes. The equivalent structural stress method has been widely used in the fatigue behavior analysis field and is included in the American Society of Mechanical Engineers (ASME) Div Code. 21
The stress concentration factor (SCF) is the ratio of the calculated structural stress to the nominal stress. Unfortunately, there is no clear SCF of nominal stress, and the classifications of welded joints in existing standards are complicated. The SCF of hot-spot stress is not uniform because of the sensitivity of element types, element size, classification of welded joints, and extrapolation methods.22–26 The SCF of effective notch stress is inaccurate due to indeterminate notch size and localized stresses around the notch. However, the SCF of traction structural stress is unique and uniform for specific welded joint types, loading modes, and constraint types, making it convenient for practical engineering fatigue design.
It is of interest to adopt the uniform traction structural SCF for analyzing the fatigue behavior and fatigue life of welded joints in OSBs. The effect of geometric differences on standards can be solved with the use of a standardized structural stress calculation method.
This article aims to combine the traction structural stress method with the traditional nominal stress method in Eurocode3 and GB50017 and obtain uniform traction structural stress factor curves for the design of OSB weld joints.
First, the finite-element method is used to verify the accuracy and compare the traction structural stress with traditional stress. Furthermore, the SCF curves of welded joints can be obtained using the traction structural stress method, which can be meaningful for the design of welded joints in OSB. The fatigue life simulation and fatigue behavior analysis contours simplify the fatigue analysis process, making it more accurate for fatigue evaluation using traction structural SCF curves.
Verification of finite-element simulation
Introduction of full-scale test and finite-element simulation method
Aygül et al.
6
studied the fatigue life analysis method of OSB decks by carrying out fatigue experiments of full-scale OSB models with the open longitudinal ribs. The dimensions, experimental phenomena, test results, and location and generation time of fatigue cracks of full-scale model specimens were examined in detail. The test specimen of a full-scale OSB model with an open longitudinal rib was made of S355 steel (Q355 in Chinese,

Orthotropic steel bridge test size.
The test specimen was supported by a rolling bearing at the bottom end of the specimen. Uniform vertical loading was applied to the top of the specimen to simulate cyclic vehicle loading. The cyclic loading amplitudes were 350–390 kN with a loading frequency of 2 Hz and a cyclic loading stress ratio of −1. The connection structure and stress form of the longitudinal rib and transverse diaphragm were complex. The strain gauge layout of the specimen hot spot is shown in Figure 2.

Strain gauge layout of specimen hot spot.
A finite-element simulation was performed for the local full-scale model fatigue test to assess its efficiency and accuracy based on the traction structural stress method. The hexahedral element, Solid 185, was adopted to simulate the base metal and welded zone in the OSB with a bilinear kinematic hardening material. The typical grid element size was 2 mm, while a smaller size of 1 mm was implemented at the hot-spot location for higher accuracy. The model and mesh are shown in Figure 3. The simulation applied a fixed constraint at the bottom of the finite-element model, and the fatigue loading was uniformly applied to the top of the beam.

Finite model and finite element.
Comparison and analysis of simulation and test results
The stress distribution and fatigue failure lives of the hot-spot zone are shown in Figure 4. The maximum Mises stress was located at the bottom end of the weld between the rib and web. Fatigue failure occurs more easily near the weld zone of welded components.

Stress distribution and fatigue lives of hot-spot zone.
The minimum fatigue life was a minimum at the bottom end of the welded seam, HS1, connecting the diaphragm web and rib plate. The fatigue life increased gradually from both ends of the weld seam to the middle. The fatigue life of HS2 was slightly higher than that of HS1. The results show that fatigue crack initiation occurred at the weld toe of HS1. In addition, a fatigue crack occurred at HS2, which extended from both ends to the middle along the direction of the weld seam.
According to the fatigue behavior test of the OSB, the fatigue cracks of all specimens were generated at the HS1 and extended along the weld seam, as shown in Figure 5. The fatigue failure observed was a fatigue crack, which expanded to 20–30 mm in length. This crack continued to expand until the specimen failed. The fatigue crack initiation location of each of the full-scale OSB specimens was all HS1. The fatigue failure life of full-scale OSB specimens under fatigue cyclic loading of 360 kN was 200,000 times with 0.9% error compared to the finite-element simulation.
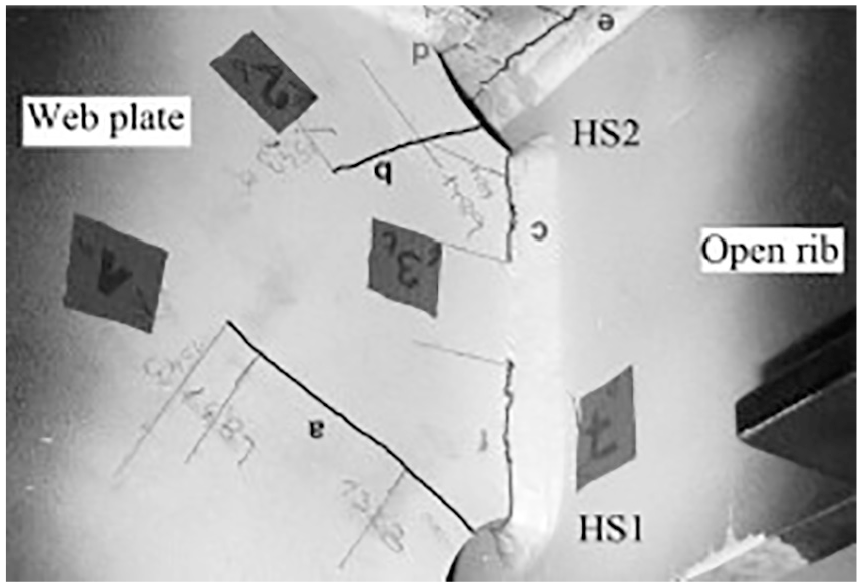
Fatigue crack extension along the weld line.
Figure 6 shows the hot-spot stress and traction structural stress at a distance of 0–12 mm from hot spots HS1 and HS2. The hot-spot stress of HS1 and HS2 were 189 and 181 Mpa, and simulated traction structural stresses were 204 and 195 Mpa, respectively. The traction structural stress was closer to the real stress of the toe location and was more significant than the hot-spot stress. Perpendicular to the welded seam, the traction structural stress gradually decreased with increased distance from the hot spot.

Hot-spot stress and traction structural stress of hot spots HS1 and HS2.
Figure 7 shows the hot-spot stress and traction structural stress of various spots alongside the weld line. The measurement distance of the finite-element simulation was 5 mm, and the distance of the test strain gauge was 40 mm. The results show that traction structural stress of hot spot HS1 was the largest, and the hot spot HS2 was slightly lower than hot spot HS1. The traction structural stress decreased sharply from hot spot HS1 to the middle position. The minimum traction structural stress was located at 30 mm and increased slowly from 30 mm to the position of HS2. The results show that the traction structural stress and stress trend of finite-element simulation were consistent with the experimental results. As such, the use of the finite-element simulation program was validated.

Hot-spot stress and traction structural stress of different spots along the weld line.
The fatigue performance of a full-scale local model of an OSB under cyclic fatigue loading of 350, 360, 380, and 390 kN was simulated and analyzed using the finite-element program. The experimental fatigue behaviors were then compared with the simulation results, as shown in Table 1. The error between the finite-element simulation and test results was 0.9%–7.6%. Individual test data of significant error was excluded, as it was caused by uncertainty in the analysis of the test data. The position of fatigue damage in the finite-element simulation method and full-scale model test were both located at the hot spot HS1. As well, the traction structural stress at various locations observed by the two methods was similar, and the stress trends were consistent.
Comparative results of experimental fatigue results and finite simulations results.
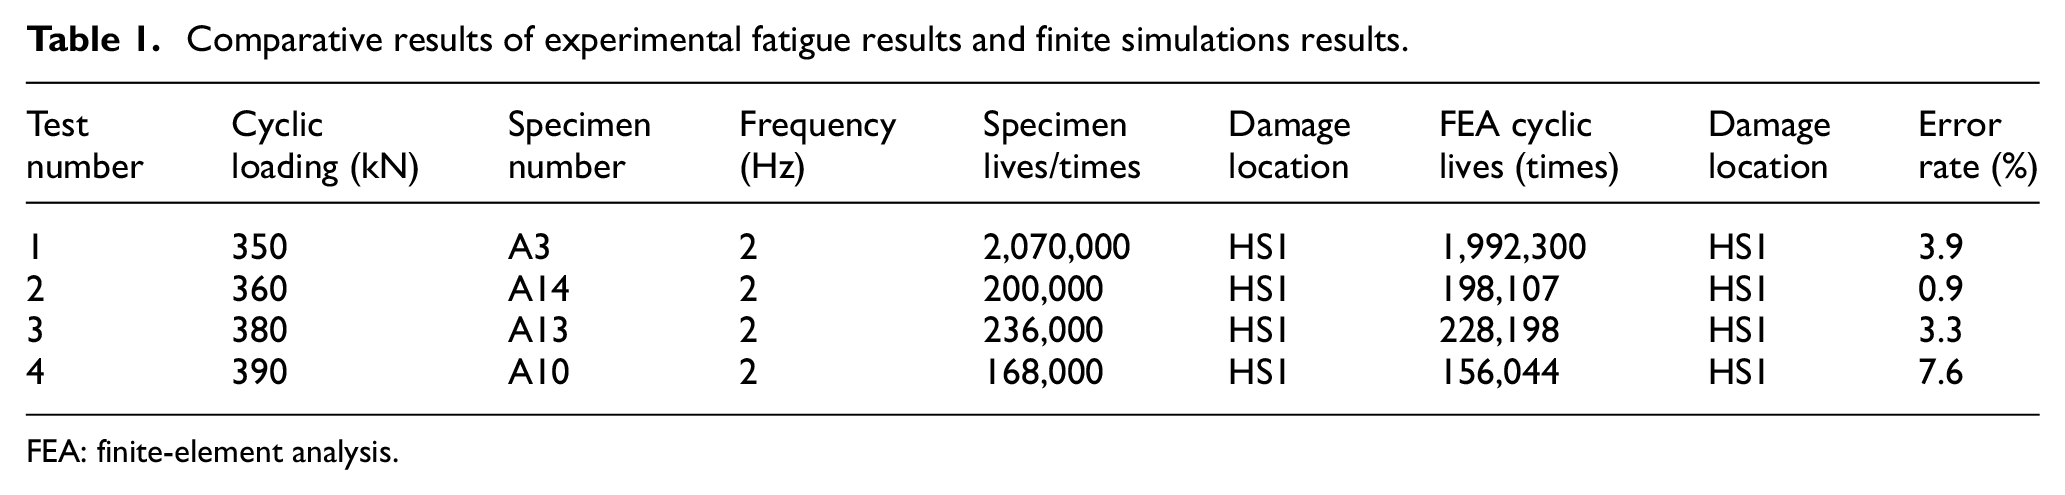
FEA: finite-element analysis.
In summary, the finite-element simulation method based on traction structural stress was proven to be accurate and useful by comparison to fatigue test results and finite-element simulation results.
Fatigue test data were analyzed, and the corresponding


It can be clearly seen from the comparative results that estimation lives predicted by traditional prediction methods, including hot-spot and effective notch stresses, are in good agreement with the recommended
Compared with traditional assessment methods, the results of the OSB specimens were in better agreement with the recommended traction structural stress
Fatigue behavior of welded joints in orthotropic bridges
Fatigue behavior analysis method of welded joints in OSBs
In order to analyze the fatigue behavior of welded joints in OSBs and develop the traction structural stress factor (SCF) curves, the traditional nominal stress method in Eurocode3 and GB50017 was combined with traction structural stress. Various welded joints under tension and bending loading in OSB were studied in order to obtain the traction structural SCF curves. Curve fits of the traction structural SCFs were developed, to be used for OSB fatigue design.
The welded joints in OSBs include welded H-shaped joint with stiffeners and partial penetration fillet weld (WH-Fu-UF), full penetration butt-weld joint in rib with a backing plate (BJ-Fu-F-P), full penetration butt-weld joint in rib without a backing plate (BJ-Fu-F), top flange to web junction with partial penetration tee-butt weld (TJ-PFu-F), top flange to web junction with a fillet weld (TJ-Fi-F), and fillet-welded lap joint (LJ-Fi-F). These joints are shown in Figure 10.

Welded joints types of OSB.
The detailed categories and curve parameters of welded joints in OSBs were given in Eurocode3 and GB50017 based on nominal stresses. The finite-element analysis schedules of welded joints were established according to welded joints type, base metal thickness, and fatigue detail categories in Eurocode3 and GB50017, as shown in Tables 2 and 3.
Detail categories of welded joints in OSB.

The detail category is set according to the Eurocode3.
Finite analysis schedule of welded joints in orthotropic steel bridge.

*The detail category is set according to the Eurocode3.
Fatigue behavior analysis of welded H-shaped joint with partial penetration fillet weld
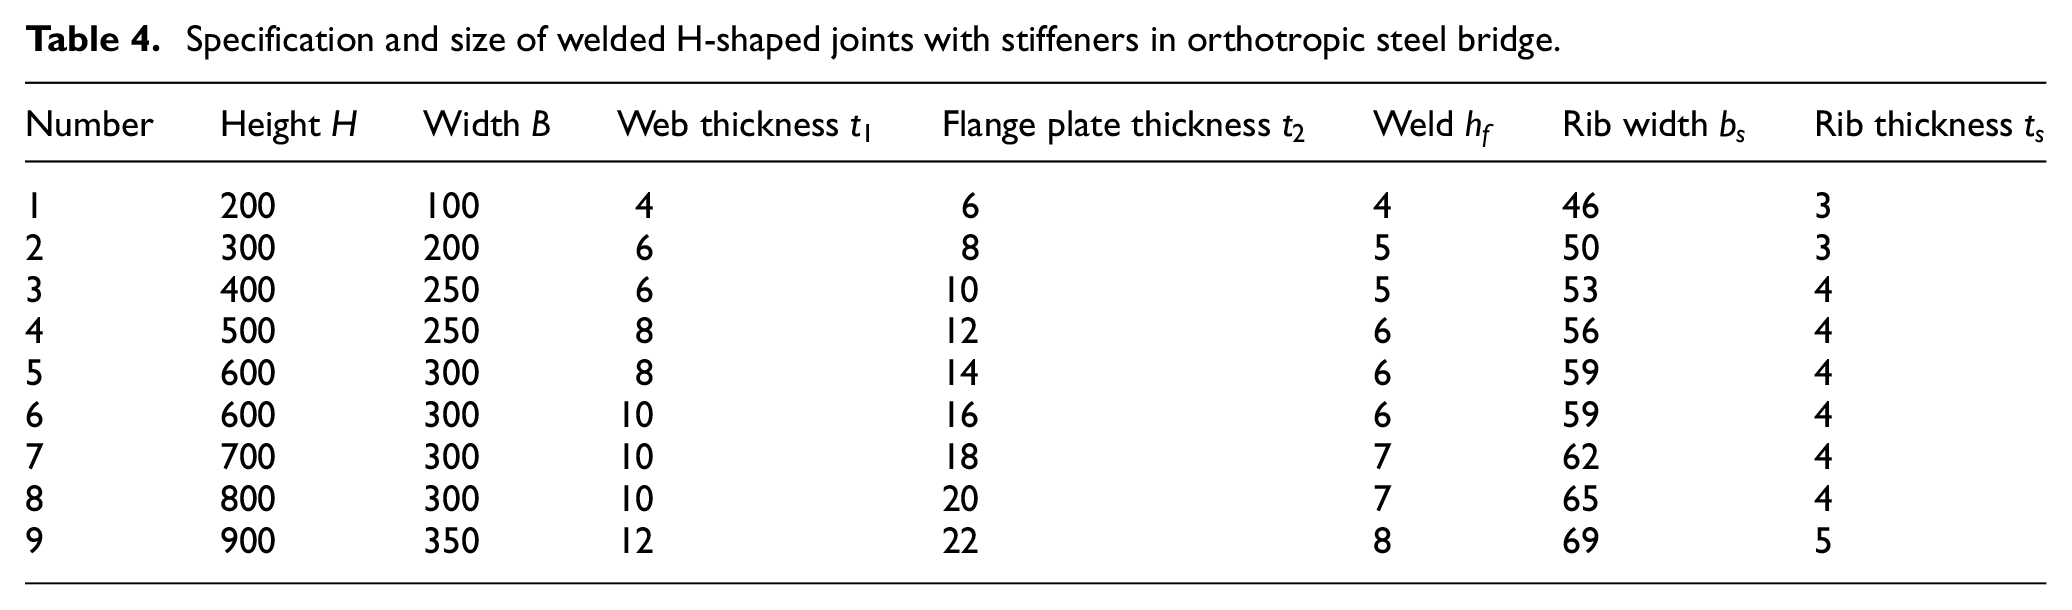
The welded H-shaped joint of various base metal thicknesses was constructed by a flange plate, web plate, and transverse rib. The specification and detailed size of welded H-shaped steel joints were determined by relevant standards, and the range of thickness of the flange plate was 6–22 mm, as shown in Table 4.
Specification and size of welded H-shaped joints with stiffeners in orthotropic steel bridge.
The static behavior of the welded H-shaped joint was analyzed using the finite-element model and constraints, and a uniform load was applied, as shown in Figure 11. The finite element, Solid185, was adopted for the components of the H-shaped joint and welded seams. The bottom of the flange plate was assigned zero displacement in all directions. Uniform surface loading was applied to the top of the flange plate to simulate the bridge deck under uniform vehicle loading.
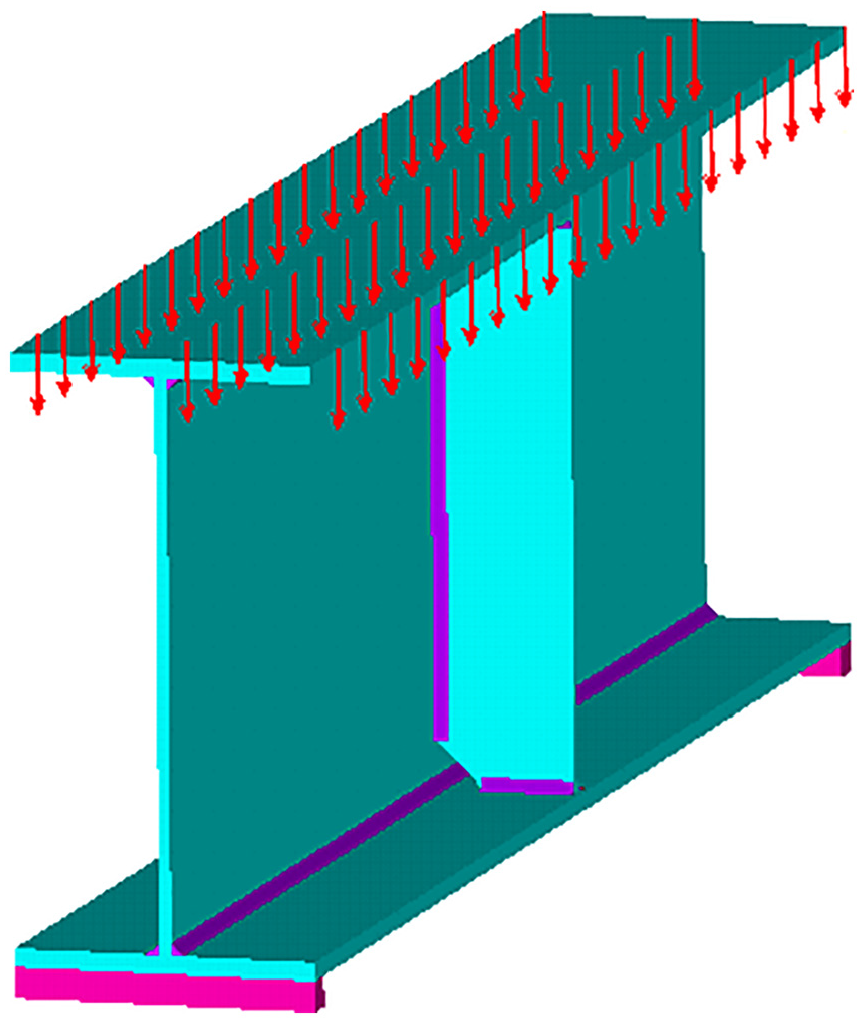
Finite model, constraint, and uniform load.
Figure 12 shows stress distribution of the flange and web plates under cyclic loading. It can be seen that the bottom side of the top flange is mainly subjected to tensile stresses, and the maximum stress is located at the welded seam of the rib and flange plate. The tensile stress of the top side of the bottom flange plate increases from both ends to the middle along the weld seam. The maximum tensile stress is located in the middle of flange plate. The upper side of the web is subjected to compressive stress, while the bottom side is subjected to tensile stress. The tensile stress increases from the top side to the bottom side, and the maximum tensile stress appears at the bottom of the web plate.

Stress distribution of flange and web plate (Pa).
The internal forces obtained using finite-element static analysis were analyzed to obtain traction structural stress–based fracture mechanics. It is known from the fatigue crack–generation mechanism that fatigue cracks are more likely to appear at the base metal near welded seams with significant tensile stress and lower fatigue life. Therefore, the base metal near the welded seam in the OSB was selected as the object of focus to analyze fatigue behavior.
Fatigue life contours of web plate and flange were obtained and are in Figure 13. The number in the contours is the base 10 log of the contour line. It can be clearly seen that the minimum cycle time for failure of base metal near the welded seam was 12,680,000 cyclic, and the failure occurred at the connection of the flange plate and rib. Based on the fatigue life distribution, the fatigue crack initiated first in the middle position of the flange plate and rib plate connection. Subsequently, the fatigue crack expanded along the welded seam and finally, the flange plate failed due to the fatigue crack fracture.

Fatigue lives contour of web plate and flange plate.
The factor of strength (FOS) is the ratio of the actual fatigue life to the design fatigue life. A smaller FOS value indicates a lower fatigue life. Figure 14 gives the FOS of the web and flange plate. The minimum FOS of the flange plate was 0.5188 and was located at the connection of the flange and rib plate.

FOS distribution of web plate and bottom flange.
Other specifications of welded H-shaped joints were analyzed to obtain behavior and internal forces under static loading. Traction stress, membrane stress, and bending stress 28 in the weld zone were analyzed based on the traction structural mechanics method, as shown in Figure 15.

Traction structural stress, membrane stress, and bending stress of web and flange plate.
The trends of traction stress, membrane stress, and bending stress of the web plate were consistent with the expected results, as the stresses at the end of the web were more significant than those in the middle. In addition, the maximum stresses were found at the top of the web. The flange plate was mainly subjected to bending moment, and the traction structural stress was dominated by the bending stress. In addition, the stress in the welded zone increased slightly from the outer end of the welded seam to the inner end.
The traction structural SCF includes the ratio of traction structural stress, membrane stress, and bending stress to the nominal stress which is the average stress calculated based on material mechanics. The various stress ranges were calculated using the fatigue analysis results based on the traction structural stress method. The SCF contours included the SCF of the traction structural stress, membrane stress, and bending stress. Formulas based on the SCF simulations were obtained, as shown in Figure 16. In the figure, FEA refers to the finite-element analysis, and NF refers to the numerical simulation.
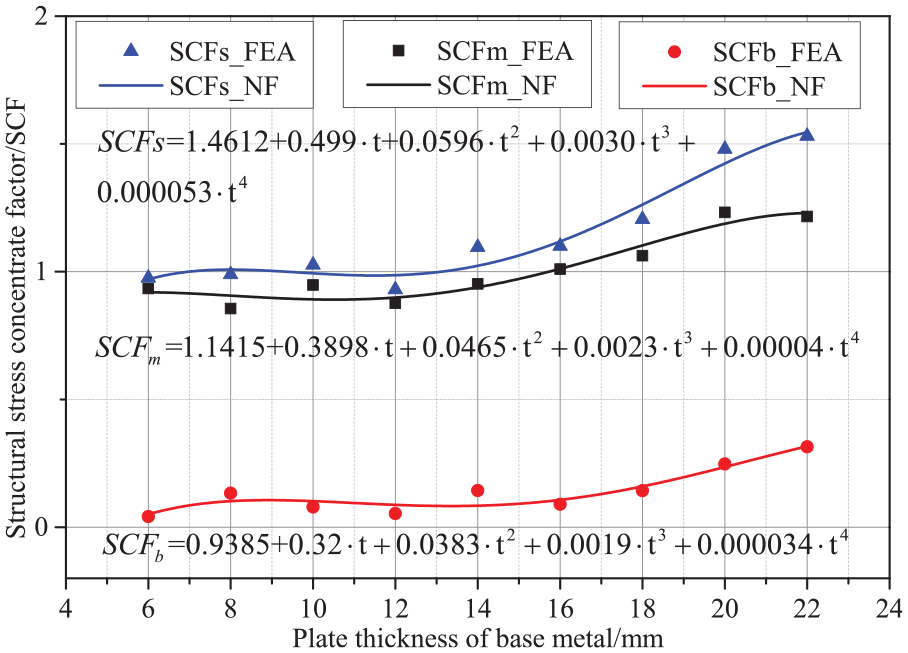
Traction structural stress factor of base plate thickness of welded H-shaped joint (WH-Fu-UF).
The nominal stress method was adopted to analyze and evaluate the fatigue life and fatigue behavior of the welded joints based on the component types found in Eurocode3 and GB50017. The traction structural stress method based on the master
In order to compare the differences of the evaluation methods used in Eurocode3, GB50017, and ASME 2007, the nominal stress and traction structural stress of various flange thicknesses were compared and are plotted in Figure 17. The results show that the stress range calculated using ASME 2007 approach was larger than Eurocode3 and GB50017. This shows that the calculation results of ASME 2007 were more conservative than the other two codes.

The comparison of traction structural stress and nominal stress in various standards.
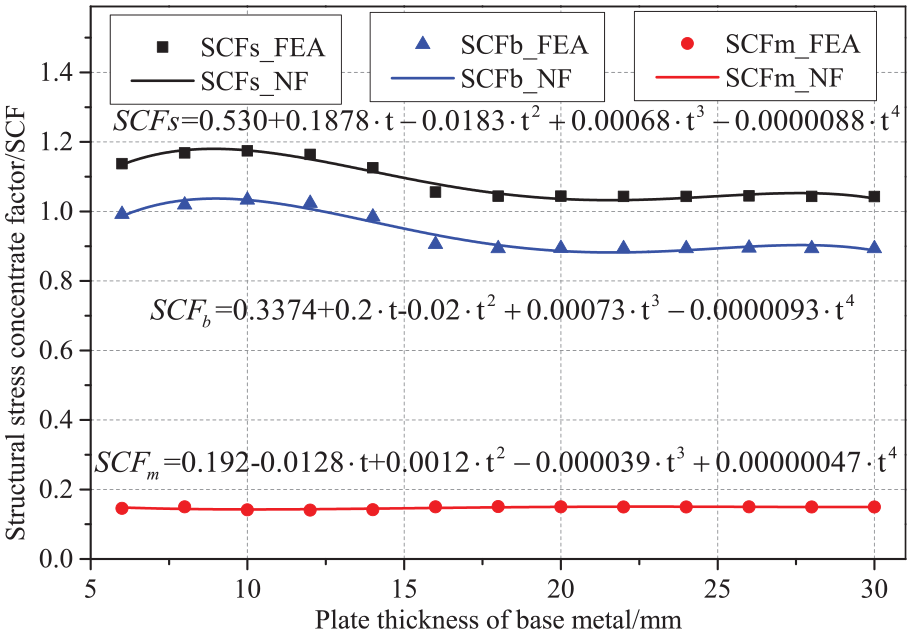
The welded joints in an OSB were analyzed using a fatigue behavior simulation program based on traction structural stress to obtain traction structural SCF curves. The results are shown in Figures 18–23. This approach can supplement and improve the fatigue behavior analysis system of welded joints in OSBs and provide theoretical guidance for the practical engineering fatigue design. In addition, the effects of geometric differences on standards can be solved with the use of the uniform traction structural stress method.

Stress concentration factor curve of BJ-Fu-F-P.

Stress concentration factor curve of BJ-Fu-F.

Stress concentration factor curve of TJ-PFu-F.

Stress concentration factor curve of TJ-Fi-F.

Stress concentration factor curve of TJ-Fi-M.
Stress concentration factor curve of LJ-Fi-F.
Application and accuracy verification of SCF curves method
The traction structural SCF curves were determined using the welded joints in an OSB. The traction structural SCF and the range of the traction structural stress can be calculated based on the base metal thickness in the practical construction of OSBs. The fatigue life and fatigue behaviors of welded joints in OSB can be obtained using the master
The application of the traction structural SCF can address problems related to the complexity of welded joints types, uncertainty of fatigue loading modes, and effects of local stress concentrations. This method has advanced theoretical design and has become essential for practical engineering applications and standards. As well, the uniform traction structural stress calculation method makes the standard brief and unified for the design of welded joints in OSB and resolves the effects of geometric differences.
The fatigue life and fatigue behaviors of welded joints in an OSB can be analyzed and assessed by applying the traction structural SCF curves.
First, possible fatigue crack locations can be assessed and determined based on welded joints type, loading modes, and the nominal stresses,
Second, the traction structural SCFs corresponding to different welded joint types and loading mode can be determined. The membrane stress range


Finally, the equivalent traction structural stress can be calculated considering the effect of base metal thickness and loading mode. Fatigue life cyclic,


Master

The application schedule of stress concentration factor curves method.
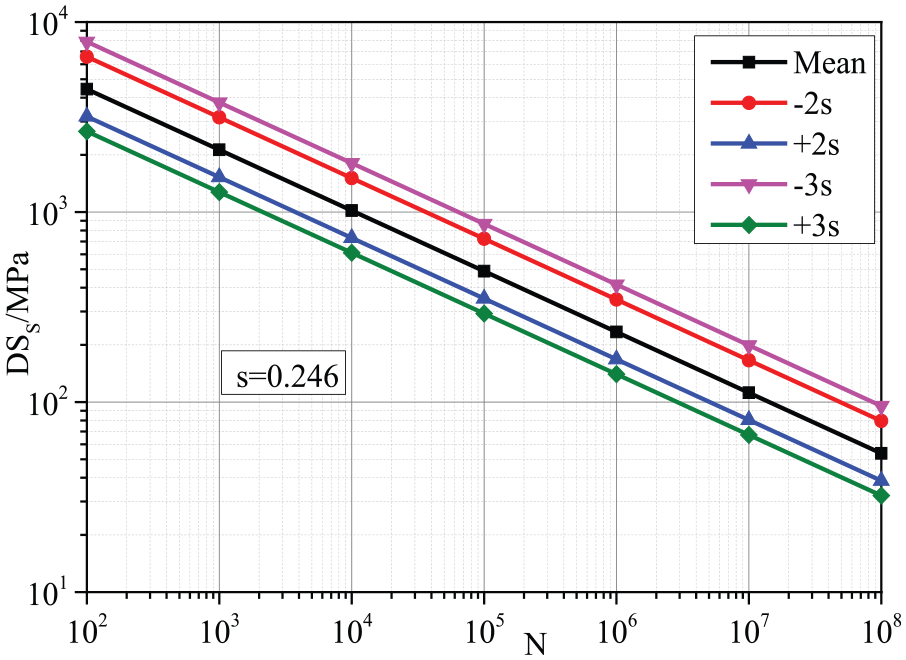
To verify the accuracy and effectiveness of the method based on the traction structural SCF curves method, predicted nominal stress–based traction SCF curves were compared with existing test data from independent research groups (nominal stress versus N).
Fatigue test data were obtained with the fatigue test of an SR202 T joint under a bending load. The base thickness of the fatigue test model was 22 mm, as shown in Figure 26. The fatigue test specimen was simply supported at both ends and loaded in the middle of the base metal.

SR202 T joint under bending load.
From the fatigue results, the fatigue crack initiation location was the bottom of the weld toe. The crack extended along the base metal. The model was analyzed with finite-element software and the traction structural stress method. The predicted nominal stress, namely the equivalent nominal stress, was obtained, as shown in Figure 27. The equivalent nominal stresses versus N predicted using the master S–N curve method had good agreement with fatigue test data based on the


Equivalent nominal stress range versus N for data from SR202.
Given the present results using the traction structural stress method, it is recommended that the unified traction structural SCF curves be added to the OSB standards, Eurocode3 and GB50017. In this way, the design standards can be briefly unified and more useful.
Conclusion
In this study, the fatigue behavior of welded joints in an OSB was simulated and analyzed using a traction structural stress method. Various categories of welded joints were determined in Eurocode3 and GB50017. The traction structural stress method was compared with traditional stress methods, and the accuracy of the simulation method was verified. The equivalent nominal stress was compared with fatigue test results, and traction structural SCF curves were obtained to be used in fatigue design.
Based on the present investigation, the following conclusions can be drawn.
The accuracy of the finite-element simulation method for welded joints in OSBs was verified by comparing the fatigue simulation results with experimental results from the full-scale OSB tests. By comparing to the experimental results, the traction structural stress was proved to be more accurate compared to traditional assessment methods, including nominal, hot-spot, and notch stresses.
The traction structural SCF curves of welded joints in OSBs defined in Eurocode3 and GB50017 were obtained using the analysis results. In addition, the master
The proposed equivalent nominal stress curves are determined, including the base metal thickness, constraints, and loading mode. Therefore, the problem of indeterminate and non-applicable joints type in traditional nominal S–N curves can be resolved. The present equivalent nominal stress curves with small standard deviation are recommended for the fatigue design of particular joint types in OSBs. These curves may replace the original S–N curves in standards for better predictions.
With the unified traction structural SCF curves, the fatigue behaviors based on the OSB analysis specifications in Eurocode3 and GB50017 can be combined with the traction structural stress method. This provides practical guidance for the fatigue behavior design of OSBs. It is recommended that the uniform traction structural SCF curves be included in the Eurocode3 and GB50017 specifications for OSB fatigue design.
Footnotes
Appendix 1
Acknowledgements
The first author gratefully acknowledges the support by the Natural Science Foundation of China. The co-authors acknowledge the financial support by a grant from the National Research Foundation of Korea (NRF) Gant through GCRC-SOP at University of Michigan under Project 2-1: Reliability and Strength Assessment of Core Parts and Material System.
Handling Editor: Grzegorz Lesiuk
Declaration of conflicting interests
The author(s) declared no potential conflicts of interest with respect to the research, authorship, and/or publication of this article.
Funding
The author(s) disclosed receipt of the following financial support for the research, authorship, and/or publication of this article: This study was supported by the Natural Science Foundation of China (grant nos. 51678191 and 51605116) and a National Research Foundation of Korea grant through GCRC-SOP at University of Michigan.