
Abstract
In order to describe the local cyclic behavior of welds during low cycle fatigue of welded structures, so as to effectively assess the low cycle fatigue of structures, a structural strain numerical method is proposed. Based on the plate and shell theory and elastic-plastic theory, the numerical method of equivalent structural strain parameter is derived, and the UMAT subroutine of ABAQUS software is used to solve the structural strain parameters directly. The fatigue life of the welded specimens of different materials was evaluated, and the predicted life was basically the same as the test life, among which the maximum error of the predicted life of structural steel was 12%, the maximum error of the predicted life of aluminum alloy was 15.7%, and the maximum error of the predicted life of titanium alloy was 7.3%. The fatigue data of different materials were analyzed by using the master E-N curve, and the results showed that all the evaluated fatigue data were distributed in the same narrow band of the master E-N curve, which proved the effectiveness of the equivalent structural strain range for the evaluation of low cycle fatigue of welded specimens.
Keywords
Introduction
Welded structures are widely used in aerospace, rail transportation, pressure vessels, and other industrial fields for their excellent manufacturability and economy.1–6 However, due to the stress concentration phenomenon caused by the geometrical discontinuity of welded structures, fatigue damage often occurs at the weld locations.7–9 Under the action of high-level alternating loads, the welded structure locally undergoes irrecoverable plastic deformation, which leads to low cycle fatigue damage of the structure. In order to ensure the reliability of welded structures in service, it is essential to perform low cycle fatigue assessment.
Nominal stress method, hot spot stress method, and notch stress method are commonly used for fatigue evaluation of welded structures. Among them, the nominal stress method has been incorporated into engineering standards because of its simplicity of use, but the calculation of the nominal stress method will lead to inconsistencies in the results due to the sparseness of the finite element mesh, and it is necessary to select the appropriate fatigue level according to the type of joints, and the fatigue analysis relies on the engineering experience of the designers. The hot spot stress method effectively takes into account the stress concentration phenomenon in the geometric details and is suitable for the fatigue evaluation of different types of joints of the same material. 10 However, the calculation of hot spot stress requires local refinement modeling, and the selection of different mesh sizes will affect the final calculation results, with mesh sensitivity. 11 The notch stress method takes the nonlinear peak stresses in the toe and heel of the weld as the fatigue assessment parameter, which takes into account the local geometric conditions of the weld and the stress concentration phenomenon of the joint. However, there are still some problems in assessing the fatigue performance of weldments by the notch stress method,12–14 for example, Liinalampi et al., 14 in their effective notch stress analysis of laser composite welded joints, found that it was difficult to characterize the fatigue strength of the joints given the ideal parameters for the variation of the actual geometrical dimensions and notch stresses.
The various fatigue assessment methods mentioned above have various difficulties in engineering applications, and the mesh sensitivity problem of fatigue assessment of welded structures was not completely solved until Dong et al.15–17 separated the structural stresses balanced with external loads from the nonlinear stresses at the weld toe. Jia et al. applied the structural stress method to the fatigue prediction of riveted joints in steel structures, established the S-N curves of riveted joints, and verified the reliability of the structural stress method through fatigue tests. Zhang et al.18,19 combined the Bootstrap method with the structural stress method to determine the minimum number of samples under the equivalent structural stress level, and obtained the appropriate number of resampling times through residual analysis to improve the accuracy of fatigue life prediction of titanium alloy welded specimens. Zhou et al. 5 used the first-order second-order moment method to reveal the absolute fatigue reliability of welded joints and structures, and proposed a welded structure reliability assessment model based on the structural stress method. The reliability of the assessment method is verified by analyzing the welded structure of the bogie. Lu et al. 20 consider the influence of dynamic stresses on fatigue design and durability assessment of complex welded car bodies. Combining the dynamic stresses with the structural stresses, the finite element transformation relationship between the random loads and the related dynamic structural stresses is constructed. The dynamic structural stresses were compared and verified by vehicle body tests, which verified the validity of the dynamic structural stress analysis method. Ke et al. 21 evaluated the welded structures of tracked vehicles using the structural stress method, and proved that the structural stress method can effectively analyze the fatigue life of welded parts. Zhang et al. 22 proposed a hybrid structural stress method to extend the structural stress method to the fatigue assessment of complex spot-welded structures, realized the structural stress solution under complex loading conditions, and verified its ability to correlate fatigue test data. When a welded structure undergoes low cycle fatigue damage, the structural stress parameters are nonlinearly distributed along the plate cross-section direction, and the application of the structural stress method based on the linear elasticity constitutive is limited. Therefore Dong et al. 23 proposed the structural strain method to extend the structural stress method to the field of low-cycle fatigue. Two important premises need to be satisfied for the use of this method: when the structure undergoes elastic-plastic deformation, it is assumed that the deformation along the thickness direction is still maintained in a plane; and it is assumed that the size of plastic deformation in the thickness direction of the plate is smaller than the thickness dimension of the plate, and that there exists an elastic core in the thickness direction of the plate.
It is worth noting that when weld fatigue is accompanied by significant plastic deformation, the hardening behavior of the material due to cyclic loading cannot be ignored, and the structural strain calculated based on the elastic-perfectly plastic constitutive tends to have a deviation from the real behavior of the material, leading to unrealistic plastic deformation. Meanwhile, local plastic deformation during low cycle fatigue failure under high stress level loading leads to elastic core failure in the direction of the plate cross-section, which makes the application of the structural strain method based on the elastic core assumption limited.
Therefore, this article proposes a numerical structural strain method that considers the cyclic behavior of materials. A structural strain calculation framework is established based on the elastic-plasticity theory and the plate-shell theory, cyclic stress-strain curve applicable to the incremental plasticity theory is derived, and a process of low cycle fatigue assessment of weldments is given. This article is organized as follows: first, the cyclic stress-strain curve applicable to the incremental plasticity theory is deduced. Then, the structural strain calculation framework is established, and the fatigue assessment process is given at the same time. Finally, the applicability of the method of this article is verified by analyzing the fatigue data of different types of welded joints.
Modified cyclic stress-strain curve
Structures under high-stress level cyclic loading will exhibit cyclic hardening or softening behavior. The phenomenon where the local stress of the structure increases with the increase in cycle number is referred to as cyclic hardening behavior, as shown in Figure 1(a). On the other hand, the phenomenon where the local stress of the structure decreases with the increase in cycle number is referred to as cyclic softening behavior, as shown in Figure 1(b).

Cyclic loading and unloading curve: (a) cyclic hardening, (b) cyclic softening, and (c) cyclic stress-strain curve.
To accurately reflect the impact of loading on structural mechanical properties, it is necessary to introduce a cyclic stress-strain curve. 24 Materials under high-stress level cyclic loading will rapidly harden/soften and then stabilize, forming a hysteresis loop. The bold solid line in Figure 1 represents the formation process of the hysteresis loop. Different loads will produce different hysteresis loops, and connecting the peak values of each hysteresis loop with a smooth curve passing through the origin gives the material’s cyclic stress-strain curve. Figure 1(c) represents the formation process of the cyclic stress-strain curve.
Several fatigue tests are needed to effectively fit the cyclic stress-strain curve, which is often labor-intensive. Therefore, finding a method that can predict cyclic performance through simple material properties is necessary. Smith et al.
25
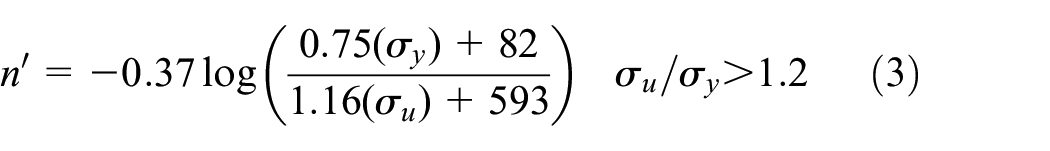
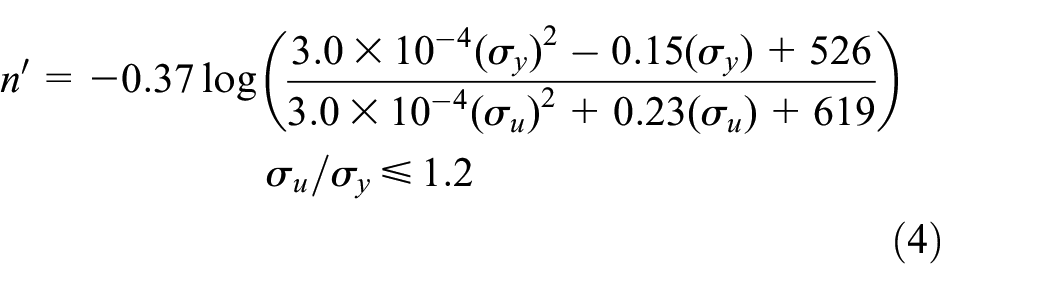
observed the mechanical properties of various metals and found a good correlation between cyclic performance and the ratio of tensile strength to yield strength
The cyclic strength coefficient is expressed in terms of yield strength and tensile strength:


Where,
The cyclic strength coefficient is expressed in terms of yield strength and tensile strength:
Where
The cyclic strength coefficient is expressed in terms of yield strength and tensile strength:


Where
The cyclic stress-strain model follows the Ramberg-Osgood relationship.

Where
The original Ramberg-Osgood relationship cannot distinguish between elastic and plastic regions. When loads are far below yield strength, the stress-strain relationship exhibits nonlinearity. The original Ramberg-Osgood relationship is modified using cyclic yield strength to facilitate incremental plasticity theory.

In the original Ramberg-Osgood relationship, total strain is a nonlinear term. When stress amplitude is less than yield strength, only elastic deformation occurs. In the modified Ramberg-Osgood relationship, when stress amplitude exceeds cyclic yield strength, the total strain is offset by
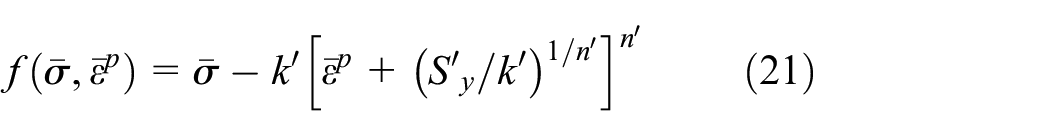
According to the modified cyclic stress-strain relationship, a convenient form is provided to express the effect of cyclic hardening/softening in plastic strain, that is,

Figure 2 gives the modified and unmodified cyclic stress-strain models. No significant difference exists between the cyclic stress-strain curve that distinguishes elasticity and plasticity and the original curve.

Illustration of idea of modified Ramberg-Osgood relationship.
Numerical method for structural strain
Structural strain method
The welding structure undergoes low cycle fatigue, causing local large plastic deformation. Dong et al. 23 proposed the structural strain range parameter using the master E-N curve to evaluate the low cycle fatigue of the welded joints.
Based on the Bernoulli-Navier theory, 27 the elastic-plasticity of the weld notch or material will not affect the total strain field, and the strain along the plate thickness direction is always linearly distributed. When the stress on the outer surface of the plate structure exceeds the yield strength, the distribution of structural stress and structural strain along the plate thickness direction is shown in Figure 3. The solid line represents structural stress, which is nonlinearly distributed along the thickness direction, and the dashed line represents structural strain, which is linearly distributed along the plate thickness direction. 28

Distribution of structural stress and strain in the thickness direction.
Therefore, structural strain can be linearly expressed as 28 :

Where
According to the theory of elasticity and plasticity, the total structural strain can be divided into elastic and plastic strain. 3D Hooke’s law can express the relationship of elastic strain:


Where
The plate structure is usually regarded as a plane strain problem with lateral constraints. It is further assumed that the shear stress and stress normal to the plate surface are negligible, that is,
Based on the linearization assumption of structural strain,


Where
Considering the influence of component thickness and bending ratio on structural strain parameters, a mechanical expression of equivalent structural strain range parameter is given 30 :

Where
The dimensionless function

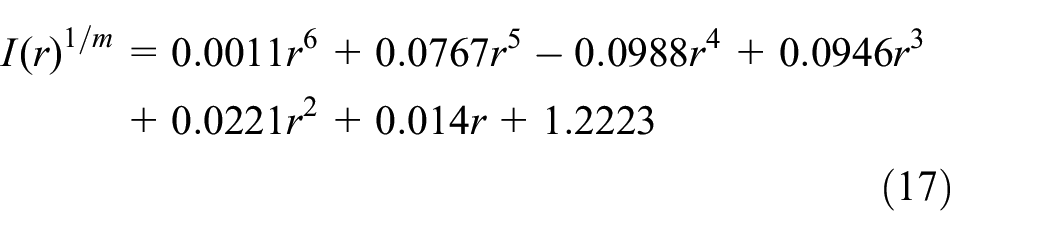
In the formula, the bending ratio

The master E-N curve evaluates the fatigue performance of welded structures based on the equivalent structural strain range parameter. The fatigue life of a welded joint is related to the equivalent structural strain range, which reflects the degree of strain concentration.

Where,
The parameters for the calculation of the master E-N curve fitted to the fatigue test data based on ASME standards are shown in Table 1.
Calculation parameters of master E-N curve. 1

Principles of numerical method
Based on the above derivation, calculating structural strain parameters is transformed into calculating plastic strain and structural stress under the nonlinear stress-strain model. In this section, we present the procedure for directly solving the structural strain parameters, using the commercial software ABAQUS for the finite element calculations.
Implicit integration is a widely used method in engineering to solve elastoplastic problems. When the trial stress predicted by elasticity exceeds the yield surface, the plastic correction will pull the stress back to the new yield surface to obtain the final true stress. 31 As shown in Figure 4, plastic correction satisfies the normalization assumption, so the direction of plastic correction is along the radial direction of the yield surface.

Radial retreat algorithm.
When the material undergoes plastic deformation, the calculation of trial stress is based on an elastic assumption:

Where
When the structure is in a multi-axial stress state, the equivalent plastic strain parameter replaces the plastic strain tensor. According to plastic flow law, hydrostatic pressure does not cause plastic deformation, plastic changes are only related to deviatoric stress tensor. For materials undergoing plastic deformation, it is assumed that the Mises yield criterion is satisfied:
Where
Assuming that strain rate effects are not considered, the stress state will never exceed the loading surface. When the stress state changes from the loading surface to the outside loading surface, the change of the stress state will produce new plastic deformation. At this time, the loading surface becomes:

Where
The equivalent plastic strain increment is solved according to equation (22), and the equivalent plastic strain increment is distributed according to the relevant flow law:


Where
Figure 5 shows the flowchart of the method of this article.

Flowchart of the method of this article.
Verification of the strain linearization assumption
The finite element algorithm was derived directly based on the strain linearization assumption. Therefore, it is necessary to verify whether the algorithm satisfies the strain.
Linearization assumption through the analysis of a plate section model. The plate section model is shown in Figure 6, with the material chosen as S235JR,
32
the chemical composition of the S235JR is given in Table 2, and the material parameters are shown in Table 3. One end is fixed, and the other end is loaded. The loads are

Verification model of strain linearization assumption.
Chemical composition of the S235JR (wt%).

Mechanical properties of the S235JR. 31

Figure 7(a) illustrates the stress distribution in the thickness direction within one cycle. It can be observed that the stress in the middle part is linearly distributed, but the stress near the upper surface of the plate is nonlinear. This is because the external load on the upper surface of the plate exceeds the yield limit of the material, and the stress-strain relationship no longer follows a linear change, resulting in a nonlinear stress distribution near the outer surface of the plate. Figure 7(b) shows the strain distribution in the thickness direction within one cycle. It can be seen that the strain along the thickness direction of the plate follows a linear change, satisfying the assumption of strain linearization.

Stress and strain distribution: (a) stress distribution in the thickness direction of the plate and (b) strain distribution in the thickness direction of the plate.
Fatigue life prediction
This section validates the effectiveness of the method proposed in this article by analyzing fatigue data from different types of welded joints. The classic ship T-welded joint is taken as the research object to analyze the low cycle fatigue data of the structure.
The experiment is based on the ship welding structure of the University of Hamburg, as shown in Figure 8(a). A small joint model with the same boundary conditions and loading conditions as the model is established. The joint is a T-joint welded by two gusset plates with a width of 40 mm, as shown in Figure 8(b). The crack location of the joint is shown in Figure 8(c). The failure location is at the weld toe of the top plate at the gusset end, and the crack extends along the thickness direction. The material is S235JR, and Table 3 lists the mechanical properties of the base material. Fatigue tests are carried out based on displacement control with a displacement ratio R = 1. Eight joints were tested under displacement amplitudes of 1, 1.5, 2, and 2.5 mm, respectively. The fatigue test life of the welded specimens is given in Table 4.
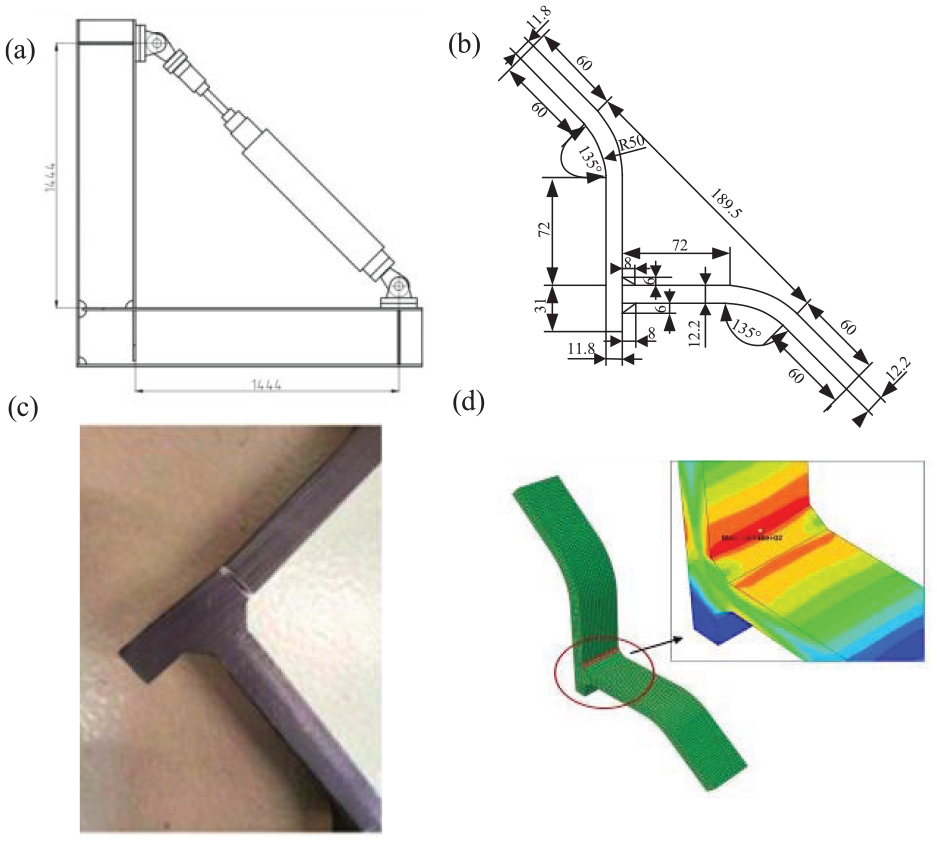
T-shaped structure of ships 32 : (a) welded structure of ship, (b) dimensions of T-shaped welded joints, (c) fatigue cracking location of welded joints, and (d) finite element model of T-shaped welded joint.
Fatigue test life of T-shaped welded joints. 32

The stress-strain curve and cyclic stress-strain curve of the material are drawn according to the mechanical properties of the parent material given in Table 3. The tensile stress-strain curve of S235JR low carbon steel can be approximated as an elastic perfect plastic curve. Figure 9 shows the elastic perfectly plastic material behavior and modified cyclic stress-strain curve of the material. It can be seen from Figure 9 that the monotonic tensile yield strength and cyclic yield strength of the material are close. When the stress is less than the yield strength, both the cyclic stress-strain curve and elastic perfectly plastic curve follow linear variation. Beyond yield strength, the cyclic stress-strain curve shows cyclic hardening.
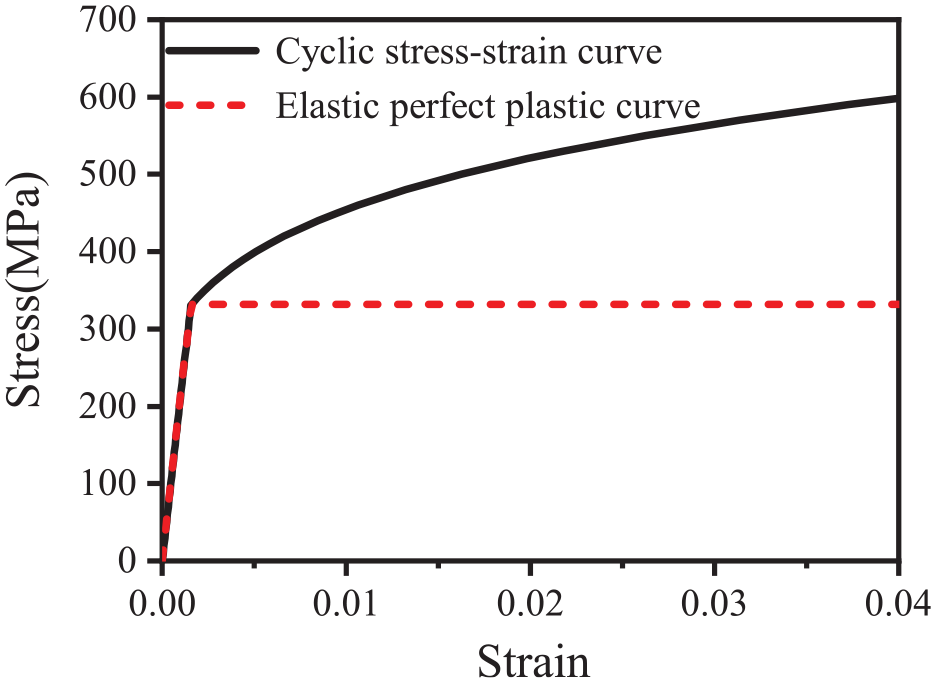
Elastic perfectly plastic material behavior and cyclic stress-strain curve.
A 3D finite element model is drawn according to the size of small joints, as shown in Figure 8(d). Compared with 2D finite element models, 3D finite element models can better reflect structural lateral constraints. The mesh is an eight-node linear hexahedral element (C3D8), and red solid lines represent the weld line. The maximum stress position in elastic-plastic finite element calculation results is in the middle position of the weld line.
Figure 10 shows structural stress and plastic strain distribution along weld line width direction under different displacement controls. It can be seen from Figure 10 that bending stress is much larger than membrane stress, indicating that joint deformation is dominated by bending. Both maximum positions of structural stress and plastic strain appear at the center position. When calculating structural strain for welded structures, the maximum point of structural stress at the center position is taken as a focus point.

Distribution of structural stress and plastic strain in the weld direction: (a) distribution of structural stress and (b) distribution of plastic strain.
The calculation results are distributed on the master E-N curve as shown in Figure 11, all data points fall within a narrow band, and the slope of fitted data points is close to the slope of the master E-N curve. This phenomenon reflects that the cyclic stress-strain curve can effectively characterize the material’s stress-strain behavior during low cycle fatigue of welded structures. It proves that equivalent structural strain range parameter calculated based on a modified cyclic stress-strain model can effectively analyze low cycle fatigue data.

Distribution of fatigue data on the master E-N curve.
Figure 12 compares the experimental life and the fatigue life predicted by the method proposed in this article. In the experiment, two types of fatigue life were tested under each working condition and the average life of each working condition was compared. When the master E-N curve is used to predict the fatigue life, the median life (50% confidence level) is selected as the comparison between the predicted life and the experimental life. From Figure 12 it can be seen that the experimental fatigue life and the predicted fatigue life are very close in the logarithmic coordinate system, with a maximum error of 12%. This proves the accuracy of the fatigue life prediction method proposed in this article.

Comparison of fatigue life.
Fatigue data correlation application
In this section, fatigue data from two different types of welded joints are analyzed to validate that the methodology of this article can effectively correlate high cycle fatigue and low cycle fatigue. These welded joints cover different types of base materials and fatigue behaviors ranging from high cycle to low cycle.
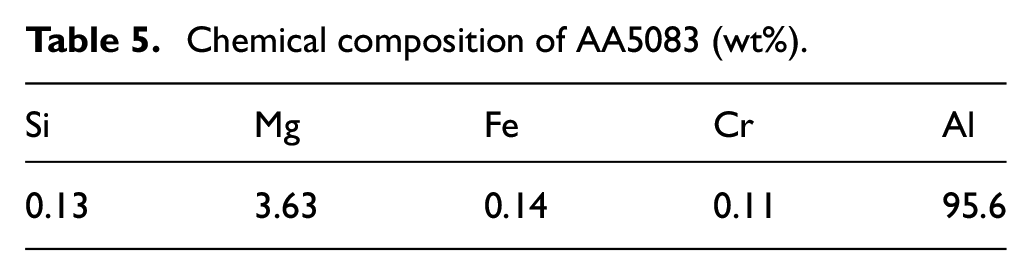
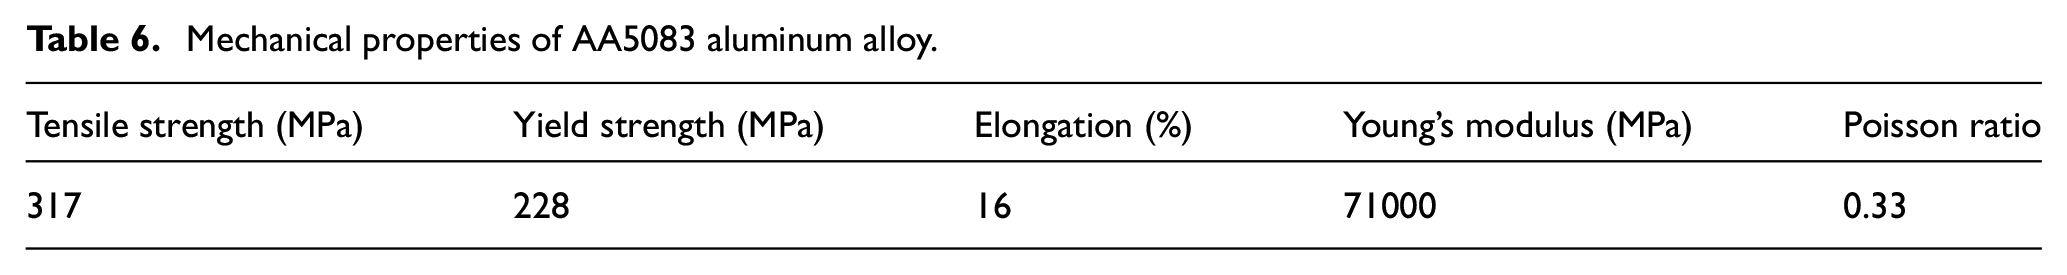
The first set of welded samples used for fatigue analysis was provided by the shipbuilder, and the study samples were made of AA5083 aluminum alloy and welded using the MIG process. 1 Table 5 shows the chemical composition of the material, while Table 6 reports the mechanical properties of the studied alloy base material. Figure 13(a) show the geometry of the specimen. The low circumferential fatigue tests were performed under displacement amplitude control with a displacement ratio of R = −1. The experimental results are shown in Table 7.
Chemical composition of AA5083 (wt%).
Mechanical properties of AA5083 aluminum alloy.

Two different types of welded joints: (a) T-joints and (b) cruciform joints.
Fatigue data of AA5083 welded joints.

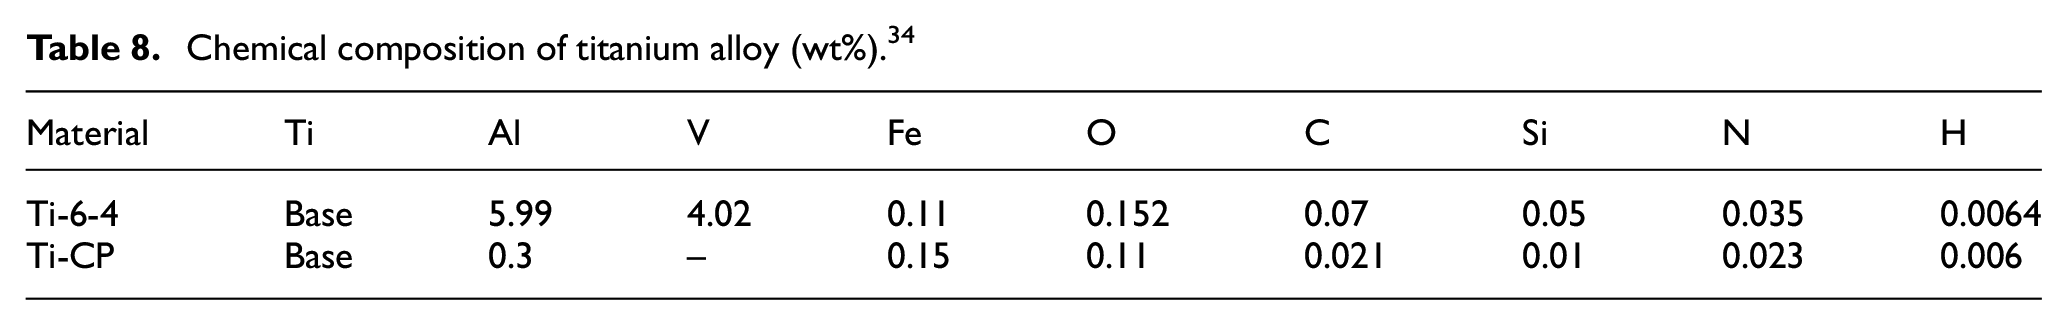
The second set of welded specimens were cross joints made from commercially pure titanium (Ti-CP) and titanium alloy (Ti-6-4) using TIG and MIG welding methods. 33 The chemical compositions of the materials are shown in Table 8 and the mechanical property parameters of the materials are provided in Table 9. The geometry of the welded specimens is shown in Figure 13(b), where t denotes the plate thickness and s denotes the weld size. It is worth noting that these fatigue tests were conducted mainly in the medium cycle to high cycle fatigue condition, and only the modulus of elasticity and Poisson’s ratio are required to calculate the structural stresses and strains. The fatigue lives of welded specimens corresponding to different plate thicknesses and weld seams are given in Tables 10 and 11.
Chemical composition of titanium alloy (wt%). 34
Mechanical properties of titanium alloy.

Fatigue data of Ti-CP welded joints.

Fatigue data of Ti-6-4 welded joints.

The finite element models of the two sets of specimens are shown in Figure 14. Equivalent structural strains were calculated according to the program given in Figure 5 and the low cycle fatigue life was evaluated using the master E-N curve. The structural strain calculations were based on the premise of modeling with C3D8 solid element capable of reflecting transverse constraints, with an average mesh size of 1 mm, and boundary and loading conditions consistent with the fatigue test loads.

Finite element model of welding specimen: (a) AA5083 welding specimen finite element model and (b) titanium alloy welding specimen finite element model.
The fatigue life predicted by the method of this article is compared with the experimental fatigue life as shown in Figure 15. Figure 15(a) shows the fatigue life comparison of welded specimens made from AA5083 aluminum alloy. The predicted results are close to the experimental results with a maximum fatigue life error of 15.9%. This demonstrates the effectiveness of the methodology of this article in assessing the fatigue life of welded specimens of aluminum alloys.
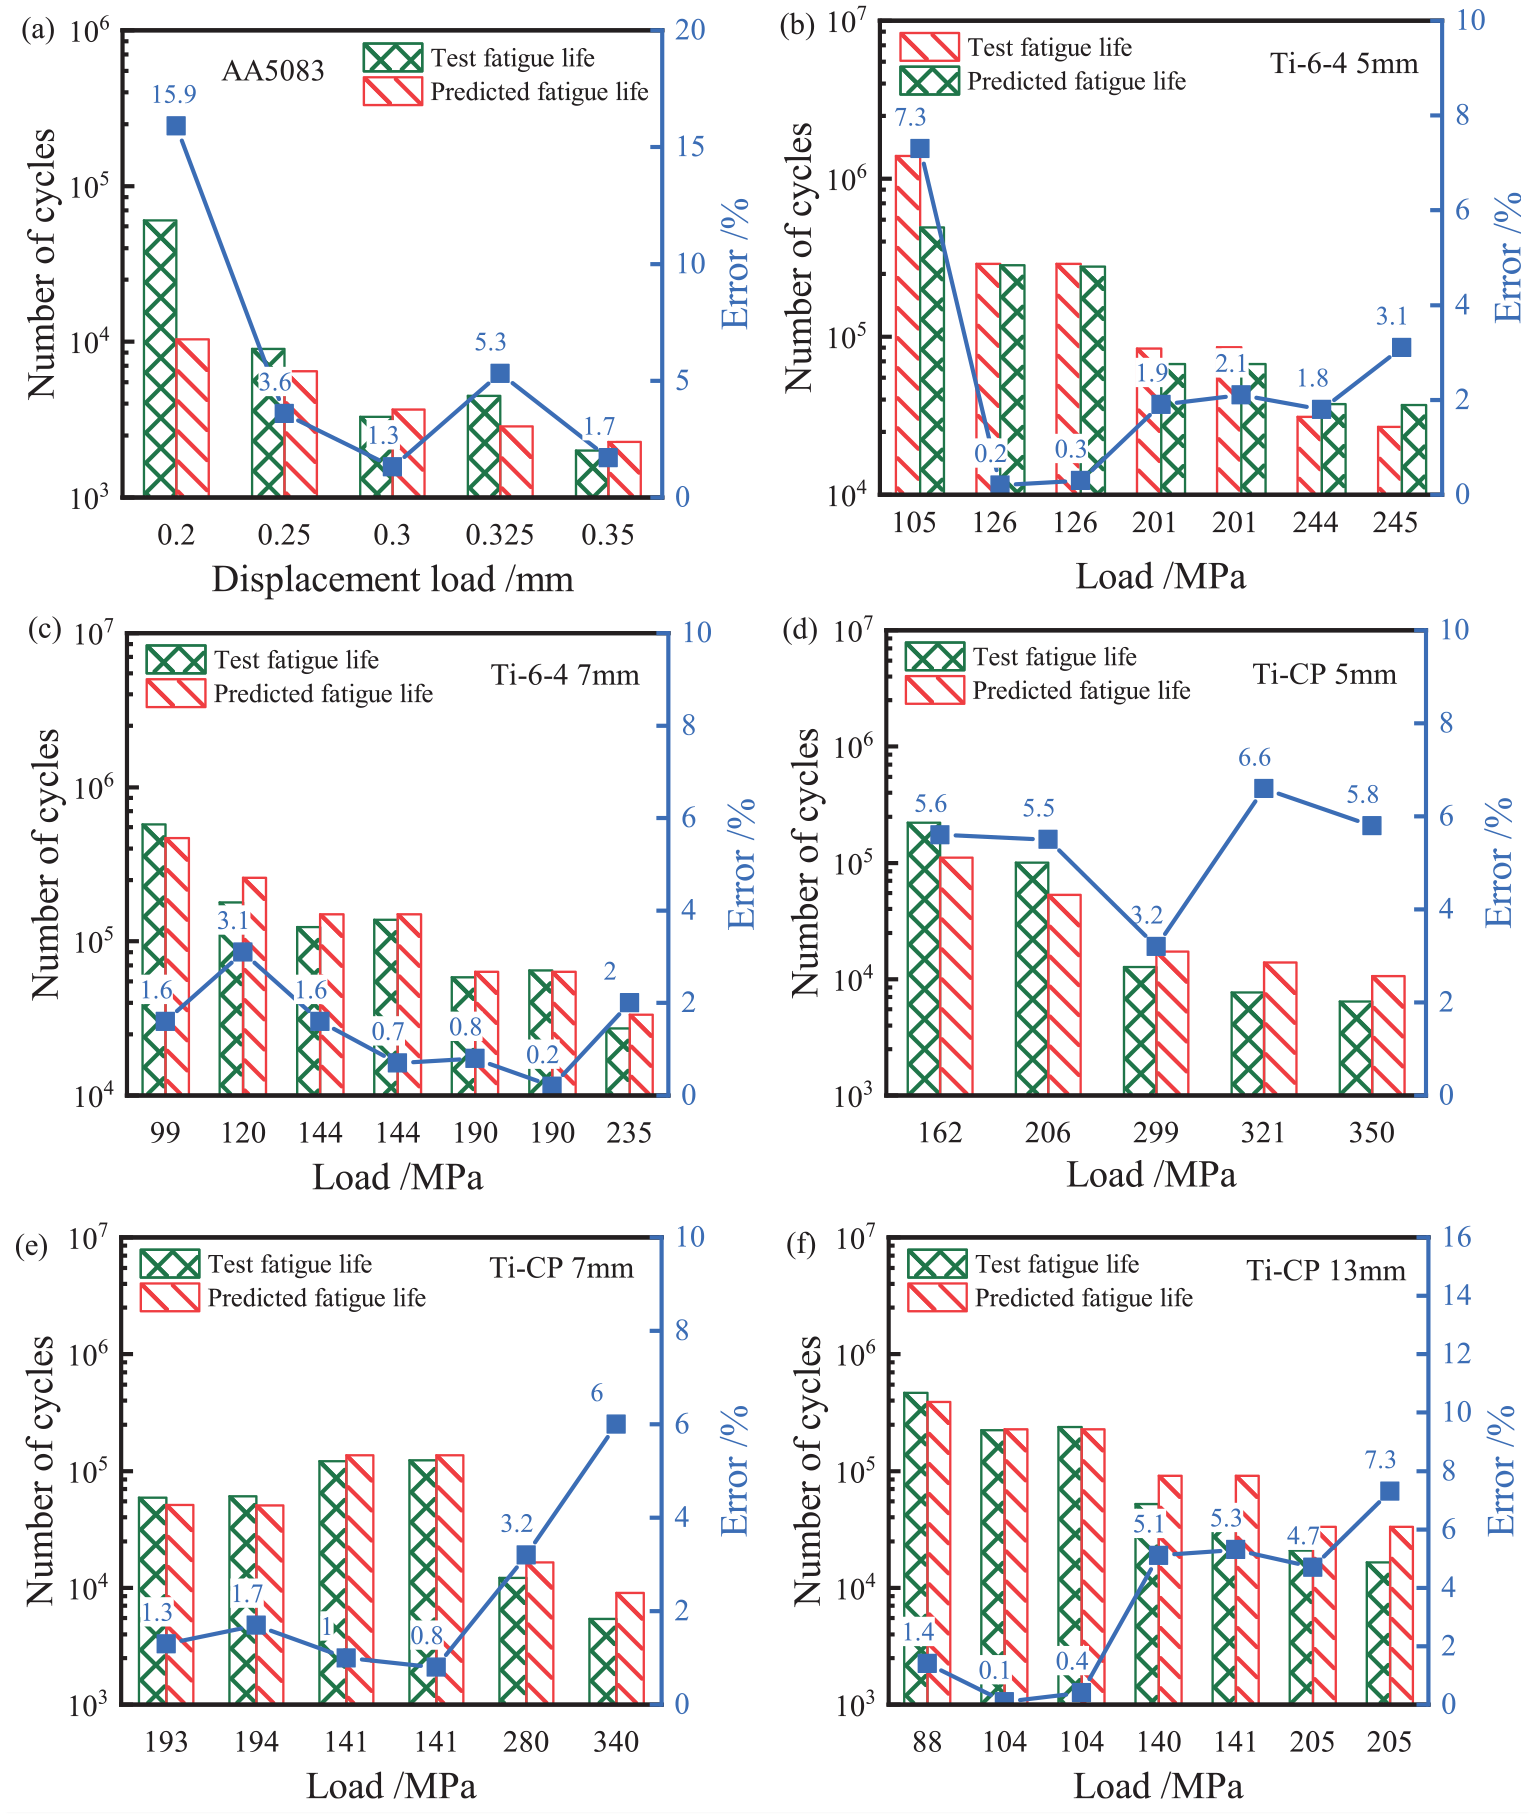
Comparison of experimental life and predictive fatigue life: (a) AA5083 fatigue life comparison, (b) Ti-6-4 5 mm fatigue life comparison, (c) Ti-6-4 7 mm fatigue life comparison, (d) Ti-CP 5 mm fatigue life comparison, (e) Ti-CP 7 mm fatigue life comparison, and (f) Ti-CP 13 mm fatigue life comparison
Figure 15(b) and (c) show the comparison between predicted and experimental lives of welded specimens of titanium alloy having different plate thicknesses. The predicted and experimental life are consistent with a maximum error of only 7.3%.
Figure 15(d) to (f) show a comparison between predicted and experimental life of titanium welded specimens with different plate thicknesses. The predicted life is consistent with the experimental life with a maximum error of 7.3%. This proves the validity of the method proposed in this article for evaluating the fatigue life of welded specimens of titanium alloys with different plate thicknesses. The method can effectively predict the fatigue life of welded specimens of different materials and plate thicknesses.
Figure 16 presents the distribution of fatigue data from two types of welded joints on the master E-N curve. Figure 16(a) shows the distribution of low cycle fatigue data for AA5083 structural steel, with all fatigue data falling within a linear narrow band, and most data closely distributed on both sides of the main line. Figure 16(b) shows the distribution of low cycle fatigue data for titanium alloys, with all data falling within a ±2σ narrow band, and the tilt degree of data points is close to the slope of the main line. Through Figure 16(a) and (b), it can be seen that the equivalent structural strain range parameter can effectively analyze the low cycle fatigue data of welded joints made from different materials, proving that strain can reflect the real deformation behavior of materials and fatigue test data from different materials can be effectively correlated based on strain parameters.

Distribution of fatigue data: (a) fatigue data of AA5083, (b) fatigue data of titanium alloy, and (c) all the fatigue data.
Figure 16(c) plots all fatigue data points into the master E-N curve, showing that all data fall within a linear narrow band, and the slope of fatigue data point distribution is close to that of the master E-N curve. This proves that this article’s method can effectively correlate fatigue data from different material welded joints.
Conclusion
In this article, a structural strain numerical method considering cyclic properties of materials is proposed. By analyzing the fatigue data of welded specimens of different material types, the following conclusions are drawn:
Classical ship T-welded specimens were analyzed, and the fatigue data were distributed near the median of the master E-N curve and the slope of the data point distribution was close to that of the master E-N curve. The fatigue life was predicted by selecting the 50% confidence curve, and the maximum error was 12% compared with the test life, which proved that the method in this article can effectively predict the low cycle fatigue life of structural steel welded specimens.
By analyzing the low cycle fatigue data of aluminum alloy welded specimens and comparing the test life with the predicted life, the maximum error is found to be 15.9%, which meets the engineering requirements. By analyzing the fatigue data of titanium alloy welded specimens with different plate thicknesses and comparing the test life with the predicted life, it is found that the maximum error is 7.3%, which meets the engineering requirements. It proves the effectiveness of the method of this article to predict the welding fatigue life.
By analyzing the distribution of fatigue data of structural steel, titanium alloy, and aluminum alloy in the master E-N curve, the results show that the fatigue data can all be effectively distributed in the same narrow band of the master E-N curve, proving the applicability and capability of the master E-N curve for assessing the welding fatigue of different materials.
Footnotes
Handling Editor: Sharmili Pandian
Author contributions
Shaocong Shi: Conceptualization, Methodology, Software, Writing Original draft preparation. Guangyu Qiu: Supervision, Writing Review & Editing. Zhaoyue Chen: Data curation, Investigation. Guangyuan Liang: Resources. Xiangwei Li: Supervision.
Declaration of conflicting interests
The author(s) declared no potential conflicts of interest with respect to the research, authorship, and/or publication of this article.
Funding
The author(s) disclosed receipt of the following financial support for the research, authorship, and/or publication of this article: The authors gratefully acknowledge the support of CRRC Technology R & D Plan Project, Basic science research project of Liaoning Provincial Department of Education (No. JYTMS20230039) and the National Natural Science Foundation of China through Grant No. 51875073.