
Abstract
The Variational Mode Decomposition (VMD) method was used to decompose the oil pressure signals containing different particle concentrations; the number of components of VMD decomposition is determined by using the criterion of joint comparison between the slope of the center frequency of each component and the main frequency of the component of VMD decomposition, and a method for determining the main components of the signal is proposed by the average energy value; the Hilbert envelope demodulation analysis was carried out for the maximum energy component of each pressure signal. The results showed that the larger the particle concentration in the oil, the greater the number of main components obtained by VMD decomposition, and the proportion of the main components per unit concentration showed a monotonically decreasing trend. The main frequency of the main component is the fundamental frequency of its signal or the multiplication frequency combined with the rotating shaft frequency; there is an amplitude modulation relationship between any components; with the increase of particle concentration, the fundamental frequency of the pressure signal decreases successively; the maximum energy component of each pressure signal has the characteristics of amplitude modulation and frequency modulation in different degrees.
Keywords
Article highlights
The larger the particle concentration in the oil, the larger the number of main components obtained by VMD decomposition.
With the increase of particle concentration, the fundamental frequency of pressure signal decreases successively.
The VMD decomposition components have amplitude modulation and frequency modulation characteristics of different degrees.
Introduction
It is very important to monitor the movement state of oil in a mechanical hydraulic system, especially the oil of a hydraulic system will inevitably intrude from the outside or generate some particle pollutants in the process of operation. The presence of these particles will change the turbulence characteristics of the oil1–3 and affect the turbulence coherent structure and pulsation characteristics of the oil. For example, Dritselis and Vlachos 4 pointed out that copper particles in the fluid would weaken the strength of coherent structures of turbulence and inhibit the development of these structures. Qi et al. 5 applied particle image velocimeters (PIV) to the flow field characteristics of two oils in the stirring vessel-soluble drag reducing agent(DRA) found that these additives have an effect on turbulence strength, turbulence kinetic energy (TKE) and energy dissipation rate (EDR) in the stirring vessel. The inhibition of turbulence intensity by DRA at concentrations below 10 ppm is not significant. However, turbulence inhibition is more pronounced at concentrations above 10 ppm. At this same concentration of 50 ppm, turbulence energy and energy dissipation rate are significantly reduced. He and Jackson 6 conducted an experimental study on the transient velocity of pulsating flow in the pipeline by using Laser Doppler Anemometry (LDA) technology, analyzed the influence of the mean value change of flow velocity and pulsating amplitude, and discussed the radial distribution and phase change of the modulation amplitude of average axial velocity and radial pulsating velocity root-mean-square in different frequency ranges; it is considered that the central part of the flow field under high-frequency condition presents the form of plunger flow, and the velocity amplitude is constant; with the decrease of the frequency, the range of the central frozen area shrinks until it disappears, the maximum speed is gradually transferred from the near-wall area to the central area, and the amplitude of the root mean square of the speed gradually increases. Khosravi Bizhaem and Basirat Tabrizi 7 conducted simulation and experimental research on the pulsation characteristics of gas-solid fluidized bed by using two-fluid models, and mainly analyzed the influence of different particle sizes at a 1–10 Hz frequency on the pulsation changes of time-averaged pressure drop, solid content, and axial velocity of the fluidized bed showed that with the increase of frequency, the amplitude of pressure pulsation decreases gradually, and the maximum axial velocity of particles decreases. Su et al. 8 developed a combined computational fluid dynamics and population balance model (CFD-PBM) to study the flow fluid dynamics of the pulp bed, which reduces the resistance between the gas and liquid phases by considering the modified drag model applied to the particles present. The simulation results show that the particle flow becomes more uneven, the upward flow is faster, which flows closer to the center and down the wall with this increased surface velocity. Papadopoulos and Vouros 9 carried out a numerical simulation study on sinusoidal pulsating flow with low Reynolds number and high frequency in a straight pipe, It is found that the amplitude of the fluid pulsation is approximately sinusoidal, and the frequency is the main factor affecting the fluid characteristics; at higher frequencies, the turbulence pulsation harmonic frequency phenomenon of the fluid will not occur, and the turbulence fluctuation induced by the pulsation of the viscous sublayer will not affect the average property of the turbulence. In the low-load flume flow experiment, Rashidi et al. 10 believed that large-scale particles could enhance the turbulent kinetic energy of the fluid and promote the change of the pressure and velocity of the fluid; on the contrary, the effect of small-scale particles could weaken the turbulent kinetic energy of the fluid.
The pulsating flow of oil is a typical unsteady and unstable flow problem. Since the particle size and particle quantity in the oil are a random distribution problem, the dynamic flow parameters in the time domain and frequency domain show a trend of drastic changes.
At present, the analysis methods of non-stationary signals, such as short-time Fourier transform (STFT), 11 Hilbert-Huang transform, 12 and analytical mode decomposition, 13 have their different problems. The resolution of the time-frequency of STFT is limited by the uncertainty principle; the Hilbert-Huang transform has fuzzy time-frequency distribution such as endpoint effect and mode aliasing, analytical mode decomposition is only suitable for analyzing stationary frequency multicomponent signals. Aneesh et al. 14 compared the influence of wavelet packet transformation and VMD on SVM classification of powder mass distribution. They concluded that VMD is better in signal feature extraction and classification accuracy. Zhao et al. 15 used VMD to de-noise the partial discharge signal of the transformer, and the results show that VMD can effectively remove sideband periodic interference and white noise. Wang et al. 16 used VMD to extract the characteristics of frictional multi-component signals of rotating machinery. Variational Mode Decomposition (VMD) is a non-stationary signal decomposition method proposed in recent years; the modal separation of multivariable signals can be realized by transforming the signal decomposition problem into a variational constraint problem. Variational mode decomposition due to the need to determine the parameters such as penalty function and number of component decomposition according to the prior knowledge and signal characteristics, many researchers have proposed a variety of improvement methods in signal analysis due to the disadvantage of the influence of subjective selection; such as a rapid iterative variational modal decomposition (FI-VMD) 17 is proposed to solve these problems, the simulation showed that FI-VMD was almost equivalent to VMD extraction accuracy, but when the energy of the flutter signal was very small, FI-VMD was better than VMD. In addition, since the initial frequency is the true frequency in FI-VMD iterative process, its computational efficiency is much faster than that of VMD. In addition, the proposed energy ratio difference is very robust under stable cutting conditions. When fibrillation occurs, it is more sensitive to flutter than to energy ratio. In order to determine the number of VMD decomposition components adaptively, Variational Mode Extraction (VME) is a novel technique that can effectively extract narrowband modes from multi-component signals. However, its performance is heavily influenced by two initial parameters: the initial guess of the center frequency and the equilibrium factor α. To determine these two parameters adaptively, a VME method based on VMD convergence is recommended for multi-fault diagnostics of rolling bearings. 18
There are many methods proposed, Qin et al. 19 proposed a minimum absolute contraction and selection operator (LASSO) regression method VMD decomposition based on the selection of component effective variables. This VMD- builds LASSO models for stock data, the results show that the model has high prediction accuracy. The VMD transforms the problem of solving the modal bandwidth into a constrained optimization problem, and decomposes each mode around a certain central frequency, which can adaptively realize the frequency domain segmentation of the signal and the effective separation of each component. Viswanath et al. 20 detected the peak voltage of the power interference signal by using VMD. They used the optimization algorithm of alternating direction multiplier to determine the Intrinsic Mode Function (IMF) and its central frequency that the VMD decomposed the signal. Moreover, many research results have been obtained by using VMD in combination with other methods to extract signal features; for example a classification algorithm combining autocorrelation function (AF), variational modal decomposition (VMD) and K-nearest Neighbor (KNN) was proposed 21 ; a genetic mutation particle swarm optimization variational Mode decomposition (GMPSO-VMD) algorithm was proposed 22 and applied to fault feature extraction of rolling bearing vibration signals. The variational mode decomposition-Support vector machine (VMD-SVM) model is used to detect chatter in robot milling based on information entropy (IE).23,24 The experimental results show that VMD-SVM improves the accuracy of recognition model. Considering that the variational mode decomposition (VMD) can achieve adaptive separation of complex signals, VMD has been applied to the identification of rotor–stator friction fault and position of aeroengine. The vibration signals of rolling bearings are often polluted by noise in the early failure stage, a new denoising SVD-VMD combining singular value decomposition (SVD) and variational mode decomposition (VMD) was proposed 25 ; SVD is used to determine the structure of the underlying model and VMD is used to decompose the original signal into several band limited modes. Then the denoising signal is reconstructed by selecting effective components from these modes according to the difference spectrum (DS) of singular and kurtosis values. The simulation and experimental signals of roller bearing faults are analyzed by using this method and compared with SVD-DS. The results show that the proposed method can effectively preserve the useful signal and de-noise the other bit signal in the noisy background.
According to the non-stationary signal feature of multi-scale, quasi-periodic of the oil pulsation flow, we analyzed the pressure characteristics of oil pulsation flow based on VMD. 26 In this paper, The VMD method was used to analyze and process the pressure fluctuation signal of oil containing different particle concentrations. Therefore, the outline of the rest of this paper is as follows. In Section 2, the experimental equipment is set up for the pulsating flow of oil liquid. In Section 3, a method for determining the main component of the signal is proposed by the average energy value, to realize to extract and analyze the main component of VMD of the oil pressure signal with different particle concentrations; and then the largest energy value of the component is analyzed using the Hilbert envelope demodulation, to explore the influence of the particle concentration of the frequency components of the pressure signal. Finally, we conclude in Section 4.
Experimental devices and methods
Experimental devices
The schematic diagram and the experimental apparatus of the experimental devices of oil pulsation flow is shown in Figures 1 and 2, respectively, which mainly includes two parts: the experimental pipeline, and the data acquisition system. The section of the experimental pipeline is 0.04 m × 0.04 m square, and the length is 0.5 m. A cartesian coordinate system is established, as shown in Figure 1, the coordinate origin is the vertex at the lower-left corner of the experimental pipeline, the x-direction is the flow direction of the oil, the y-direction is the spanwise direction, and the z-direction is the normal direction.

The schematic diagram of the experimental equipment for pulsating flow of oil liquid.

The experimental apparatus for pulsating flow of oil.
The data acquisition system mainly includes an oil pressure transmitter and pipeline vibration transmitter, NI PXI data acquisition card, and LABVIEW data analysis and processing software. The pressure transmitter1 and 2 adopts yp-01s model with a measuring range of −0.1 to 2.0 MPa, the accuracy of 0.2%, and output of 0–5 v, which is used to collect the gage pressure change signal of the inlet and outlet oil of the experimental pipeline; The vibration transmitter set at the outlet of the experimental pipeline adopts LC0123 model with a precision of 0.08%, and the vibration signal of the experimental pipeline is detected. The real-time data such as pressure and vibration collected by the system are transmitted to the LABVIEW software in the computer through the NI PXI acquisition board, and the dynamic parameter information of pressure, acceleration is filtered, denoised, and analyzed.
Liquid experimental methods
LABVIEW software is used to compile the front panel and program block diagram of the data acquisition system; the front panel mainly contains the parameter setting area and the waveform display area, with the button controls such as filter, data saving and image saving et al. so the function of filter starting, experimental data can be realized. The waveform display area shows the changes of the inlet pressure, outlet pressure, and vibration (acceleration) of the pipeline oil with time in real-time; the parameter setting area could be select parameters such as connection mode, sampling rate, sampling number, and sampling method of the NI-DAQmx task signal. The selection of specific parameters of the paper is shown in Table 1.
The selection of specific parameters.

Program block diagram corresponding to the front panel, connect the input and output programs that appear in the front panel with some (loop, sequence) structure and so on using line segments. The front panel controls can communicate with each other.
The oil used in the experiment was 46# hydraulic oil (Royal Dutch/Shell Group of Companies) acted as the original oil. The initial oil sample was obtained by filtering the original oil with neutral filter paper. Cu, Fe, and SiO2 powder were selected for particulate matter. Weigh 0.02 g Cu, Fe, and SiO2 powder and mix with 1 L the initial oil sample respectively, the ultrasonic oscillator vibrates evenly after 8 h (temperature 30°C ∼ 60°C). Then the filter paper with different pore sizes was extracted and filtered, the oil samples with a medium diameter of 5, 15, 25, and 50 μm are obtained with concentrations of 14.4 ppm. The initial oil sample was added to the oil sample of this concentration in a certain volume proportion. After 8 h (temperature 30°C ∼ 60°C) of ultrasonic oscillator oscillation uniformity, the oil samples containing particles with different medium diameter concentrations of 0.648, 0.971, 3.00, 4.57, 6.58, 14.40, and 28.50 ppm gradient were obtained, respectively. After the oil samples are fully mixed, there are placed in the oil tank and fed into the experimental pipeline through a peristaltic pump respectively; the initial inlet velocity is V0 = 0.0362 m/s. After the oil sample passes through the development section of the pipeline, it flows into the test section and enters the oil tank through the tail section, forming a cycle.
The oil sample with different particle concentrations was put into the experimental pipeline for 10 min; after the oil in the system changed steadily, the data sampling of each parameter was started.
The block diagram of the proposed research for pulsating flow of oil liquid is presented in Figure 3.

The block diagram of the proposed research for pulsating flow.
VMD analysis method
The pressure signals are in the inflow and outflow of the two ends close to the experimental pipe section of the installation of pressure sensor 1 and 2, and the use of experimental pipe segment vibration sensors, these three test values to differentiate, in order to eliminate the vibration effect of the experimental pipe segment, and then the two pressure signals differentially acts as the oil pressure signals containing different particle concentrations.
The VMD decomposes the signal into several inherent modal functions (IMF), which is an adaptive non-recursive signal decomposition method; the interactive direction multiplier algorithm is used to solve the process based on the constrained variational optimization problem. The details of VMD analysis methods are available in the literature. 26
Results and analysis
VMD decomposition of pressure signal
VMD decomposition was carried out for pulsating flow pressure signals of oil at particle concentrations of 0.648, 0.971, 3.00, 4.57, 6.58, 14.40, and 28.50 ppm, respectively. The combined criteria of central frequency slope and main frequency was used to determine the number of components of VMD decomposition, the number of mode components of oil pulsating flow pressure signal with different particle concentrations was obtained, as shown in Table 2. Since the energy values of each component in the pressure signal represent the primary and secondary order of the component in the signal, it is verified by simulation signal analysis that the component whose energy value is greater than the energy mean of all components decomposed by VMD is the main component of the signal; Accordingly, the number of main components of VMD decomposition of oil pressure signals of different particle concentrations was obtained, as shown in Table 3. The ratio (R1) of the number of main components to the number of total components of pressure signals decomposed by VMD maintain an increases trend with the increase of particle concentration; that is, the greater the particle concentration in the oil, the more the number of main components obtained by VMD decomposition. It shows that the pressure signal with higher particle concentration in oil contains more main components. However, the proportion (R2) of the main component of the pressure signal at the unit concentration (ppm) of different particle concentrations tends to decrease monotonically with the increase of particle concentration. It indicates that although the number of components contained in the pressure signal is more when the particle concentration is higher in oil, the utilization rate of all components decomposed by VMD is lower than that of all components decomposed by VMD at low particle concentration. In other words, the proportions (R2) of the main components of VMD decomposition at low particle concentration are larger, and the components contain more pressure signal information.
VMD decomposition components of pressure signals with different particle concentrations.

The corresponding parameters of the main components of the VMD decomposition of each pressure signal.

According to the sequence numbers of the main components obtained by VMD decomposition of pressure signals at different particle concentrations, the central frequency, instantaneous frequency means value, and the main frequency of the main components were compared in the order of the corresponding energy ratio from large to small, as shown in Table 3.
As can be seen from Table 3, for the oil pressure signal containing 0.648 ppm particle concentration, the number of main components decomposed by VMD is 8, among which the mode1 energy ratio is the largest. The center frequency of each main component was in good agreement with the mean instantaneous frequency, and the error was between −0.98% and 3.74%. According to the criterion for the number of components of the pressure signal of VMD decomposition is the joint comparison between the slope of the center frequency of each component and the main frequency of the component, when the main frequency is 10.7422 Hz, the number of VMD decomposition components of the pressure signal is 23. The coincidence between the main frequency of each main component and the corresponding component center frequency is worse than that between the component center frequency and the mean instantaneous frequency, the error between 4.91%and 13.89% change. Since the center frequency of each main component is obtained through the optimization iteration of the constrained variational model, the relation of each main component is analyzed with the main frequency of each component. It can be seen that the main frequency 10.7422 Hz of mode1, the main component of the pressure signal with 0.648 ppm particle concentration, is the fundamental frequency of the pressure signal at the particle concentration. The main frequency of mode2, 28.3203 Hz, is close to the shaft frequency of the pressure pump at 30 Hz and is the modulation frequency of the pressure signal at the particle concentration. Therefore, the difference between the second largest component mode3′s main frequency, 49.8047 Hz, and the fundamental frequency, is 39.0625 Hz, the sum of the fundamental frequency and the modulation frequency. The difference between the main frequency of Mode4 (74.2188 Hz) and the main frequency of mode6 (109.3750 Hz) is twice that of the difference between the fundamental frequency and the modulation frequency (17.5781 Hz). The frequency of 74.2188 Hz is subtracted from the twice difference of 17.5781 Hz between the fundamental frequency and the modulated frequency. The result is 39.0625 Hz of the sum of the fundamental frequency and the modulated frequency. It can be seen that between mode4, mode6, mode1, and mode2, the signal with a carrier frequency of 74.2188 Hz is modulated by frequency modulation twice as much as the difference between the fundamental frequency and the modulation frequency of 17.5781 Hz, and a signal of 109.3750 Hz appears. The difference between the fundamental frequency and the modulation frequency is 4 times of 17.5781 Hz minus 2 times of the fundamental frequency, which is the difference between the main frequency of mode5 and mode3, which is 48.8281 Hz. The difference between the main frequency of mode7 and mode3 is 2 times that of 48.8281 Hz. The main frequency of Mode19, 416.9922 Hz, is 7 times the difference between the main frequency of mode5, 98.6328, and 39.0625 Hz (the sum of the fundamental frequency and the modulation frequency).
Similarly, the pressure signal with a particle concentration of 0.971 ppm was decomposed into 13 components and 6 main components by the VMD. The error range between the center frequency and the mean instantaneous frequency is −0.24% ∼ 9.93%, the error range between the main frequency of each component and the corresponding center frequency is −13.95% ∼ 49.09%; it can be seen that under the condition that the main frequency of the component with the largest energy value is consistent with the center frequency of the decomposition of pressure signal by VMD at the particle concentration, the optimization iteration results of the center frequency of other main components are not ideal. However, the analysis of a component relationship is only for the main frequency of each component, and the influence of the error of other components on the results can be ignored.
The Mode5 component has the largest energy value, and its main frequency also plays a significant role in the pressure signal of the particle concentration. It can be seen that the main frequency of mode1, 8.7891 Hz, is the fundamental frequency of the oil pressure signal at the particle concentration, and the main frequency of other components is the frequency multiplication of the fundamental frequency respectively; These are the main frequencies of Mode2, mode5, mode7, mode11, and mode13 are 63.4766, 155.2734, 222.6563, 376.9531, and 479.4922 Hz, which are respectively 7, 18, 25, 43 and 55 times of the fundamental frequency. It can be seen that the principal frequency of mode2 and mode5 is equal to the principal frequency of mode7, the sum of the principal frequency of mode5 and mode7 is equal to the principal frequency of mode11, the sum of the main frequencies of mode1 and mode11 and the difference between the main frequencies of mode5 and mode2 is equal to the main frequency of mode13. It can be seen that the main frequency of mode2, 63.4766 Hz, and the main frequency of mode11, 376.9531 Hz appear after the main frequency of mode7, 222.6563 Hz modulated by the main frequency of mode5 155.2734 Hz.
The oil pressure signal with particle concentration of 3.00 Ppm was decomposed into 24 components by VMD, among which the main component was 11. The error range of the center frequency of each major component and it’s corresponding mean instantaneous frequency is −5.43% ∼–8.68%, and the error range of its corresponding component’s main frequency is −1.06% ∼ 7.18%. It can be seen that the error between the component center frequency of the pressure signal under the particle concentration and its corresponding component main frequency is small.
As can be seen from Table 3, the main frequency of the component mode2 is 32.2266 Hz, which is close to the shaft frequency of the oil pressure transmission pump (30 Hz). Therefore, this component corresponds to the fundamental frequency of the pressure signal. The main frequency of the component mode3, 56.6406 Hz is equal to the 2 times of fundamental frequency minus 7.8126 Hz. Similarly, 2 times of fundamental frequency plus 7.8126 Hz is about 73.2422 Hz of main frequency of the component mode4; Then, 56.6406 and 73.2422 Hz are the results of double fundamental frequency modulated by 7.8126 Hz. In the main component, the main frequency of mode18 is 387.6953 Hz, which is about 12 times the fundamental frequency of pressure signal; the main frequency of mode14, 286.1328 Hz, and the main frequency of mode24, 492.1875 Hz appears, after the main frequency of this component is modulated by the 105.4688 Hz, the sum of the main frequency of mode2, 32.2266 Hz and the main frequency of mode4, 73.2422 Hz; Then, the main frequency of mode15 (305.6641 Hz) with the largest energy value can be obtained, this is the difference between the main frequency of component mode18 (387.6953 Hz) and twice difference that the main frequency of mode2 (32.2266 Hz) and the main frequency of mode4 (73.2422 Hz); After the main frequency of component mode18 (387.6953 Hz) modulated by 3 times of the main frequency of component mode3 (56.6406 Hz), the main frequency of mode6 (135.7422 Hz) and the main frequency of mode23 (474.6094 Hz) can be obtained. The main frequency of Mode15, 305.6641 Hz minus the main frequency of mode3, 56.6406 Hz, to get the main frequency of mode12, 248.0469 Hz. The main frequency of mode6, 135.7422 Hz, and mode17, 359.3750 Hz appears after the main frequency of mode12 modulated by the twice main frequency of mode3, 56.6406 Hz.
The oil pressure signal with particle concentration of 4.57 ppm was decomposed by VMD to obtain 19 components, including 7 main components, the error range of the center frequency of each main component and the mean instantaneous frequency of its corresponding component is −13.18% ∼ 5.86%, and the error range of the main frequency of its corresponding component is −6.58% ∼ 25.69%, the error between the center frequency of the component with the largest energy value, mode18 and its corresponding component is −0.055%.
The main frequency 7.8125 Hz of the decomposed component mode1 of the pressure signal at the particle concentration is the fundamental frequency of the signal, and the main frequency 106.4453 Hz of the component mode4 is about 14 times of the fundamental frequency; the double frequency of 106.4453 Hz is the main frequency of mode8, 212.8906 Hz. The main frequency of mode8, 212.8906 Hz minus 21 times the fundamental frequency is the main frequency 49.8047 Hz of mode2, and 21 times the fundamental frequency is the main frequency 371.0938 Hz of mode14, and 35 times the fundamental frequency is the main frequency 481.4453 Hz of mode18, which is the component of the largest energy value. Similarly, the main frequency of mode14, 371.0938 Hz, plus 3 times the fundamental frequency, is the main frequency 393.5547 Hz of mode15.
The oil pressure signal with a particle concentration of 6.58 ppm was decomposed into 28 components and 12 main components by VMD. The error range of the center frequency of each main component and its corresponding mean instantaneous frequency is −8.91–4.95%, and the error range of its corresponding component’s main frequency is −11.19% to 25.42%. The main components of the signal have more main frequency components, but they are all frequency multiples of 6.8359 Hz of the main frequency of the component with the largest energy value. For example, the main frequencies of mode2, mode3, mode5, mode6, mode7, mode15, mode16, mode18, mode19, mode22, and mode24 are about 6, 10, 14, 16, 20, 40, 44, 47, 50, 59, and 64 times of the fundamental frequency 6.8359 Hz, respectively. The main frequency of the components mode16 and mode18 is about 10 and 11 times of 30 Hz of the rotating shaft frequency of the oil pressure transmission pump, respectively. In addition, the main frequency of mode15, 270.5078 Hz, is used as the carrier signal frequency, and the main frequencies of mode7 and mode22 are 137.6953 and 403.3203 Hz after modulated by 19 times the fundamental frequency.
The number of components of the oil pressure signal with a particle concentration of 14.40 ppm decomposed by VMD was 24, among which the main component was 14. The error range of the center frequency of each main component and its corresponding mean instantaneous frequency is −12.33% ∼ 4.29%, and the error range of its corresponding component’s main frequency is −29.16–1.75%. The main frequency 20.5078 Hz of mode1 is the fundamental frequency of the pressure signal, so the main frequencies of the components mode3, mode6, mode7, mode10, mode11, and mode14 are 3, 6, 7, 10, 11, and 14 times of the fundamental frequency respectively. Among them, 4 times of the fundamental frequency minus 4.8828 Hz is the main frequency of mode4, which is 77.1484Hz. Thirteen times the fundamental frequency plus 4.8828 Hz is the main frequency of mode13, 271.4844 Hz; and the main frequency of mode13, 271.4844 Hz plus 4 times of the fundamental frequency is the main frequency of mode17, 353.5156 Hz; and 7 times of the fundamental frequency is the main frequency of mode20, 414.0625 Hz. The main frequency of mode11, 227.5391 Hz, plus the rotating shaft frequency 30 Hz of the oil pressure transmission pump is the main frequency 256.8359 Hz of mode12; and the two times of rotating shaft frequency 30 Hz is the main frequency of mode14, 288.0859 Hz. The main frequency 256.8359 Hz of mode12 plus 9 times of the fundamental frequency is the main frequency 440.4297 Hz of mode21, and the main frequency of mode14, 288.0859 Hz plus 40 times of 4.8828 Hz is the main frequency 483.3984 Hz of mode23.
The number of components of the oil pressure signal with a particle concentration of 28.50 ppm decomposed by VMD was 14, and the main component number was 7. The error range of the center frequency of each main component and its corresponding mean instantaneous frequency is −2.42% ∼ 9.63%, and the error range of its corresponding component’s main frequency is −8.57% ∼ 1.07%.
As can be shown from Table 3, the main frequency of mode2, 39.0625 Hz can be decomposed into 8 times of 4.8828 Hz or 5 times of 7.8126 Hz, both of which are the fundamental frequency of pressure signal. The 10 times of the frequency 39.0625 Hz, is about the main frequency 393.5547 Hz of mode12, the component with the largest energy value. The 9 times of 30 Hz of the rotating shaft of the oil pressure transfer pump is about the main frequency 264.6484 Hz of mode8. Then, the main frequency of mode8, 264.6484 Hz, under the action of the frequency modulation signal frequency of 132 Hz, and the main frequency of mode5, 134.7656 Hz, and the main frequency of mode12, 393.5547 Hz appears. From the sum of the main frequency of mode5 and mode8 minus 2 times the fundamental frequency, to obtain the main frequency of mode10, 321.2891 Hz. The main frequency of mode10 was added to 3 fundamental frequencies to obtain the 2 times the main frequency of mode7 (218.7500 Hz). The main frequency of node14, 477.5391 Hz, is obtained by adding the main frequency of mode10 plus 4 fundamental frequencies.
It can be seen that the main frequency of the main component of the oil pressure signal with different particle concentrations after VMD decomposition is the fundamental frequency of its signal or the frequency multiplication combined with the rotating shaft frequency of the oil pressure transmission pump at 30 Hz, some components show frequency modulation relationship; The fundamental frequency of each pressure signal generally appears in the first component, and the other components are in a frequency-doubling relationship. For example, the components of the pressure signal containing 0.971, 4.57, and 6.58 ppm particle concentration are multiples of the fundamental frequency; in the pressure signal with particle concentration of 3.00, 14.40, and 28.50 ppm, the fundamental frequency is implied in the component. In the pressure signals with particle concentrations of 0.648, 3.00, 6.58, 14.40, and 28.50 ppm, come out the rotating shaft frequency of the oil pressure transmission pump, 30 Hz, and its frequency multiplication; With the increase of particle concentrations, the fundamental frequency of pressure signal decreases successively.
Figure 4 shows the time-frequency distribution diagram of each major component of the oil pressure signal with different particle concentrations after VMD decomposition.

The time-frequency diagram of different components of signals at different particle concentrations: (a) the time frequency distribution of component of 0.648 ppm, (b) the time frequency distribution of component of 0.971 ppm, (c) the time frequency distribution of component of 3.00 ppm, (d) the time frequency distribution of component of 4.57 ppm, (e) the time frequency distribution of component of 6.58 ppm, and (f) the time frequency distribution of component of 14.40 ppm, and (g) the time frequency distribution of component of 28.50 ppm.
It can be seen from Figure 4(a) that the time-frequency distribution of the eight main components of the oil pressure signal with particle concentration of 0.648 ppm after VMD decomposition presents different amplitudes at different times and different frequencies. Except for the mode19 component, the bandwidth of other components is larger, and there is a frequency aliasing phenomenon. As the fundamental frequency of the signal, mode1 has the maximum amplitude within the 137–271 ms time, and the two components of mode1 and mode2 have obvious connection lines between the two main frequencies within the 790–880 ms time, indicating that the two components are coupled to form the frequency doubling relation of the other components.
Figure 4(b) shows the time-frequency distribution of the six main components of the oil pressure signal with a particle concentration of 0.971 ppm after VMD decomposition. The amplitude of the mode5 component is the largest in the whole sampling time. The amplitude of mode1 was larger during the time of 44–251 ms. The frequencies of the decomposed six components are independent, and there is no confusion of frequency components, but their bandwidth is larger within the time of 265–850 ms.
Figure 4(c) shows the time-frequency distribution of the 11 main components of the oil pressure signal with a particle concentration of 3.00 ppm after VMD decomposition; it can be seen that the components of mode12, mode15, and mode18 are distributed symmetrically on both sides, indicating that these components are the result of frequency modulation. There is a confusion of frequency between the fundamental frequency of the pressure signal and the frequency components near the mode15 component with the largest energy value.
Figure 4(d) shows the time-frequency distribution of the seven main components of the oil pressure signal with a particle concentration of 4.57 ppm after VMD decomposition. The components with large amplitude in the whole sampling time are mode1 fundamental frequency, and mode14, mode15, and mode18 components. It can be seen that the bandwidth of each major component is larger in the whole sampling time, and there is frequency component confusion.
Seen in Figure 4(e) is the time-frequency distribution of 12 main component of VMD decomposition of oil pressure signal with particle concentrations of 6.58 ppm; it can be seen that the amplitude of mode1 component is the larger, and the main frequency of mode1 component is the fundamental frequency of the signal in the whole sampling time, the rest of the major components is fundamental frequency doubling, they are relatively independent, and the distribution of the bandwidth is small, there is the frequency aliasing phenomenon in some period.
Figure 4(f) shows the time-frequency distribution of the 14 main components of the oil pressure signal with a particle concentration of 14.40 ppm decomposed by the VMD. The frequency component aliasing phenomenon exists in the range of 291–498 ms of the sampling time of mode1, indicating that the mode1 component contains multiple frequency components; the other components are the frequency-doubling relation of the fundamental frequency. Except for the components of mode10–14, their distribution is relatively independent, and their bandwidth is small.
In Figure 4(g), it can be seen that the oil pressure signal with a particle concentration of 28.50 ppm has a time-frequency distribution of seven main components after VMD decomposition, and mode12 is the fundamental frequency of the signal, its amplitude is larger distributed in the whole sampling time, and the major components are relatively independent, there is no confusion of frequency components, but their bandwidth is large.
It can be seen from the time-frequency diagram of the main components that the amplitude distribution of each component is obvious in the sampling time. However, the bandwidth of each component is still large, so the envelope demodulation analysis is carried out on them.
Envelope demodulation distribution of the maximum component of each pressure signal
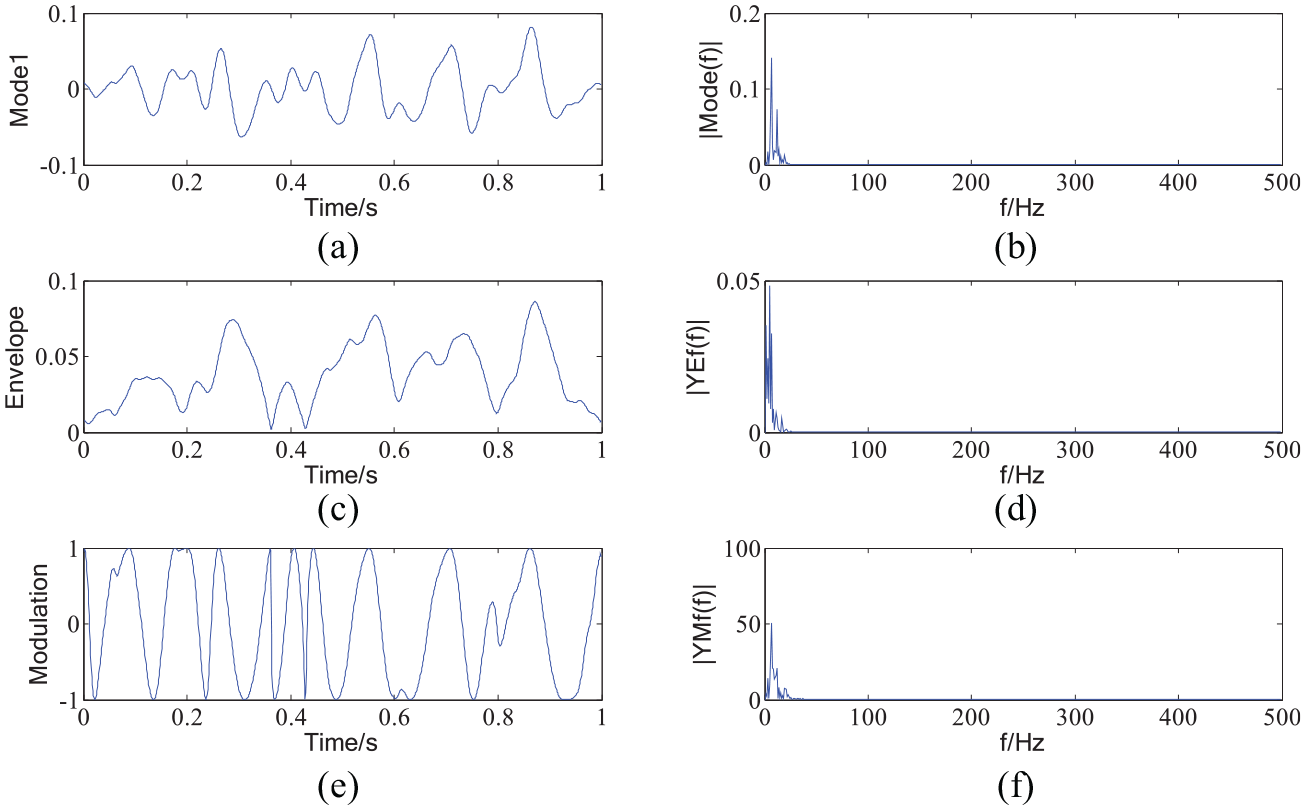
Figures 5 to 11 shows the envelope demodulation distribution diagram of the maximum component of each pressure signal with different particle concentrations after VMD decomposition. It can be seen from Figure 5 that the time-domain distribution of mode1 (Figure 5(a)) shows the characteristics of amplitude modulation; its spectrum (Figure 5(b)) has a main frequency of 10.74 Hz, and two secondary peaks on both sides of the main frequency correspond to frequencies of 4.88 and 15.63 Hz. The difference between them and the main frequency is 5.86 and 4.89 Hz respectively. According to the envelope spectrum of mode1 in Figure 5(d), 4.89 Hz is the main envelope frequency of the signal. The spectrum of the carrier signal after envelope demodulation (Figure 5(f)) shows that there is the main frequency of 10.74 Hz consistent with that of mode1, there are two secondary peaks on both sides of the spectrum corresponding to frequencies of 4.88and 16.60 Hz, respectively, and the difference between them and the main frequency is 5.86 Hz. As shown in Figure 5(e), the carrier signal is a frequency modulation signal with a frequency of 5.86 Hz. Consistent with Figure 4(a), the frequency distribution of mode1 has a large bandwidth, including the amplitude modulation frequency of 4.89 Hz and the frequency modulation frequency of 5.86 Hz.

The envelope demodulation of the maximum component of 0.648 ppm: (a) Model 1 Signal, (b) The frequency spectrum of mode1, (c) The envelope spectrum of mode1, (d) The envelope frequency spectrum of mode1, (e) The frequency modulated signal of mode1, (f) The frequency spectrum of the modulated signal of mode1.

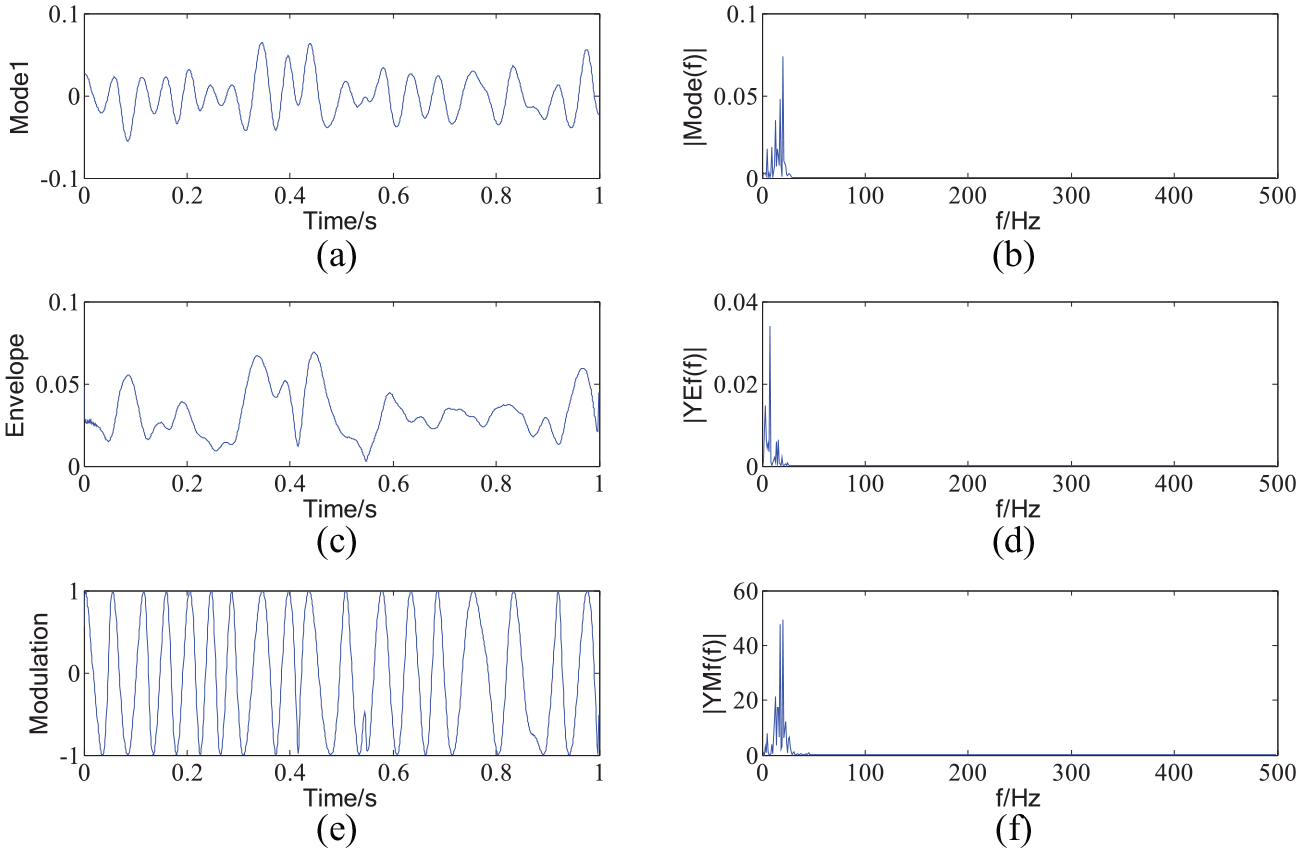
The envelope demodulation of the maximum component of 0.971 ppm: (a) Mode5 signal, (b) The frequency spectrum of mode5, (c), (d) The envelope frequency spectrum of mode5, (e) The frequency modulated signal of mode5, (f) The frequency spectrum of the modulated signal of mode5.

The envelope demodulation of the maximum component of 3.00 ppm: (a) Mode15 signal, (b) The frequency spectrum of mode15, (c) The envelope spectrum of mode15, (d) The envelope frequency spectrum of mode15, (e) The frequency modulated signal of mode15, (f) The frequency spectrum of the modulated signal of mode15.

The envelope demodulation of the maximum component of 4.57 ppm: (a) Mode18 signal, (b) The frequency spectrum of mode18, (c) The envelope spectrum of mode18, (d) The envelope frequency spectrum of mode18, (e) The frequency modulated signal of mode18, (f) The frequency spectrum of the modulated signal of mode18.
The envelope demodulation of the maximum component of 6.58 ppm: (a) Mode1 signal, (b) The frequency spectrum of mode1, (c) The envelope spectrum of mode1, (d) The envelope frequency spectrum of mode1, (e) The frequency modulated signal of mode1, (f) The frequency spectrum of the modulated signal of mode1.
The envelope demodulation of the maximum component of 14.40 ppm: (a) Mode1 signal, (b) The frequency spectrum of mode1, (c) The envelope spectrum of mode1, (d) The envelope frequency spectrum of mode1, (e) The frequency modulated signal of mode1, (f) The frequency spectrum of the modulated signal of mode1.
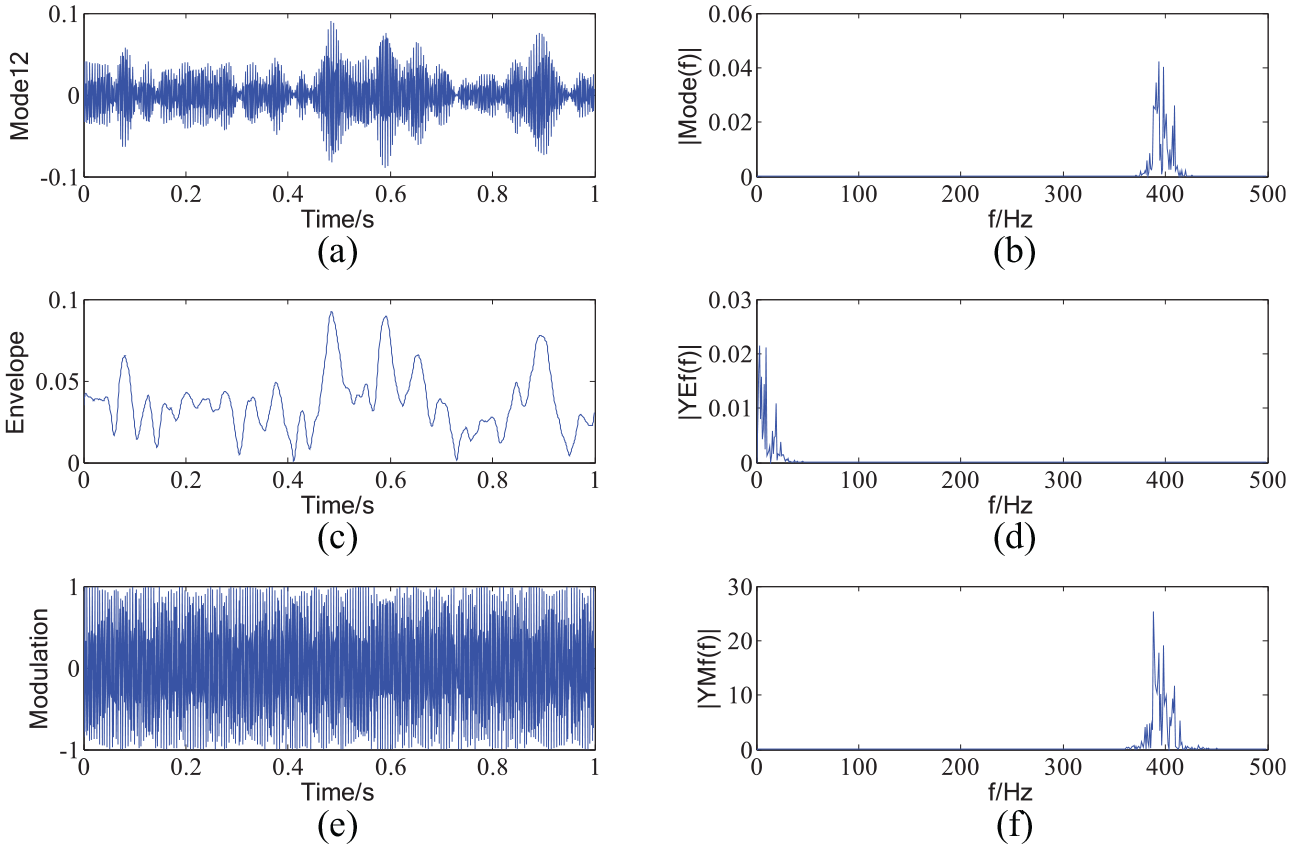
The envelope demodulation of the maximum component of 28.50 ppm: (a) Mode12 signal, (b) The frequency spectrum of mode12, (c) The envelope spectrum of mode12, (d) The envelope frequency spectrum of mode12, (e) The frequency modulated signal of mode12, (f) The frequency spectrum of the modulated signal of mode12.
Figure 6 shows the envelope demodulation distribution of mode5, the maximum energy component of the oil pressure signal with particle concentration of 0.971 ppm after VMD decomposition, the mode5 has the beat vibration characteristics (Figure 6(a)), the envelope frequencies after Hilbert envelope demodulation were 2.93, 5.86, and 12.7 Hz (Figure 6(d)); in Figure 6(b) and (f), it can be seen that the main frequency of mode5 and its carrier spectrum is 155.3Hz, there are multiple side frequencies distributed on both sides of it, the amplitude of frequency in the 132.6–168 Hz band is large, this is determined by the characteristics of the beat vibration. The sum of 2.93 and 5.86 Hz, two frequencies with large spectrum amplitude of envelope signal, constitutes the amplitude modulation frequency of 8.79 Hz, namely, the sum of two cosine signals whose main frequency of mode5 is 146.5 and 164.1 Hz respectively, the result is the product of the cosine of half of the difference of the primary frequency and the sinusoidal of half of the sum of the primary frequency, to obtain the main frequency of mode5, 155.3 Hz (= (146.5 + 164.1)/2 Hz) and the main envelope frequency, 8.79 Hz (= (164.1 − 146.1)/2 Hz).
Figure 7 shows the envelope demodulation distribution of mode15, the component of the largest energy value of the oil pressure signal with a particle concentration of 3.00 ppm, decomposed by the VMD. As shown in Figure 7(b), the main frequency of the spectrum of mode15 is 305.7 Hz, with two peaks of 297.9 and 313.5 Hz distributed on both sides. The frequency of the envelope signal is 0.9766, 6.836, and 13.67 Hz with large amplitude. It can be seen that the mode15 signal is the result of 7.812 Hz modulation of the sum of the first two frequencies with a large amplitude of the envelope signal. According to the spectrum of the carrier signal in Figure 7(f), there is a frequency component of 319.3 Hz on the side of the main frequency of 305.7 Hz, and the difference between the frequency and the main frequency is 13.6 Hz, which is in the spectrum of the envelope signal.
Figure 8 shows the envelope demodulation distribution of mode18, the component of the largest energy value of the oil pressure signal with a particle concentration of 4.57 ppm, decomposed by the VMD. It can be seen that in Figure 8(b), 472.7, 475.6, 489.4, 497.1 Hz frequency values with large amplitude are distributed on both sides of the main frequency of 481.4 Hz, with the intervals of 2.9, 5.8, 7.9, and 7.8 Hz. As shown in Figure 6(d), these are the main frequencies of the envelope spectrum, 2.93, 5.859, and 15.63 Hz (approximately equal to the sum of 7.9 and 7.8 Hz). In addition, as shown in Figure 6(f), the main frequency of the carrier signal is 478.5, and its side frequency is 472.7, 475.6, 481.4, 481.4, 491.2, and 497.1 Hz, their intervals are 2.9, 2.9, 2.9, 2.9, 4, 5.8, and 5.9 Hz. It can be known that the carrier signal is the result of the coupling between 475.6 Hz modulated by 2.9 Hz frequency modulation signal and 491.2 Hz modulated by 5.8 Hz amplitude modulation signal.
Figure 9 shows the envelope demodulation distribution of mode1, the component of the largest energy value of the oil pressure signal with a particle concentration of 6.58 ppm after VMD decomposition. In Figure 9(b), the spectrum of mode1 has four amplitudes, and the corresponding frequencies are 2.93, 6.836, 11.72, and 19.53 Hz, among which 6.836 Hz is the main frequency. The difference between 11.72 Hz and the main frequency is 4.88Hz, which is the main frequency 4.883 Hz of the envelope signal (Figure 7(d)). As shown in Figure 9(e), the carrier signal after envelope demodulation is a frequency modulation signal. As shown in Figure 9(f), the spectrum peak value of the carrier signal is 15.63 Hz, more than that in Figure 9(b). Then, the difference between 6.836 Hz and 2.93 Hz, 15.63 Hz and 11.72 Hz, 15.63 Hz and 19.53 Hz is 3.9 Hz, which is the frequency of the frequency modulation signal of the carrier signal.
Figure 10 shows the envelope demodulation distribution of mode1, the component of the largest energy value of the oil pressure signal with a particle concentration of 14.40 ppm after VMD decomposition. According to Figure 10(b), the main frequency of mode1 is 20.51 Hz, and 4.883 Hz, 9.766 Hz, 12.7 Hz, and 17.58 Hz are distributed on the side less than the main frequency, the difference between the main frequency 20.51 Hz and 12.7 Hz, 12.7 Hz and 4.883 Hz is 7.81 Hz, the sum of 4.883 Hz and 2.93 Hz, which is the main frequency of the envelope signal 7.813 Hz (Figure 10(d)). As shown in Figure 10(d), the frequency of the envelope signal also has a peak value of 2.93 Hz, and the frequency value of 4.883 Hz can be obtained by subtracting these two amplitudes. It can be seen from Figure 10(e) that the carrier signal after envelope demodulation presents frequency modulation characteristics. The frequency value of 25.39 Hz is one more than that of Figure 10(b) in the spectrum of the carrier signal in Figure 10(f), and the difference between it and the main frequency of 20.51 Hz is 4.88 Hz, so the frequency of the frequency modulation signal of the carrier signal is 4.88 Hz.
Figure 11 is the envelope demodulation distribution of mode12, the component of the largest energy value of the oil pressure signal with a particle concentration of 28.50 ppm after VMD decomposition, Figure 11(a) shows that the signal of mode12 is an amplitude modulation signal, the main frequency of a signal is 393.6 Hz in Figure 11(b), the side frequency of they both sides is 388.7, 398.4, and 409.2 Hz, the difference between them in order of 4.9, 4.8, and 10.8 Hz; According to the spectrum of the carrier signal after envelope demodulation in Figure 11(f), 388.7 Hz is the main frequency of the carrier signal, that is, the difference between the amplitude modulated signal and the carrier signal is 4.9 Hz. According to the characteristics of amplitude modulation, 4.9 Hz is the frequency of the amplitude modulated signal. As can be seen from the spectrum of envelope signal in Figure 11(d), the frequency peaks 2.93 Hz and 9.766 Hz, and 9.766 Hz is the double frequency of 4.883 Hz. Then the main frequency of the carrier signal plus 9.7 Hz is its side frequency 398.4 Hz. It can be seen from Figure 11(e) that the carrier signal still has the characteristics of small amplitude modulation, which is also the reason that 9.766 Hz appears in the envelope signal.
It can be seen that the oil pressure signals with different particle concentrations have undergone the Hilbert envelope demodulation analysis of the components with the maximum energy value decomposed by VMD, indicating that these components all have the characteristics of amplitude modulation and frequency modulation of different degrees. The corresponding amplitude modulation and frequency modulation values are presented in the envelope signals. In addition to the particle concentration of 0.648and 6.58 ppm, the main frequency of the maximum energy component of the oil pressure signal is the fundamental frequency of the signal, the fundamental frequency of the rest of the signal is the difference in frequency of the envelope demodulation signal of the corresponding component; namely the fundamental frequency of mode5 the pressure signal with particle concentration of 0.971 ppm is 8.79 Hz (= (164.1 − 146.1)/2 Hz), the fundamental frequency of mode15 the pressure signal of particle concentration 3.00 ppm is 7.8 Hz (= (313.5 − 297.9)/2 Hz), the fundamental frequency of mode18 the pressure signal with particle concentration of 4.57 ppm is 7.85Hz(=(497.1 − 481.4)/2 Hz), the fundamental frequency of mode1 the pressure signal with particle concentration of 14.40 ppm is 4.88 Hz (= (20.51 − 4.883)/4 Hz), and the fundamental frequency mode12 the pressure signal with particle concentration of 28.50 ppm is 4.85 Hz (= (398.4 − 388.7)/2 Hz). The main frequencies of the components with the maximum energy values of the particle concentration of 0.971, 3.00, 4.57, and 28.50 ppm are 5, 10, 16, and 13 times of the rotary shaft frequency of the oil pressure transmission pump at 30 Hz, respectively.
It can be seen that the above research conclusions can be applied to a large number of fields that are sensitive to oil pollution, such as the landing gear of aerospace aircraft and precision oil presses shown in Figure 12.

The application of the proposed research: (a) the landing gear of aircraft and (b) the precision oil presses.
By collecting the pressure signal of the oil in these mechanisms, the VMD analysis obtains the number of Mode decomposition of the signal, and the general trend of the degree of oil pollution can be obtained according to the number of decomposition. Then the average energy value is used to obtain the main component of the signal, and the maximum component of the energy value of the pressure signal is carried out Hilbert envelope demodulation analysis, according to the signal amplitude modulation, frequency modulation characteristics, the concentration of particulate matter in the oil can be obtained, providing real-time and quantitative monitoring of the oil pollution status of these mechanisms, providing a solid theoretical support for the safe operation of the mechanism.
Conclusions
It is very important to monitor the movement state of oil in a mechanical hydraulic system, especially the oil of a hydraulic system will inevitably intrude from the outside or generate some particle pollutants in the process of operation. The Variational Mode Decomposition (VMD) method was used to decompose the oil pressure signals containing different particle concentrations; the number of components of VMD decomposition is determined by using the criterion of joint comparison between the slope of the center frequency of each component and the main frequency of the component of VMD decomposition, and a method for determining the main components of the signal is proposed by the average energy value; the Hilbert envelope demodulation analysis was carried out for the maximum energy component of each pressure signal. These are found as follows.
The number of components of VMD decomposition is determined according to the criterion of joint comparison between the slope of the center frequency of each component and the main frequency of the component of VMD decomposition, and the main component of the signal is composed of the energy of components larger than the mean value of the energy.
VMD decomposition was carried out for pulsating flow pressure signals of oil with particle concentrations of 0.648, 0.971, 3.00, 4.57, 6.58, 14.40, and 28.50 ppm, respectively. The combined criterion of central frequency slope and main frequency was used to determine the number of components of VMD decomposition, to obtain the number of mode components of oil pulsating flow pressure signals with different particle concentrations; The larger the particle concentration in the oil, the larger the number of main components obtained by VMD decomposition; The proportion of main components in the unit concentration of pressure signals of different particle concentrations tends to decrease monotonously with the increase of particle concentration.
The main frequency of the main component of the oil pressure signal with different particle concentrations after VMD decomposition is the base frequency of its signal or the frequency multiplication combined with the rotating shaft frequency of the oil pressure transmission pump at 30 Hz, and some components show frequency modulation relationship. The fundamental frequency of each pressure signal generally appears in the first component, and the other components are in a frequency-doubling relationship; in the pressure signal with particle concentration of 3.00, 14.40, and 28.50 ppm, the fundamental frequency is implied in the component; In the pressure signals with particle concentration of 0.648, 3.00, 6.58, 14.40, and 28.50 ppm, appear the rotating shaft frequency 30 Hz and its frequency doubling of the oil pressure transmission pump; With the increase of particle concentration, the fundamental frequency of pressure signal decreases successively.
The Hilbert envelope demodulation analysis of the oil pressure signals with different particle concentrations after the VMD decomposition of the components with the maximum energy value indicated that these components all have amplitude modulation and frequency modulation characteristics of different degrees, and the corresponding amplitude modulation and frequency modulation values are presented in the envelope signals; Except for the particle concentration of 0.648 and 6.58 ppm, the main frequency of the maximum energy component of the oil pressure signal is the fundamental frequency of the signal, the fundamental frequency of the rest of signal is the difference of the frequency of the envelope demodulation signal of the corresponding component. The main frequencies of the components with the maximum energy values of the particle concentration of 0.971, 3.00, 4.57, and 28.50 ppm are 5, 10, 16, and 13 times of the rotary shaft frequency of the oil pressure transmission pump at 30 Hz, respectively.
According to the above research conclusions, in the future, we intend to construct the internal relationship between the concentration of different particles in the oil and the pressure signal, to use the frequency component of the main component of the VMD decomposition of the pressure signal as the monitoring amount, and monitor the particle pollution state of the oil in real time, so as to ensure the safe operation of the equipment.
Footnotes
Handling Editor: Chenhui Liang
Contributions
Liu Ge performed the experiments, analyzed the data, and interpreted the results. Chen Bin contributed in developing the proposed method. All authors wrote, read, and approved the final manuscript.
Declaration of conflicting interests
The author(s) declared no potential conflicts of interest with respect to the research, authorship, and/or publication of this article.
Funding
The author(s) disclosed receipt of the following financial support for the research, authorship, and/or publication of this article: This study was funded by Local science and technology development fund projects guided by the central government (206Z5201G), Chongqing Basic Research and Frontier Exploration Project (cstc2018jcyjAX0121), Fundamental Research Funds for the Central Universities (3142019001, 3142019055).
Data available
Data available on request from the authors.