
Abstract
Tidal bores are natural phenomena resulting from the nonlinear distortion of tidal waves and propagate upstream with the incoming tide. The Qiantang River tidal bore is world-famous for its great momentum which can occasionally inflict major damage to infrastructures in the Qiantang River Estuary, China. Existing design guidelines are not fit for accurately estimating the tidal bore loads on elevated structures. This study investigated the impact of tidal bores on the trestle piers of a river-crossing bridge using field tests. Based on the measured data, empirical formulas for the maximum impact pressure in four zones across the trestle were derived, and the influence of the Froude number on the peak pressure was determined. Results show that the peak pressure of the instantaneous impulsive state of the bore can exceed the pressure of the quasi-steady state 10-fold. The maximum dynamic impact pressure on the seaward side of the pier occurs at the base of the bore. The peak dynamic pressure accounts for 54%, 45%, and 20% of the total pressure for Froude numbers of 1.26, 1.12, and 1.04, respectively. The results of this study can serve as valuable references for the load design of structures against tidal bores and tsunami-like waves.
Introduction
A tidal bore is a series of waves that propagates upstream of the incoming tide. 1 When the leading front of the tidal bore hits protruding banks, groins, and other water-related infrastructures, it will grow as high as a tsunami. As such, a breaking tidal bore is sometimes misrepresented as a destructive tsunami in the news media. In 2004, Calgary Herald mistook the Qiantang River tidal bore (QRTB) for a tsunami. 2 The tidal bore is a complex multiscale and multiprocess unsteady flow with strong discontinuity, violent disturbance, and with simultaneous hydrodynamic dissipation and dispersion. The propagation of tidal bores is accompanied by intense momentum and energy conversion. The turbulence and mixing of estuarine water caused by tidal bores significantly impact sediment transport, sedimentation processes, and the ecological environment. 3 When blocked by obstacles, the tidal bore exerts considerable impact on the seaward front of the structures. Field observation results of the QRTB indicate that its maximum velocity is generally 6–8 m/s, with a measured peak velocity of 12 m/s. 4 Damage to marine structures and casualties caused by tidal bores occur frequently.5,6 Therefore, determining the impact loads caused by tidal bores on marine structures such as piers, jetties, and other buildings built along the estuary, is critical.
The loads imposed by surface waves or ocean currents on marine structures have been investigated.7–12 However, studies on the impact of tidal bores on bridges are limited. The tidal bore can be divided into undular and breaking bores. 13 The undular bore is a wave train that advances upstream of the estuary. When the intensity of the tidal bore is high, the surface breaks and then develops into a water roll that moves upstream. Therefore, the tidal bore has the characteristics of a kinematic wave and the tidal bore is reflected when constricted. However, the tidal bore also has the features of unidirectional flow during the flood tide phase; therefore, traditional wave theory cannot be used to analyze its impact force. Chanson 14 investigated the effect of bridge piers on tidal bore propagation and characteristics using flume tests. The results demonstrated that the typical constriction by bridge piers has a significant effect on the free-surface properties of a tidal bore, including its mixing characteristics.14,15 Shao et al. 16 measured the tidal bore-induced pressures at the sixth Qiantang River Bridge pier and used the shallow-water long-wave theory and standing wave theory formula to calculate the tidal bore pressure. Chen et al. 17 adopted a calculation method similar to that of the breaking wave impact pile and divided the tidal bore pressure into the sum of the impact force, Morison wave force, and hydrostatic pressure difference between the upstream and downstream surfaces of a square pile. Zhang et al. 18 investigated the surface pressure and force of piles under a tidal bore using flume tests and numerical simulations.
A tidal bore going inland is analogous to a tsunami propagating upstream in rivers.6,19 Tsunami impacts are considered in coastal structure design guidelines 20 such as the Japanese guidance, 21 City and County of Honolulu Building Code, 22 ] American Society of Civil Engineers guidance, 23 and Federal Emergency Management Agency guidelines. 24 Numerous laboratory experiments and numerical simulations have quantitatively studied the pressure distribution and force of tsunami flows on structures.25–28 Researchers at the Hinsdale Wave Research Laboratory (HWRL) at Oregon State University conducted extensive large-scale physical model experiments on elevated structures subjected to storm waves, surges, and tsunami-like waves.26,29–31 Kihara et al.32–34 conducted a series of physical model experiments at the Central Research Institute of the Electric Power Industry (CRIEPI, Japan) using a large wave flume to produce tsunami inundations and studied their impacts on complex topographies and buildings. Numerical models are primarily based on solving the complete Navier–Stokes equations. Douglas and Nistor 35 developed a multiphase three-dimensional numerical model within the framework of OpenFOAM to study tsunami-like bores propagating under different bed conditions and their interactions with surface-piercing structures. Using the same model, Asadollahi et al.36,37 calculated the hydrodynamic forces and associated drag coefficients for tsunami-induced bore interactions with the structures. Xie and Chu 38 conducted numerical simulations to determine the impact of tsunami wave forces on elevated coastal structures.
However, there are essential differences between tidal bores and tsunamis in terms of the generating mechanisms. Geological activities leading to tsunamis are unpredictable. 39 Field observation data on tsunami propagation and interaction with structures are scarce. 40 The tide is a periodic fluctuation phenomenon caused by the gravitational pull of the moon, the sun, and other celestial bodies on the ocean surface, and the tidal bore is at the front of the tidal wave.41,42 Therefore, the occurrence of tidal bores is predictable to a certain extent. 43 The interaction between the tidal bore and the structures can be observed by installing well-spaced sensing equipment. To date, following a review of the relevant literature, there is still an incomplete understanding of the vertical distribution of tidal bore-induced pressure on elevated structures built across rivers with tidal bores. This research fills this gap by on-site observation of the impact of tidal bores on a construction trestle pier in the Qiantang River, China. Through continuous observation using a multi-sensor system over several tidal cycles, the effect of the Froude number on the impact pressure of the tidal bore was investigated. The rest of the paper is structured as follows. Section “Materials and methods” introduces the field experiment adopted in this work. In Section “Results” the characteristics of the tidal bore profiles and impact pressures are presented based on field observations. Analyses of the results are discussed in Section “Discussion,” and concluding remarks are provided in Section 5.
Materials and methods
Study site
The Qiantang River Estuary is a tide-dominated and well-mixed estuary in China 44 with a celebrated tidal bore. 45 The tide in the Qiantang River Estuary is an anomalistic semidiurnal tide due to its funnel-like shape and shallow depth, and is mainly controlled by the M2 tidal constituent. 46 As shown in Figure 1, the QRTB forms near Ganpu, and propagates upstream beyond Wufeng. The total length of the QRTB segment is approximately 130 km. The normal height of the QRTB is 1–2 m, and the maximum height is greater than 3 m. When the fronts hit a protruding bank or spur dike, the rushing water rebounds over the crest of the structure to form a mushroom-shaped ridge that can be over 10 m in height. 47

Study area: (a) location of the Jiaxing-Shaoxing bridge (JSB) and (b) test site bathymetry.
The Jiaxing-Shaoxing Bridge (JSB) is the longest and widest multi-pylon cable-stayed bridge worldwide, with a length of 10.14 km. 48 The main channel swings frequently owing to wide and shallow channels, strong tides, rapid currents, and large sediment concentrations. The main navigation channel bridge of the JSB is a 70 + 200 + 5 × 428 + 200 + 70 m, 49 six-pylon, single column, four-cable plane, and steel box girder cable-stayed bridge. Steel trestles were used to construct the bridge sections.
The bridge is located in a channel segment with the largest tidal bore in the Qiantang River, with a maximum tidal bore height of more than 3 m, tidal bore celerity of more than 9 m/s, and maximum flood tide velocity of more than 6.5 m/s. 48 The maximum vertical suspended sediment concentration can reach 10 kg/m3 in the flood tide; the riverbed comprises fine silts with a diameter of 0.02–0.04 mm; the average settling velocity is 0.14 cm/s, and the incipient velocity is 0.68 m/s, which tends to scour and settle. 50
Field measurement instrumentation
The test was conducted during spring tide in autumn, from September 12 to October 4, 2011. As shown in Figure 2, the multi-sensor system was installed on a vertical measurement support which was welded to the pier of the JSB construction trestle. The pressure sensor is a miniature pressure sensor with a probe diameter of 2 cm, a measurement range of −100 kPa to 1 MPa, and a sampling frequency of 1 kHz. The tide level gauge is a pressure-type gauge, with a measurement resolution of 1 mm and a sampling frequency of 50 Hz. The installation layout of the pressure transducers (P1 to P9) and tide level gauges (G1) is shown in Figure 2(a).

Multi-sensor system installation: (a) layout of the pressure transducers (P1 to P9) and tide level gauge (G1) on a vertical plate support structure and (b) construction trestle (inset: steel face plate with a pressure transducer).
As shown in Figure 2(b), to ensure that the pressure sensors were not affected by the flow around the boundary, all sensors were placed at the center of a 300 mm × 300 mm × 15 mm steel plate; the distance from the sensor center to the edge of the steel plate was more than five times the sensor diameter. All the sensors were calibrated by a static pressure test before installation. Videos were taken at 30 frames/s to record the process of tidal bore propagation. Figure 3 shows representative screengrabs from the video footage. Local scouring around the trestle pier increased the water depth, and the tidal bore shape near the trestle was altered.

Image frames taken from video: (a) t = 0.0 s, (b) t = 0.5 s, (c) t = 1.0 s (inset: impact moment), and (d) t = 1.5 s.
Tidal bore description
Figure 4 shows a tidal bore propagating upstream with celerity C and a water surface profile η. The cross-sectional average flow velocity and water depth are V and d, respectively; subscripts 1 and 2 refer to the flow conditions in Sections “Introduction” and “Materials and methods,” respectively. The maximum slope on the front face of the tidal bore is
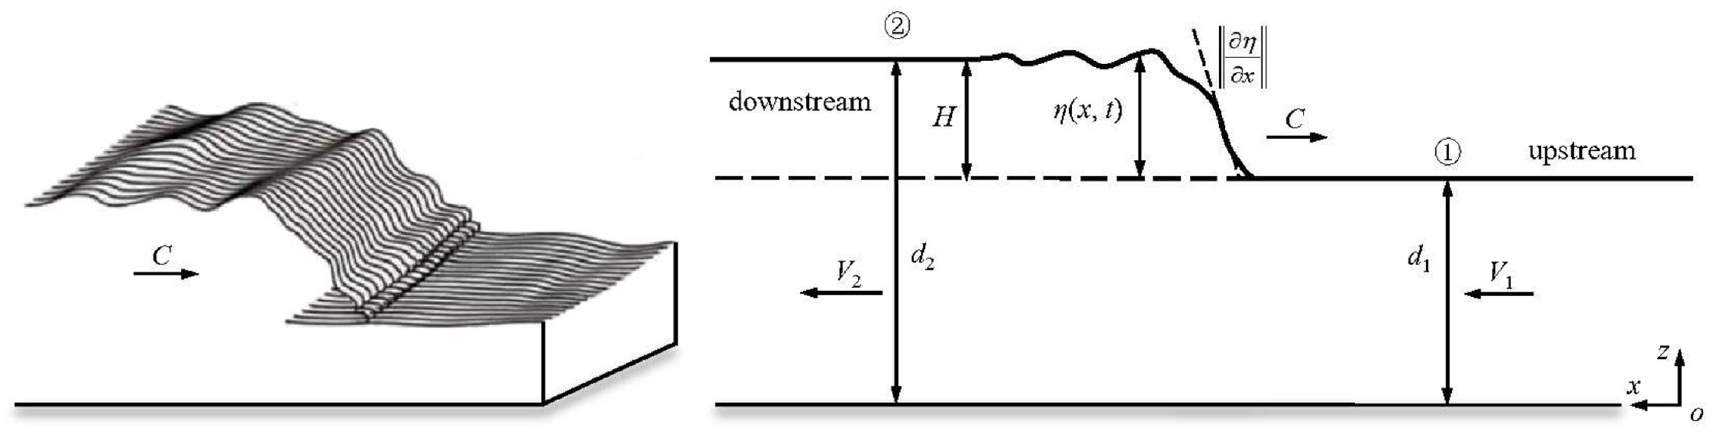
Schematic of a tidal bore propagating upstream.
The shape of the tidal bore profile is related to the Froude number (Fr). Fr was calculated using the following formula 3 :

where g is the gravitational acceleration. For Fr between 1 and 1.3, the bore has an undular profile; for larger Fr, the bore has a breaking front with an air entrainment roller. 1
According previously published data for the bridge site section, the highest tide level for the bridge site was 5.45 m (National Vertical Datum 1985, similarly hereinafter), and the average high tide level was 4.02 m; the lowest tide level was −3.15 m, and the average low tide level was −2.41 m; the maximum tidal range was 8.59 m, and the average tidal range was 6.44 m. 50 The maximum recorded flood flow velocity in the measurement site was 6.65 m/s, and the average maximum flood flow velocity in vertical was 5.37 m/s; the maximum ebb tide velocity at the measurement site was 4.40 m/s, and the average maximum ebb tide velocity in vertical was 3.70 m/s. The duration of the ebb current is significantly longer than that of the flood current. The duration of the ebb current was between 7.5 and 8.5 h, and the duration of the flood current was only between 3.5 and 4.5 h. 48
In this study, the water depth before the tidal bore arrived at the observation point was 4.4 to 5.0 m, the tidal bore height was 0.8 to 1.7 m, and the propagation celerity was 6.5 to 7.0 m/s. The propagation direction of the tidal bore is related to the riverbed condition, upstream discharge, and strength of the tide in the open sea. During the experimental period, the propagation direction of the tidal bore was oblique to the central axis of the trestle, and the included clockwise angle in the northern direction was 205°–265°.
Results
Tidal bore profiles
Typical tidal bore profiles and rising rates with different Froude numbers are shown in Figure 5. When the tidal bore arrives, the tide changes from an ebb stage to a flood stage and the tidal level rises rapidly within seconds. The tidal bore heights for Fr = 1.26, 1.12, and 1.04 are 1.57, 1.17, and 0.9 m, respectively; the corresponding maximum rising rates are 0.77, 0.51, and 0.11 m/s, respectively. Field observations indicate that the water-level rise rate increases with increasing Fr, and the rise rates ranged from 0.1 to 1.0 m/s.

Tidal bore profiles (η) showing the variation in rising rate (dη/dt) with different Froude numbers (Fr): (a) Fr = 1.26, (b) Fr = 1.12, and (c) Fr = 1.04.
As shown in Figure 1(b), due to the local scouring of the trestle pier, the water depth around the measurement site increased significantly. The undular bore was dominant near the pier. The tide-bore surface is sometimes partially broken, as shown in Figure 5(a). After the tidal bore, the water surface exhibited high-frequency oscillations; the greater the Froude number, the shorter the oscillation duration. The duration of the surface oscillation caused by the non-broken undular bore was relatively long (Figure 5(c)).
Tidal bore-induced pressures
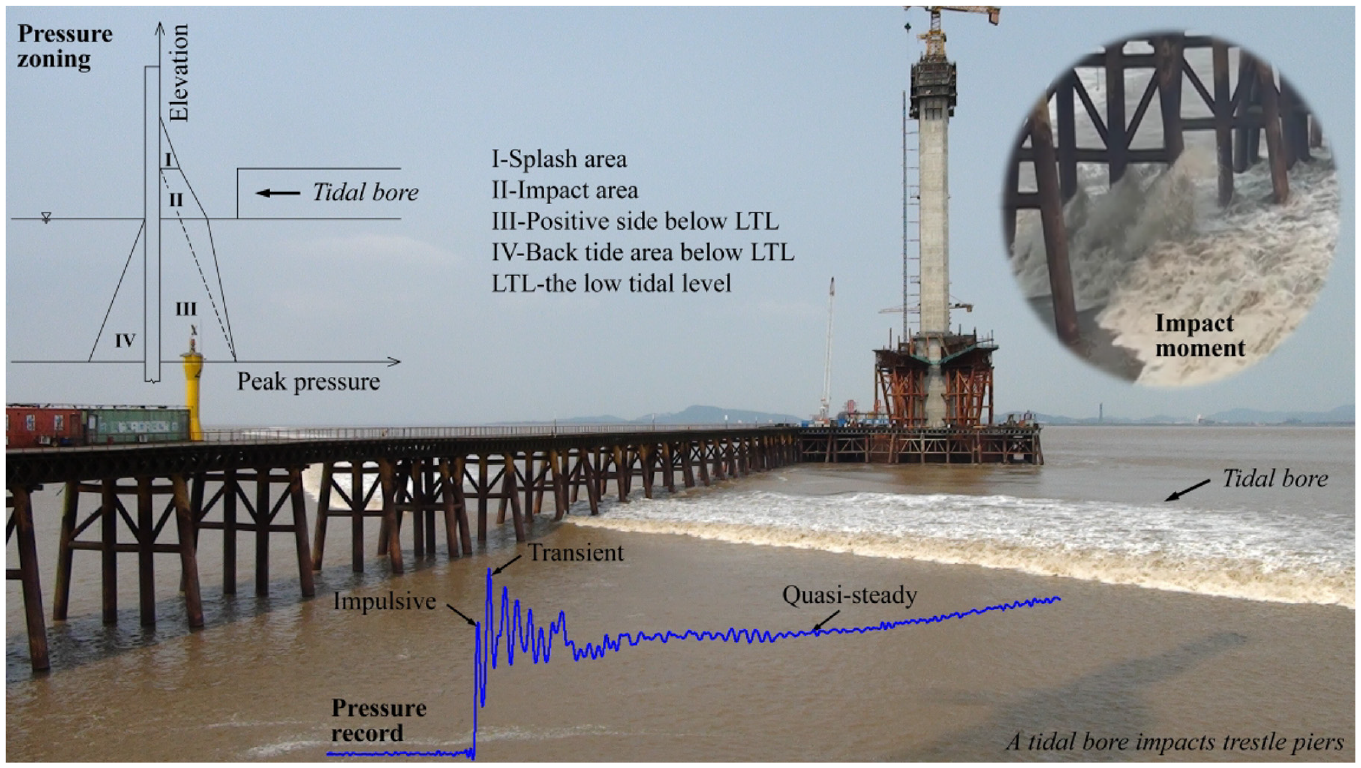
Similar to a tsunami, 36 the impact process in the direction of water flow caused by the force of the tidal bore acting on the structure can be divided into three stages, which are related to the inundation characteristics caused by the tidal bore. Figure 6(a) shows the impact pressure trace on the trestle pier from a tidal bore. An impulsive force was generated when the tide bore contacted the structure (marked as 1 in Figure 6(a)). This is mainly the impact force resulting from the rapid change in momentum caused by the variation in the added mass of the pier when the front of the tidal bore passes through. The impulsive effect is enhanced when the surface of the tidal bore breaks and carries bubbles. When the bore is reflected after the initial impact collapses backward and merges with the subsequent incident whelps of the tidal bore, it enters the transition stage (marked as 2 in Figure 6(a)). The tidal bore impact pressure generally increases with the relative width B/H of the interaction surface (B is the width of the interaction surface and H is the height of the tidal bore) and the impact pressure peaks in this stage. Then, it enters the quasi-steady stage (marked as 3 in Figure 6(a)) owing to the gradual increase in the flow velocity and the continuous rise in the water level. At this stage, the pressure distribution is similar to the hydrostatic pressure and dominates the total pressure. Sometimes, transient fronts can be observed behind the tidal bore and further secondary flow and vertical circulation can be induced. 1 The transient fronts generally arrive a couple of minutes after the tidal bore passage and last several minutes.
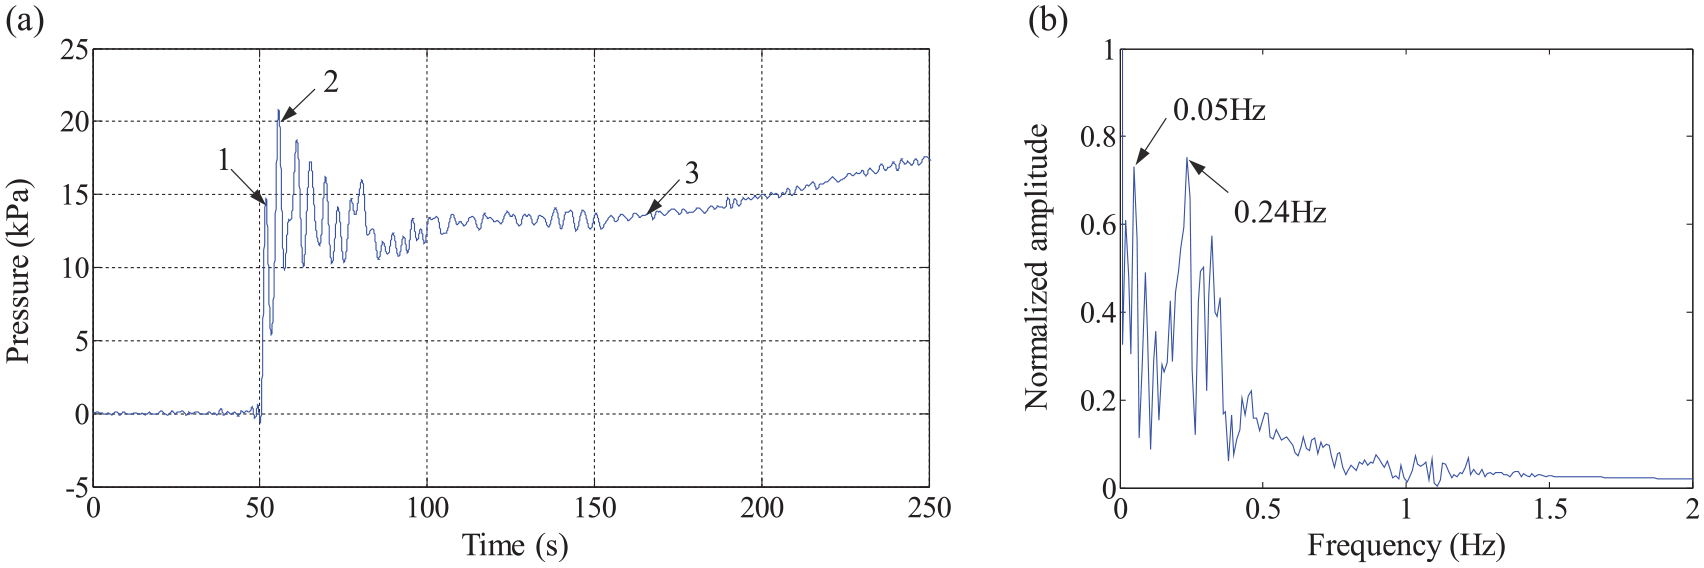
Experimental results of tidal bore impacts on a trestle pier: (a) the time-history record (1 = impulsive stage, 2 = transient stage, and 3 = quasi-steady stage) and (b) frequency spectrum.
As shown in Figure 6(a), the time-history record of the tidal bore is a typical time-varying nonstationary signal. The peak pressures during the impact and transient phases are 14.76 and 20.78 kPa, respectively, which are about 1.2 times and 1.7 times the initial average value in the steady phase. Figure 6(b) shows the frequency and normalized amplitude spectrum. The pressure signal includes two prominent dominant frequency components, 0.05 and 0.24 Hz. The former is due to the relative long-period water surface fluctuation, while the latter is attributed to the oscillation and pulsation resulting from the interaction of the backward reflection bore and the forward propagating whelps.
Vertical pressure distribution
The impact pressure on the pier under the action of the tide bore is directly related to the height of the tide bore. The tidal bore height is primarily affected by the nonlinear dynamic action of estuarine tides, runoff, and bottom topography. Based on the current state of the Qiantang River, the most critical factors affecting the strength of the tidal bore are the downstream tidal range, upstream runoff discharge, and river channel topography. The height of the tidal bore is reduced owing to the energy loss of the tidal wave breaking during propagation; meanwhile, it is increased by the superposition of reflected tidal waves. When the tidal bore impacts the elevated structures, the instantaneous change in pressure causes a strong pulsation. The maximum tidal bore pressure is produced when the backward reflected bore and forward propagating whelps are superimposed, which lags behind the arrival of the tidal bore front. This delay is generally 2–3 s.
Figure 7 shows the time histories of the tidal bore pressure with different Froude numbers at nine locations (P1–P9) on the trestle pier. The low tide level in each tidal cycle was slightly different during the test, but it was located near P6. Hydrostatic pressure affects the tidal bore pressure in the zone directly impacted by the tide front (e.g., P6). This is related to the impulsive pressure generated by the momentum change when the bore acts on the pier for a short time. In addition, the bore run-up in the slamming zone also leads to an increase in the hydrostatic pressure. In the area above the water level at the top of the tidal bore front (such as P1), considerable impact pressure is generated during the formation of a chute-like jet (Figure 3(c)) owing to the pier’s obstruction of the tidal bore propagation, and the peak pressure of the instantaneous impact state can reach more than ten times the pressure in the quasi-steady stage. In the underpart of the pier, where the water depth is relatively high (e.g., P9), the tidal bore pressure is almost equivalent to the water pressure when the water level is still.
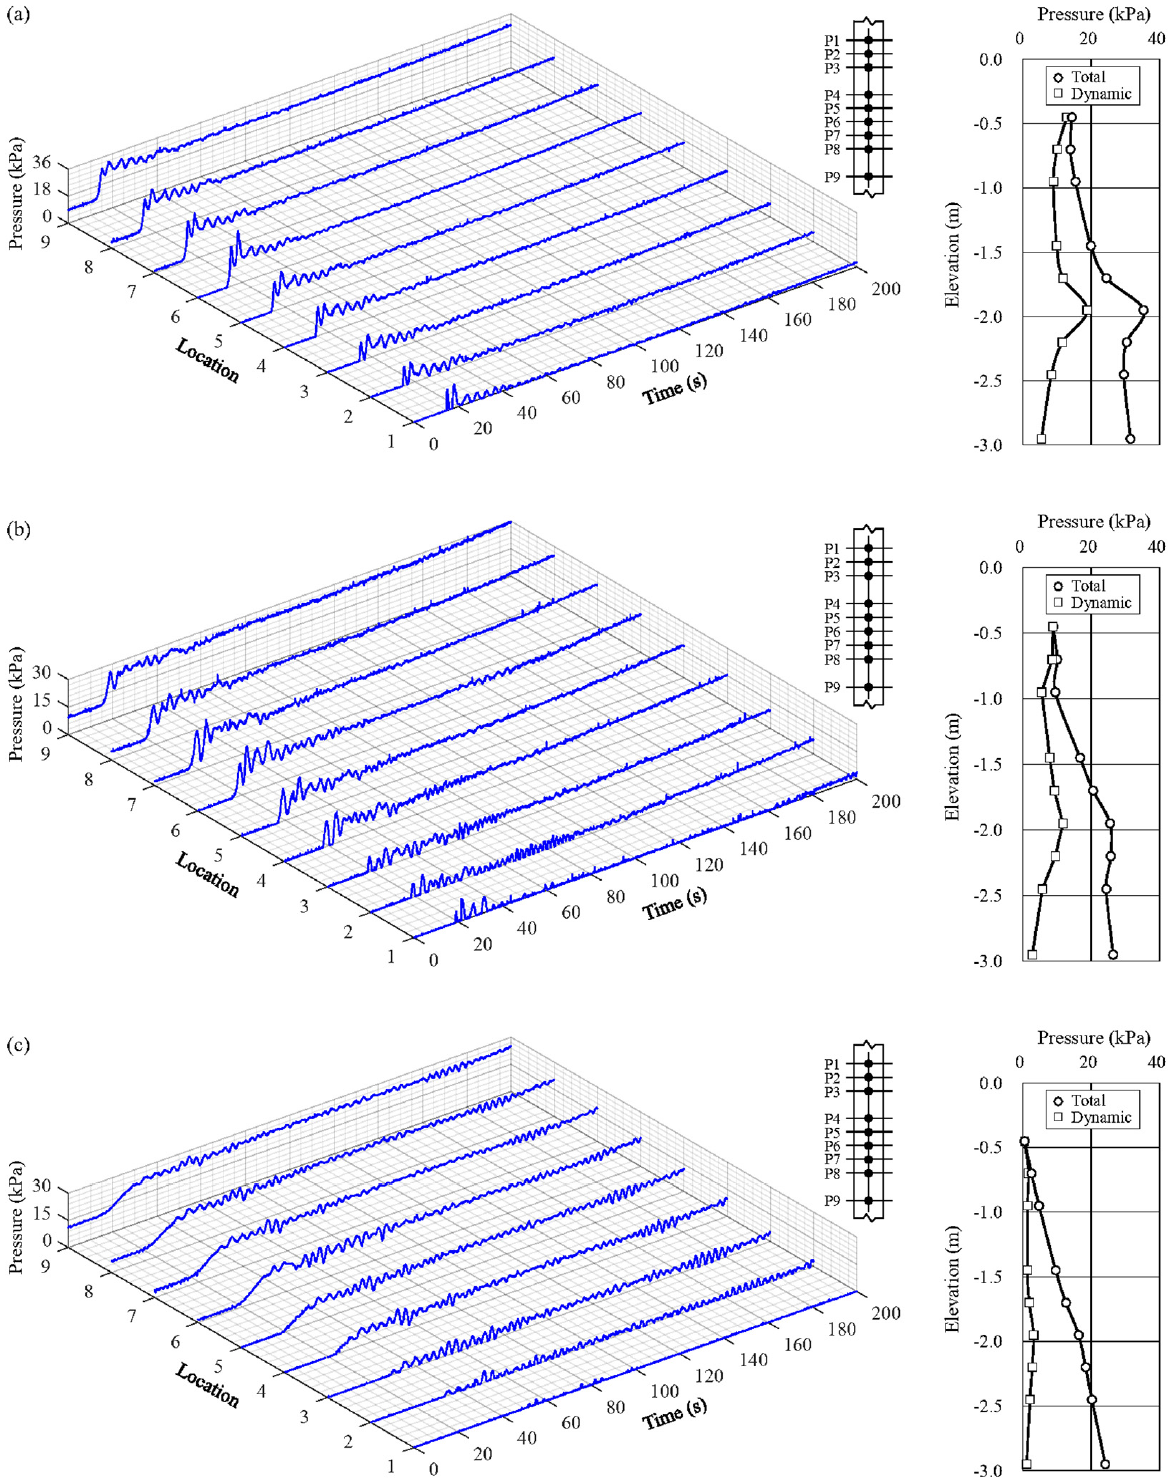
Time histories of tidal bore pressure with different Froude numbers at nine locations, P1–P9: (a) Fr = 1.26, (b) Fr = 1.12, and (c) Fr = 1.04. Right inset: simultaneous vertical impact pressure distribution at the time when P6 is at its maximum; dynamic pressure is the measured total pressure minus hydrostatic pressure.
The tidal bore-induced dynamic impact pressure is the difference between the total and hydrostatic pressures. The hydrostatic pressure is proportional to the water depth measured from the surface and can be determined using the tidal bore profile. With a decrease in the Froude number, the dynamic impact pressure of the tidal bore decreases significantly. The main factor causing this change was the frontal steepness of the bore. The results showed that the maximum dynamic impact of the tidal bore usually occurs near the low tidal level before the passage of the leading edge. With Froude numbers of 1.26, 1.12, and 1.04, the peak dynamic pressure accounted for 54%, 45%, and 20% of the total pressure, respectively.
Discussion
Distribution characteristics of tidal bore pressure
To the best of our knowledge, existing design guidelines do not provide an accurate method for estimating tidal bore loads. According to the tidal bore inundation and impact characteristics, the vertical distribution of pressure on the pier can be divided into four zones. As shown in Figure 8(a), Zone I is located above the surface of the tidal bore and the pressure is determined by the height of the splash, which is characterized by a triangular distribution. In this zone, the peak pressure of the instantaneous impact state is much larger than that of the quasi-steady state. Zone II is within the range of the tidal head height. The tidal bore pressures in this zone can be divided into two types based on the formation mechanism: (1) impulsive pressure resulting from the rapid variation of momentum caused by the added mass of the pier when the tide front passes through and is produced by the steep bore front and large horizontal acceleration at the front of a bore, which is similar to surface waves7,8 and (2) additional differential pressure caused by the height difference between the water surface before and after the pier. The magnitudes of these two parts are affected by the tidal bore characteristics and are related to the aspect ratios of the pier. The trapezoidal pressure distribution is a characteristic of Zone II.

Vertical peak value distribution of tidal bore impact pressures on a trestle pier: (a) pressure zoning, (b) Fr = 1.26, (c) Fr = 1.12, and (d) Fr = 1.04.
Zone III is the seaward front of the pier surface below the low tidal level and is dominated by the hydrodynamic and hydrostatic pressures generated by the tidal bore. The dynamic pressure at the intersection of the vertical line of the upstream surface of the pier and riverbed surface is assumed to be zero. The tidal bore pressure in this area has a trapezoidal distribution. Zone IV is the section of the pier below the low water level, which has a triangular distribution under the action of hydrostatic pressure.
Formulas for the tidal bore pressure prediction
The tidal bore-induced peak pressure is primarily related to the height of the tidal bore. However, the tidal bore heights and pressures at different points in the same riverbed section are also distinctive. The measured data showed a good correlation between tidal bore height and pressure. In Zone II, this part of the pressure is directly affected by the tidal bore height. As shown in Figure 9, the functional relationship between peak pressure and tidal bore height can be expressed as follows:

where PII is the peak pressure at the base of the tidal bore, including the sum of the hydrostatic and hydrodynamic pressures, and Hb is the height of the tidal bore. The coefficient of determination (R2), mean absolute error (MAE), and root mean squared error (RMSE) are 0.72, 4.76, and 5.49 kPa, respectively.

Relationship between the peak pressures (PII) and the height of tidal bore (Hb) in Zone II.
In Zone I, the tidal bore-induced pressure is mainly determined by the splash height produced by the tidal bore impact. Field observations indicate that the relationship between the splash height (Hs) and PII can be fitted as

where k is a constant related to the aspect ratio, which is taken as 1.0. Figure 10 presents comparisons of the predicted values using equation (3) with the field-measured values. The results show that the predicted value using equation (3) is in good agreement with the field-measured value, and the relative error is within 20%. The R2, MAE, and RMSE are 0.85, 0.13, and 0.16 m, respectively.

Comparison of measured and predicted splash height (Hs) using equation (3).
According to the measured pressure and splash height, as shown in Figure 11, the following relationship can be established.

where PI is the peak pressure at the top of the tidal bore and HS is the splash height. The R2, MAE, and RMSE are 0.86, 1.56, and 1.92 kPa, respectively.

Relationship between the peak pressures (PI) and the splash height (Hs) in Zone I.
In Zone III, the total pressure at point f (Figure 8(a)) is determined only by the hydrostatic pressure, which can be expressed as

where PIII is the peak pressure at the seaward front of the pier bottom, d2 is the water depth after the tidal bore arrives, and ρ is the density of the water.
In Zone IV, the total pressure at point g (Figure 8(a)) is similar to that at point f. The hydrostatic pressure can be expressed as

The predictions by the proposed formulas agree well with the tidal bore impact pressures measured during the field tests, as shown in Figure 8. The root mean square error values for the three cases with Fr = 1.26, 1.12, and 1.26 were 6.8, 2.4, and 1.9 kPa, respectively. These empirical formulas offer a good prediction of the tidal bore impact pressure on a trestle pier.
Conclusions
The enormous hydrodynamic force induced by tidal bores impacts the seaward front of infrastructures built across the river, scours the riverbed, and damages the foundations of seawalls and piers, thus reducing the safety of marine infrastructure. Existing design guidelines do not accurately estimate the tidal bore loads on an elevated structure. This paper presents an on-site observation of the impact of a tidal bore on a construction trestle pier in the Qiantang River, China.
First, the characteristics of the tidal bore impact on a trestle pier were presented based on long-term field observations. Second, the time histories of the tidal bore profiles and pressures acting on the trestle pier were analyzed to understand the impact loading process. Third, the vertical distribution of pressure on the piers was divided into four zones according to the tidal bore inundation and influence. Finally, formulas were derived for predicting the impact pressures for a trestle pier based on the observations.
These results can directly guide the design of elevated structures in tidal bore-prone channel segments. Moreover, because the tidal bore is analogous to a tsunami, the observations and data provided in this study can provide verification cases for physical and numerical modeling to realize the tsunami-resistant design of elevated coastal structures. The pressure development process and physical mechanism of the tidal bore impacting different structures will be further studied through field observations, model tests, and numerical simulations.
Footnotes
Handling Editor: Chenhui Liang
Declaration of conflicting interests
The author(s) declared no potential conflicts of interest with respect to the research, authorship, and/or publication of this article.
Funding
The author(s) disclosed receipt of the following financial support for the research, authorship, and/or publication of this article: This research was financially supported by the National Natural Science Foundation of China under grant numbers 41906183, 41876095, and 42176214; the Zhejiang Provincial Natural Science Foundation of China under grant numbers LZJWZ22E090002 and LZJWY22E090006; and the Key Program of the President of Zhejiang Institute of Hydraulics and Estuary under grant number ZIHE21Z001.