
Abstract
The rapidly developed Unmanned Aerial Vehicles (UAV) and artificial intelligence technology has prompted the real-time and accurate observation measurements of tidal bore, the basis of which is tidal bore propagation velocity. In this article, we construct a tidal observation system framework based on UAV and computer vision in order to obtain the tidal bore propagating velocity datasets. Firstly, we focus on the identification of tidal headlines based on the Sobel edge detection, the improved Otsu image segmentation algorithm and the edge connection algorithm with an accuracy of 91%. And then, the detected tidal headlines could be used to control the flight parameters of UAV in order to stably track tidal bore on the specified route with the deviation range below 0.5, and finally to acquire the tidal bore propagation velocity datasets. Comparing with the propagation velocity of the tidal line measured on site, the error of the results is maintained within 0.1 m/s, which demonstrates the effectiveness of our proposed observation method.
Keywords
Introduction
Tide bore is a unique natural landscape and valuable tourism resource,1,2 but its huge energy induced disasters frequently on both sides of Qiantang River and affects the estuary ecosystem. 3 Scholars have conducted long-term exploration on the mechanism and laws of tidal bore propagation. However, due to the rapid arrival, fast propagation velocity, and high difficulty in observation of tidal bore, research on tidal bore is still limited. As the basis of research on tidal bore, tidal bore observation can provide effective data support for tidal bore prediction, safety protection, and analysis of tidal bore hydrodynamics. Wherein the observation of the tidal bore propagation velocity is an important parameter. Although the observation methods for tidal bore are constantly improving and innovating, there is a lack of effective and convenient observation methods to obtain tidal bore data and conduct in-depth research on it. Nowadays, the main observation methods of tidal bore propagation velocity are classified as follows,
(1) Indirect acquisition method of mathematical analysis, which is to establish the mathematical relationship between tidal bore propagation velocity and other tidal bore parameters through flume simulation experiments or historical observation data. Pan et al. 4 established an analytical formula for the propagation velocity of tidal bore based on the momentum equation and one-dimensional continuity equation. Yang et al. 5 obtained the tidal bore propagation velocity through the continuity equation and momentum equation of the steady flow in the open channel. The formula proposed by Zhang et al. 6 can be used to calculate the propagation velocity of the tidal bore of nearshore shallow water.
(2) Contact sensor observation method, which uses sensors that are in contact with water flow for observation. Zhou et al. 7 manually drove steel pipe piles and in-stalled observation sensors in the river and on the shore to obtain tidal bore data through these sensors. Wolanshi et al. 8 used a Doppler velocity profiler to observe the tidal bore at the Daly estuary in Australia. Koch and Chanson 9 proposed a method for observing the instantaneous velocity of tidal bore using an acoustic Doppler velocity profiler through simulated water tank experiments. Xie et al. 10 observed the flow velocity of tidal bore by installing a Doppler velocity profiler on a floating platform.
(3) Non-contact sensor observation method, which uses sensors that do not con-tact water flow for observation. Xu et al. 11 used close-range photogrammetry observation methods to conduct three-dimensional modeling of tidal bore and obtain corresponding tidal bore data. Zeng et al. 12 collected real-time video data of the river surface through the offshore measurements, processed the video data, and completed the identification of tidal bore. Zhejiang Water Conservancy and Estuary Research Institute observes the variation of tidal bore propagation velocity in the range over 20 km using X-band radar.
In summary, traditional methods of the tidal bore observation have some problems, such as limited observation range, incomplete data acquisition, complex observation process, and safety risks. For example, the mathematical analysis method establishes the mathematical relationship between the propagation velocity of tidal bore through water tank simulation experiments that not only relies too much on historical observation data, but also different methods are not entirely applicable to tidal bore in different scenarios. The contact sensor observation method can generally only observe the information at one point, which is very limited. At the same time, due to the perennial erosion of the sensor by the tidal bore, the detection accuracy of the sensor decreases. The non-contact sensor observation method currently mainly uses non-contact water flow sensors for tidal bore data observation, but due to the observation equipment being installed on the shore, it is also insufficient to provide more comprehensive data for tidal bore research.
In response to the shortcomings of current methods for observing the tidal bore propagation velocity, this paper proposes a method based on UAV and machine vision to obtain the tidal bore propagation velocity. Compared with traditional tidal bore observation methods, this method achieves a significant breakthrough in observation range, and can automatically complete the collection of tidal bore data in any large-scale range of river for continuous time scale, so as to obtain the continuous spatiotemporal changes of the tidal bore propagation velocity in river channels. At the meantime, during the propagating process of the tidal bore, it will produce visually noticeable tidal lines. Compared to the calm river surface, the tidal bore line as a whole appears white, forming a sharp contrast with the river surface. It is easy to extract the tidal bore line through image processing. Therefore, this article combines modern technology, such as advanced measurements and artificial intelligence to propose a tidal bore propagation velocity observation method based on UAV and computer vision.
This article proposes an accurate and real-time tidal bore recognition algorithm, involving edge detection algorithms,13,14 the image segmentation algorithm15–17 and the edge connection algorithm18,19 can accurately identify the tidal bore headlines under complex river conditions. At the same time, a real-time automatic tracking algorithm for tidal bore by UAV has been proposed, which can control UAV to track tidal bore on specified routes. With the help of the tidal bore observation method proposed in this article, the spatiotemporal variation process of tidal bore propagation velocity on a large scale of the river channel can be obtained. Compared with traditional methods of the tidal bore observation, this method has the characteristics of large-scale observation range, flexible observation method, simple and convenient observation process, etc. It can provide support for the study on the tidal bore propagation laws, and even contributions for disaster prevention and risk reduction of the embankments.20–22
Related work
Due to the varying degrees of fragmentation, blurred edge detection, and discontinuity of the tidal headlines, it is necessary to improve image processing techniques such as edge detection, image segmentation, and edge connection, in order to be suitable for the tidal bore recognition. Several issues that related to the image processing methods are discussed as follows.
Edge detection method
Different edge detection methods have emerged for different application scenarios, which can quickly and efficiently detect the edge of the image. The classic edge detection operators, such as Robert operator, Prewitt operator, Laplace operator, Canny operator, Sobel operator, etc., mainly determine the edge through the characteristics of Grayscale (color, gradient, brightness, etc.).
The Robert operator calculates the difference between diagonal pixels in the image as the basis for edge detection, but this operator is susceptible to noise during edge detection. Dey et al. 23 used the edge detector of Robert operator to detect the edge of the initial image as the data set for subsequent in-depth learning, so as to screen early breast cancer more accurately, which plays a very important role in reducing the early mortality of breast cancer. Erwin and Yuningsih 24 used Prewitt edge detection and Hough transform in retinal vascular detection, which significantly improved the diagnostic efficiency of the condition. The Laplace operator is a second order differential operator, which uses the second derivative information to find the edge of the image. Han et al. 25 proposed a support vector machine classification method based on Laplace edge features for precise localization of cell nuclei in different spots and scales. The Canny operator is a multi-level edge detection algorithm based on Grayscale. Kutty et al. 26 used Canny operator and Sobel operator to detect logo edges respectively, and compared the detection effects of the two operators, the results of which showed that both methods can be used as auxiliary methods for logo detection. The Sobel operator is a common edge detection operator based on first-order derivatives. Its principle is to use discrete difference method to calculate the magnitude gradient of each pixel, and then select a threshold for edge detection.
Image segmentation method
Image segmentation refers to dividing an image into multiple independent regions based on its external features such as grayscale values, colors, and shapes. All features within each region have similarities, while different regions have completely different features. Common image segmentation methods include threshold segmentation and histogram threshold segmentation.
The principle of threshold segmentation method is to select an appropriate threshold based on the characteristics presented by the grayscale value of the image. The pixel values of each pixel are compared with the size of the threshold to complete the segmentation of the image foreground and background. The key is how to accurately find this threshold. The advantage of this method is that it is suitable for scenes with different grayscale levels of background and foreground. The disadvantage is that it is too sensitive to noise when only considering the grayscale value itself without considering spatial features simultaneously. Common threshold-based segmentation methods include Otsu thresholding method, 27 balanced histogram thresholding method, 28 maximum entropy thresholding method, 29 and so on.
The principle of histogram threshold segmentation method is to determine the threshold by searching for the position of peaks and valleys in the pixel value histogram of an image. Common methods include shape modeling, convex shell method, and peak-valley detection. 30 The advantage of this method is high efficiency in finding the threshold, while the disadvantage is that it is difficult to find the correct threshold when the peaks and valleys of the image are not obvious.
Edge connection method
In response to the possibility of poor edge detection performance in image edge detection, Zhang et al. 31 used a self-adaptive detection algorithm to detect the wildfire by calculating the two-dimensional histogram of mid-infrared channel. For the case of discontinuous image edges, it is necessary to calculate the difference map between high and low threshold images, and find the position of the endpoint within the high threshold image, Search for any points connected to the edge line within the eight neighborhoods of the corresponding points in the difference graph, and save the eligible points in the set of endpoints until the edges are connected. Nezamabadi-pour et al. 19 proposed a new edge detection method based on ant colony search, represented by a directed graph, where nodes are pixels of the image. The algorithm parameters were determined through extensive experiments to achieve good edge detection results. Lu and Chen 32 proposed an edge detection algorithm based on Ant colony optimization algorithms to reduce the amount of computation through four mobility strategies, which can obtain the information of the remaining edges in a limited number of iterations, and finally completed the edge connection based on Ant colony optimization algorithms, effectively and accurately restored the edge information of the image.
In order to avoid the problem of poor integrity and discontinuity of the tidal headline, which makes it impossible to accurately extract the tidal bore line, it is necessary to use the tidal bore line connection method to connect the broken tidal headline. At the break of the tidal bore line, pixel points that meet the conditions are selected according to the given conditions and methods, and finally the complete tidal bore line is obtained.
Methodology
This article constructs a tidal bore observation system based on UAV and computer vision (see Figure 1 below) to record the propagation velocity of tidal bore at different spatial points.
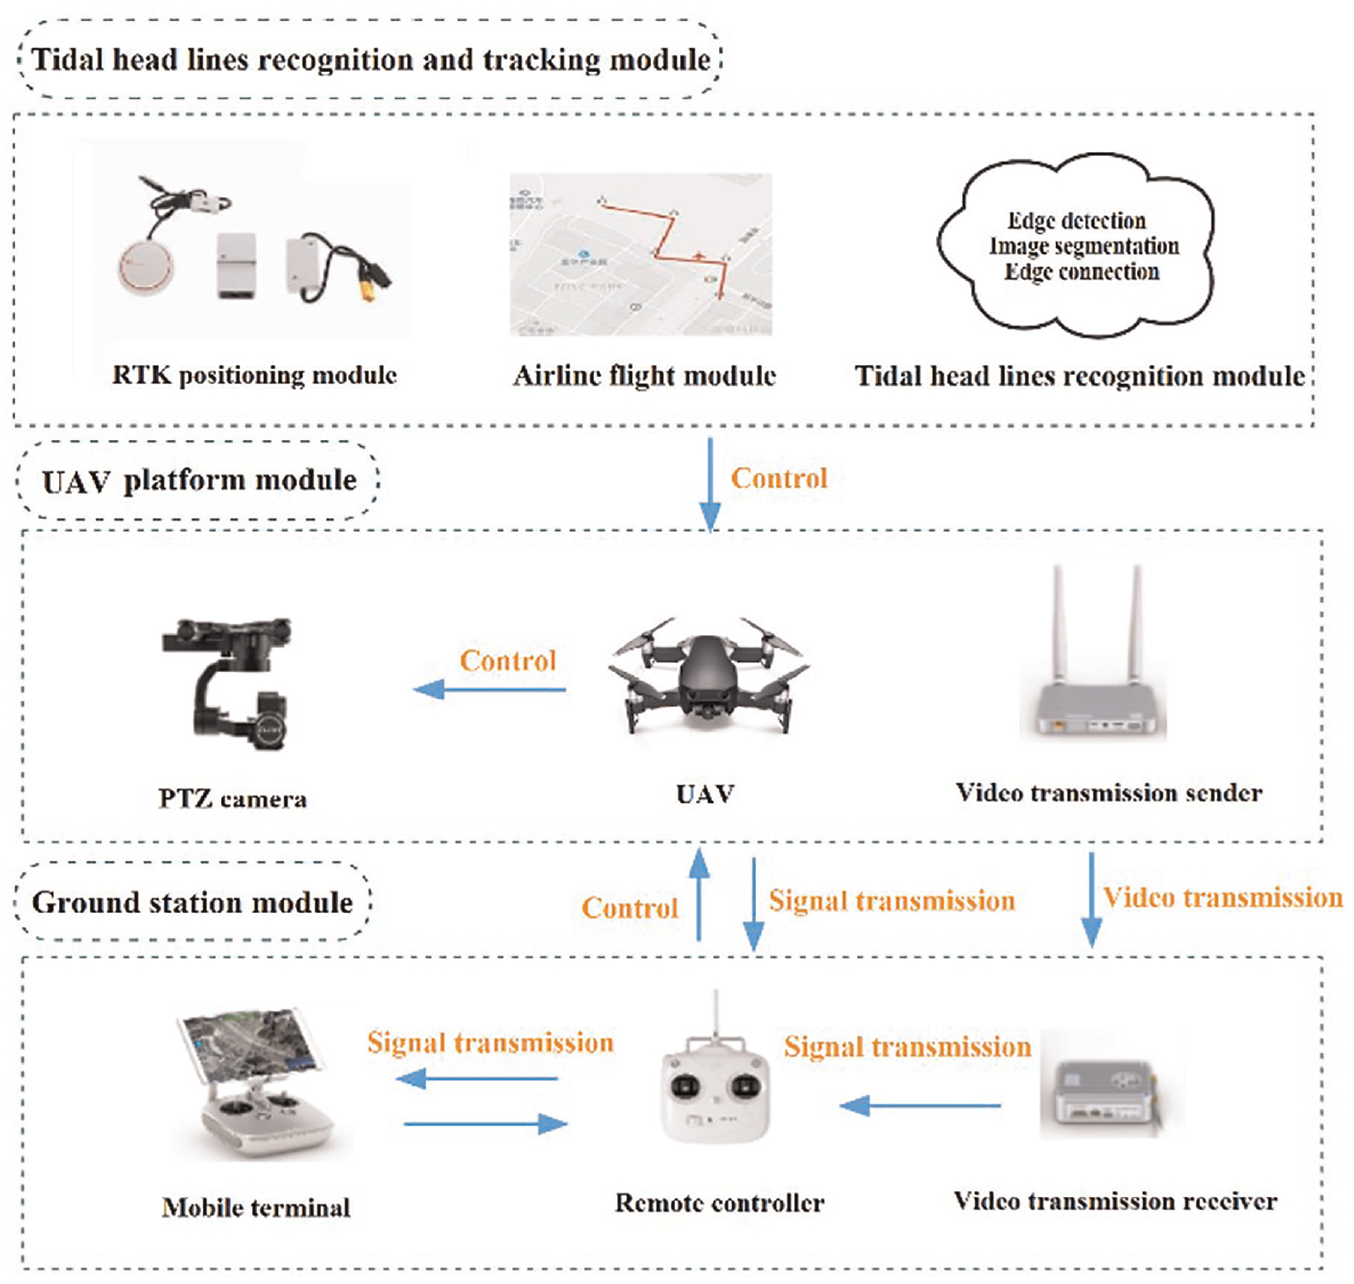
Framework of tidal observation system based on UAV and computer vision.
The system mainly includes: (1) Tidal headlines recognition and tracking module. By using computer vision methods, the center point of the tidal headline is fitted and then used as the target for UAV detection, controlling UAV to accurately track the tidal bore along the specified route; (2) UAV platform module. With the assistance of control commands, the UAV completes the prescribed flight route and uses the onboard pan tilt camera to capture real-time tidal bore videos; (3) Ground station module. Based on the results of the tide line recognition and tracking algorithm, the flight control commands are emitted to enable the UAV to complete the tidal bore following task and to receive relevant data of tidal bore at different spatial points transmitted by the pan tilt camera.
This system innovatively integrates all functions into the ground station, automatically and stably completing the control of drones and data acquisition. Compared to the development of traditional drone applications, it can save time to be dedicated in algorithm development and verification, and effectively ensure the stability and security of the system. At the software level, the Android Studio development environment is adopted, while introducing the development kits required for each functional module. At the algorithmic level, through the identification algorithm of tidal bore lines and the unmanned aerial vehicle’s automatic tracking of tidal bore flight control algorithm, the unmanned aerial vehicle can achieve automatic tracking of tidal bore flight on the planned route.
Tidal headlines recognition and tracking module
Tidal headlines detection method based on Sobel operator
After interferences removal from the experiment by image grayscale and denoising filter to improve the accuracy of edge detection, 33 the Sobel operator 34 are used for edge detection due to the drastic changes in gradient amplitude of the tidal bore in the water flow direction.
Firstly, a 3 × 3 convolution kernel needs to be defined. Based on the significant difference in pixel points before and after the tidal bore headline, the convolution kernel is selected as the convolution template of the Sobel operator in the Gy direction, By convolving the kernel with the original image, the vertical gradient values of each pixel are obtained. Due to the possibility of negative values or values greater than 255, it is necessary to convert the data type to uint8 type to obtain a grayscale image with pixel values ranging from 0 to 255.
Tidal headlines segment method based on improved Otsu algorithm
This experiment uses the Otsu image segmentation method to automatically obtain the threshold for image segmentation, which is relatively simple to calculate and suitable for scenes with large differences between foreground and background gray-scale values. Due to the presence of a large amount of interferences such as water surface reflection and ripples, which affect the screening of tidal headlines, the Otsu algorithm (see Figure 2 below) has been improved to enhance the image segmentation effect.
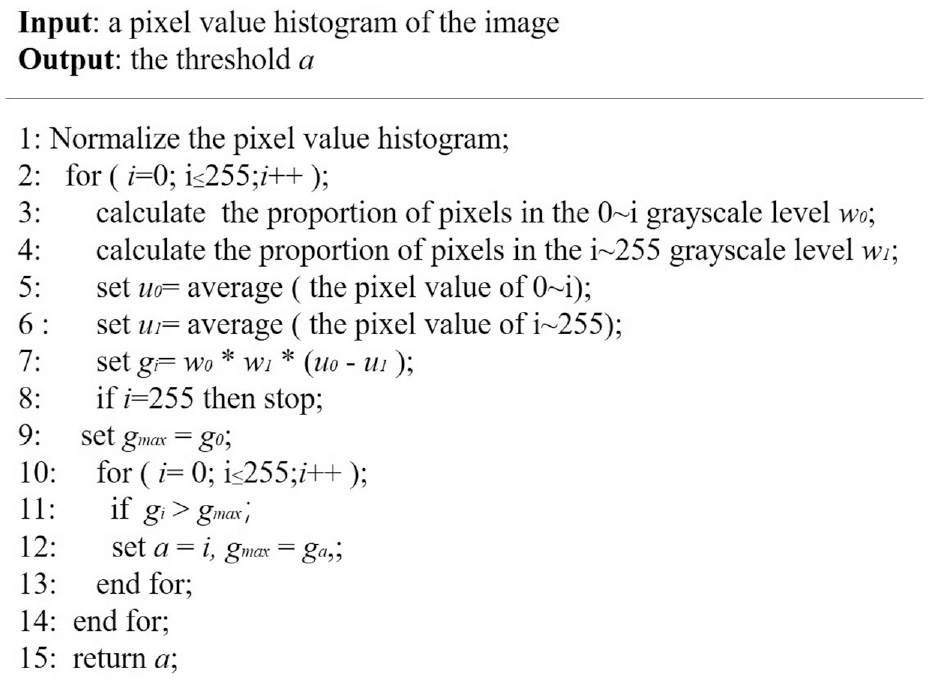
Algorithm of the improved Otsu.
When using the traditional Otsu segmentation algorithm to select the optimal segmentation threshold, due to the fact that the foreground part of the image includes complete tidal bore line, broken tidal bore line, water ripple, and wave light, and the relatively high segmentation threshold, resulting in various interference factors and inaccurate tidal bore line in the image. The improved Otsu algorithm in this article can select the optimal threshold after the first Otsu selection, mainly utilizing the most obvious feature changes of the tidal bore line in the image and the most prominent display effect which represents the greater degree of pixel mutation in the region than the other pixel mutations. Therefore, during the second threshold selection, it is possible to more accurately screen the tidal bore line in the image.
Tidal headlines connecting method based on regional growth
Due to the tidal headline fracture, it will be impossible to obtain a complete tidal headline and thus fit the center point for each tidal headline tracking. Therefore, eligible growth pixel points will be chosen, according the identification of the right end-point of the tidal headline and the searching for growth pixels which meets the judgment criteria as follows,
(1) Gradient amplitude
Due to the relatively high gradient amplitude of the removed tidal headline pixel compared to other points on the river surface, the magnitude of the gradient amplitude of the pixel to be grown can serve as an important reference factor.
(2) Trend of pixel growth direction
The morphological change process of the tidal headline is relatively gentle, and the growth direction of the tidal headline should follow the trend of the original pixel points, as shown in Figure 3.
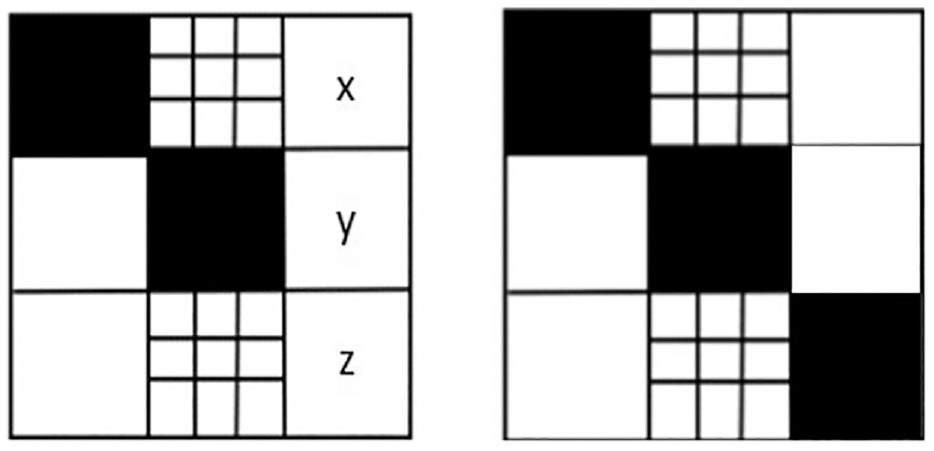
Schematic diagram of the pixel in the growth trend.
In summary, it is necessary to combine the gradient amplitude of the pixel and the angle formed between the pixel and the right endpoint to determine the growth pixel. Calculate the likelihood that the three pixels in the right neighborhood are the pixels to be grown, and the probability calculation formulas equations (1)–(3) are as follows:


Among them, P(x,y) is the likelihood of pixels being used as growth points, and weight is the weight coefficient, μa is the ratio of the gradient amplitude of the pixel to the maximum grayscale value, μb is the deviation rate of the angle between the pixel and the right endpoint, angle is the angle between the pixel and the right endpoint, and G(x,y) is the magnitude of the gradient of the pixel.
Automatic tracking based on UAV platform module
This method mainly aims to adjusts the yaw angle and roll angle of UAV dynamically through the deviation information between the UAV and the route, and combines the information of the tidal center point to dynamically adjust the forward speed of the UAV, completing the tidal bore automatic tracking task along the designated route. The route flight algorithm steps for UAV are as follows:
(1) Initialize waypoint sequence number
Set parameter i and initialize it to 1, where i is the serial number of the waypoint in the route list. The flight mode of the UAV needs to be adjusted based on the relationship between this serial number and the UAV.
(2) Adjusting the yaw angle, roll angle, and pitch angle of the UAV
Obtain the longitude and latitude information of the UAV, yaw angle, and longitude and latitude information of waypoint i, dynamically adjust the size of the UAV’s yaw angle and roll angle, and adjust its pitch angle based on the identification results of the tidal headline to complete the UAV’s route tracking task.
To ensure that the UAV flies on the designated route, it is necessary to ensure that the yaw angle θy is 0. Once the UAV deviates from the route due to external factors, it is necessary to adjust the UAV’s yaw rate and roll rate to complete the route. The velocity is calculated by the following equations (4)–(6):


Among them, Δθ is the deviation between the yaw angle θy and the flight route angle θf of the UAV, Vangelmax is the maximum speed in the yaw direction of the UAV, Vrollmax is the maximum speed in the roll direction of the UAV, Vangle is the yaw rate of the UAV, and Vroll is the roll rate of the UAV.
Finally, dynamically adjust the forward speed of UAV based on the position of the tidal headline, subtract the value of the vertical coordinate of the center point of the tidal line from the value of the vertical coordinate of the center point of the screen to obtain a deviation. Based on the ratio of this deviation to half of the vertical coordinate of the screen, Δdistance, different forward commands of different sizes are obtained. The specific velocity calculation formula equations (7) and (8) is as follows:


Among them, Δdistance represents the difference between the ordinate value of the image center point (rows/2) and the ordinate value of the detected tidal line (centerY), Vgo represents the magnitude of the forward speed sent to the UAV, and Vgomax represents the maximum forward speed of the UAV.
(3) Determination of target waypoints
Determine whether the distance between the current position of the UAV and the waypoint i is less than the given value. When the result is yes, set i = i+1, indicating that the UAV has successfully flown to the waypoint i. Finally, the route will complete until the value of i equals the number of waypoints in the route list.
Calculating method of the tidal bore propagation velocity
Currently the UAV follows the center point of the tidal bore synchronously, and its flight speed is the current propagation velocity of center point on the tidal bore. The propagation velocity of other points on the tidal headline is the superposition of the propagation velocity of the center point and the velocity at each point shifts relative to the original position on the image over a period of time.
According to the camera imaging principle, the internal and external parameters of the camera and the height of the camera are obtained to calculate the relevant values. The relationship between ground resolution, height, and camera parameters is shown in equations (9) and (10):


In the formula, H is the relative altitude of the UAV flight, f is the camera focal length, GSD is ground resolution, px is the pixel size of the photo, L is the size of the camera’s photosensitive device, and N is the number of image pixels. Calculate the speed of pixel displacement based on GSD, the magnitude of pixel displacement on the image and the time interval.
Results
The tidal headlines
Edge detection of tidal headlines
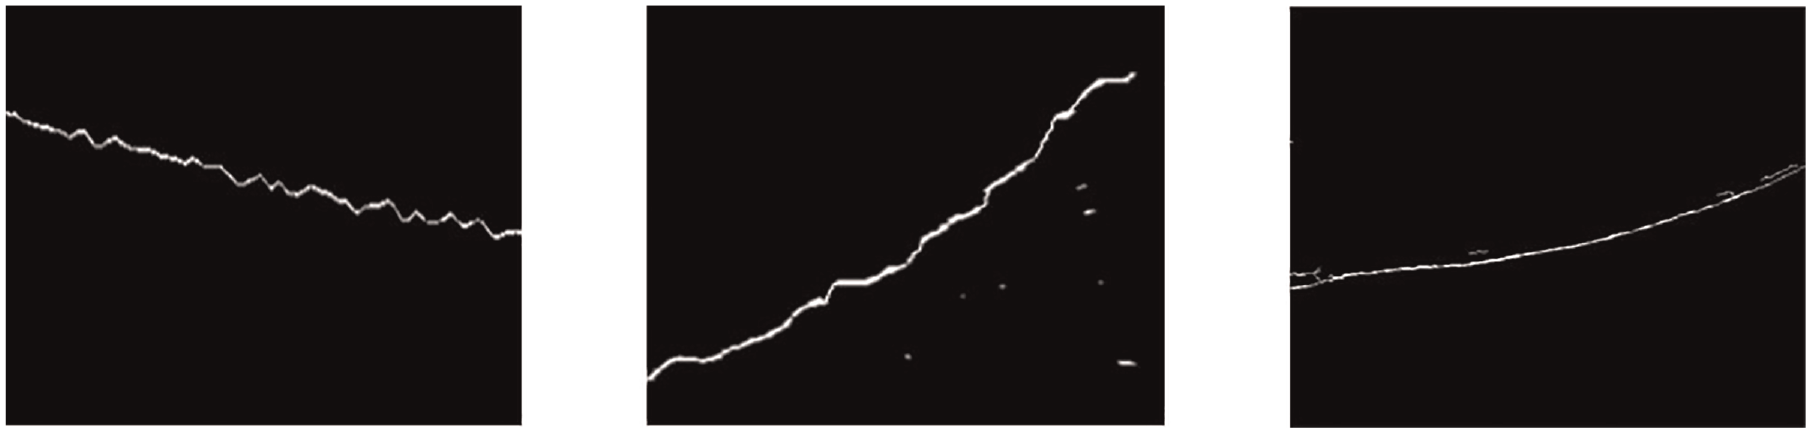
Tests between Sobel-y and Sobel-x directional operators were conducted to compare the accuracy of different operators in detecting the tidal headline. The testing results are shown in Figure 4.
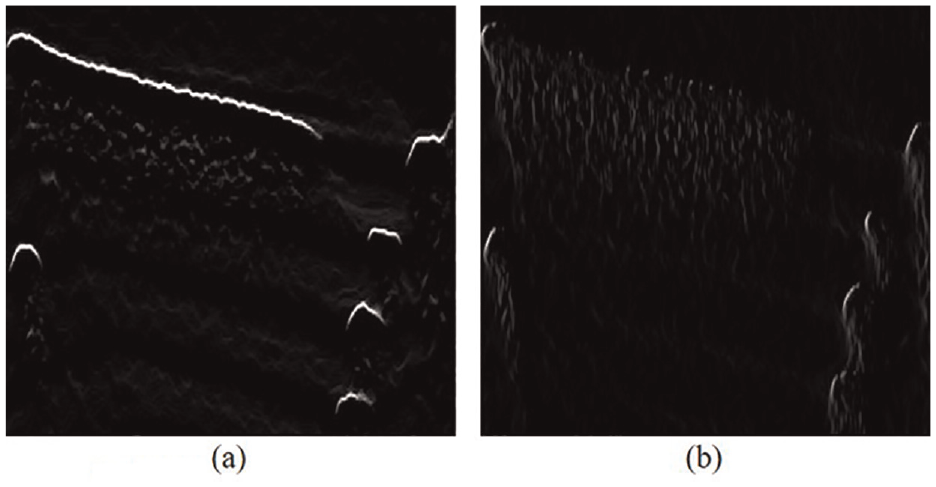
Effect diagram of edge detection: (a) Sobel-y direction and (b) Sobel-x direction.
Segmentation of tidal headlines
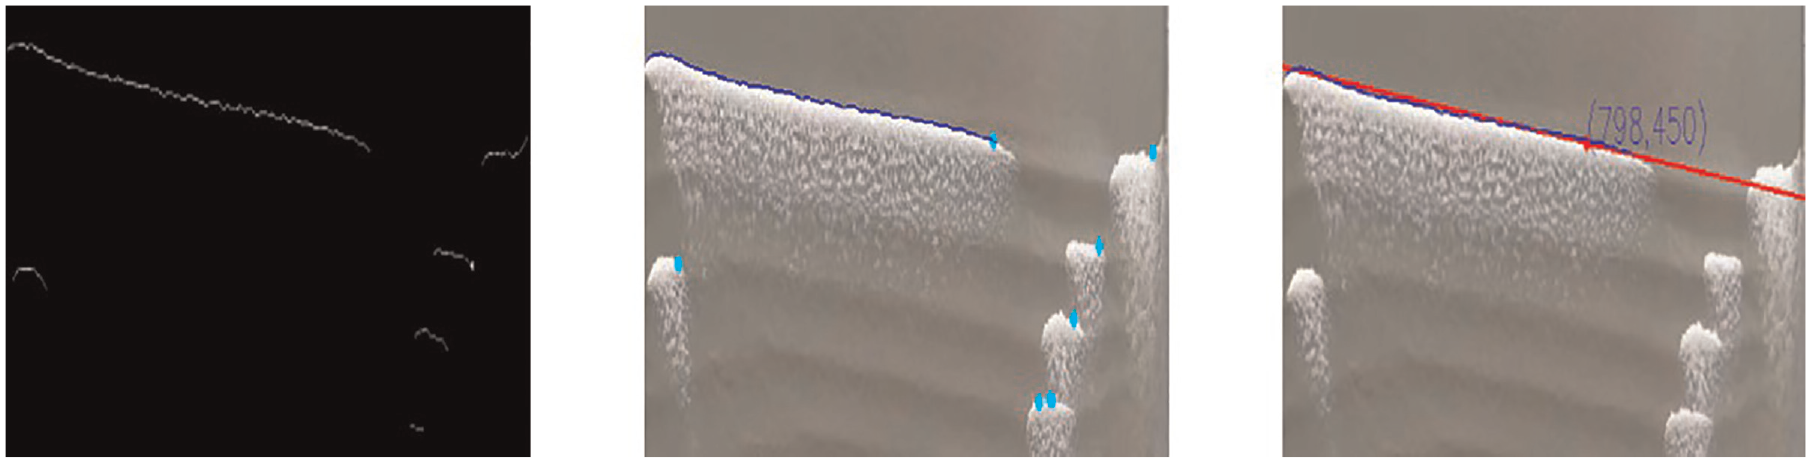
Through an improved Otsu algorithm, experiments were conducted on multiple collected images, and the test results are shown in Figure 5. From the experimental results in Figure 5, it can be seen that the improved Otsu image segmentation algorithm in this article can accurately remove interference points on the image, and thereby effectively preserve the information of the tidal headline.

Effect diagram of different segmentation methods: (a) original images, (b) Otsu, and (c) improved Otsu.
Connection of tidal headlines
According to the test results, the weight for the experiment of connecting tidal headline is 0.7, and the experimental results are shown in Figure 6.
Experiment results of connecting tidal head line.
Fitting of center points on the tidal headlines
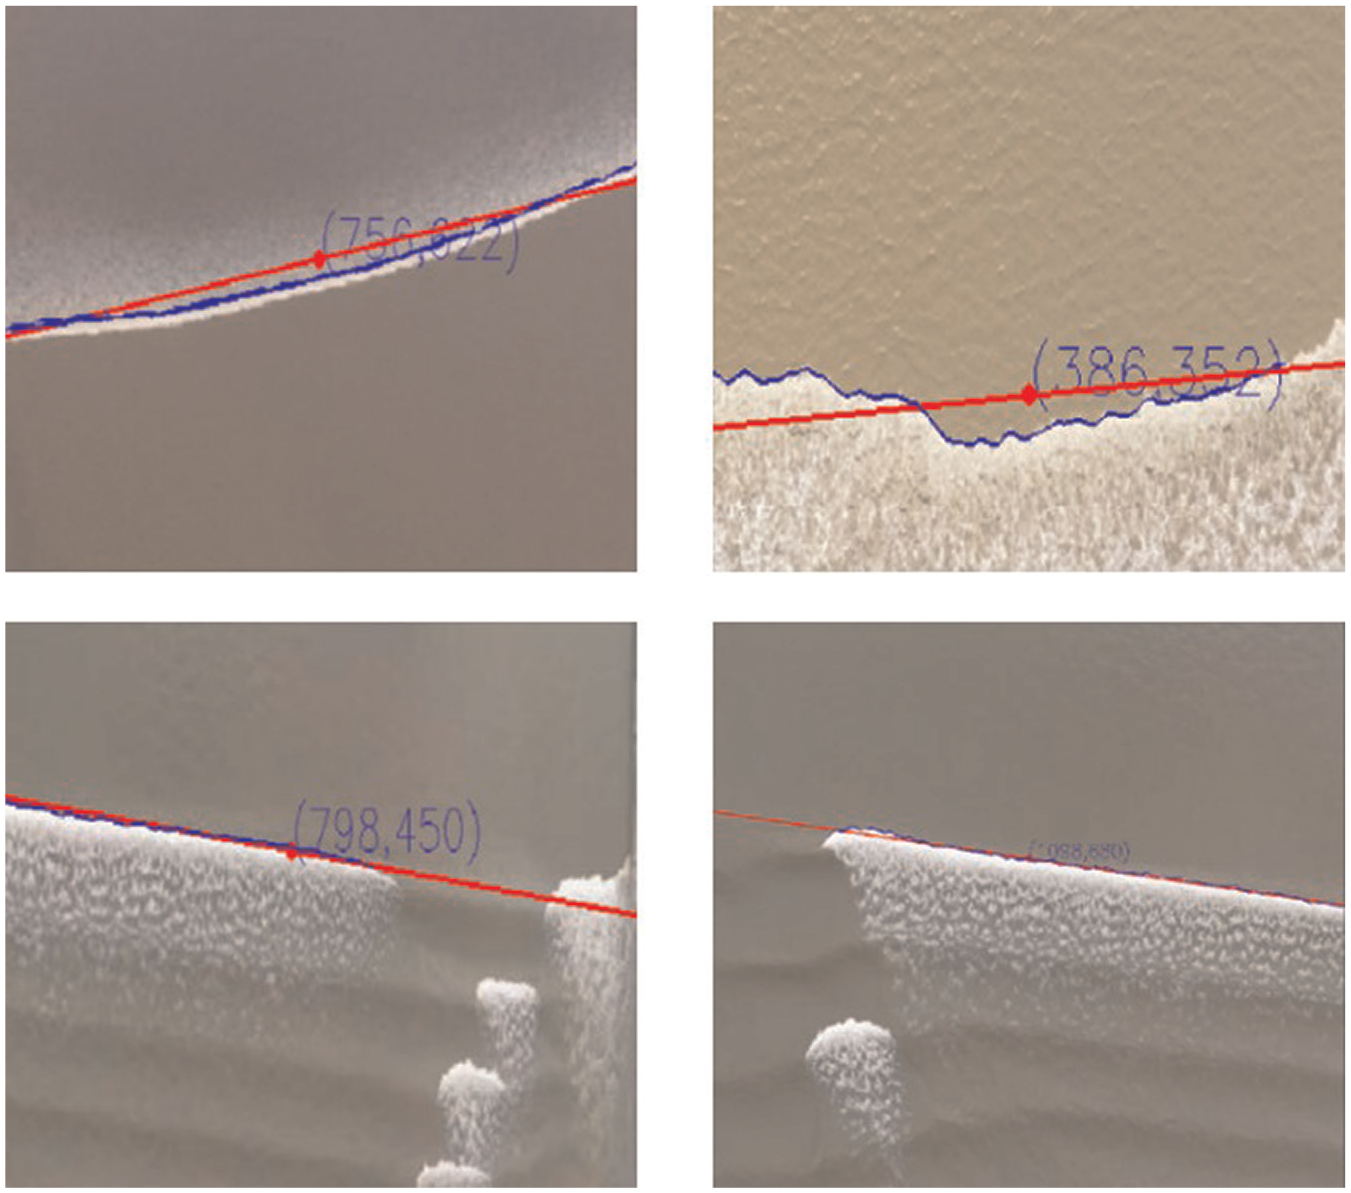
Due to the complexity of the foreground part on the image, the desired tidal headline can be obtained by selecting the largest part. Multiple pixel points on the tidal headline can be selected from the image using the least squares method to fit into a line and then label its center point. The flight speed of the UAV can be determined based on the information of this point, and the result is shown in Figure 7.
Selection of the tidal head lines and fitting of their center points.
Identification of tidal headlines
According to the recognition method of tidal headlines proposed in this article, 100 tidal headlines are identified and fitted with center points (see in Figure 8). The accuracy of fitting the center points on the tidal headlines is as high as 91%.
Results of tidal headlines identification.
Tidal bore propagation velocity
Test of UVA observation platform
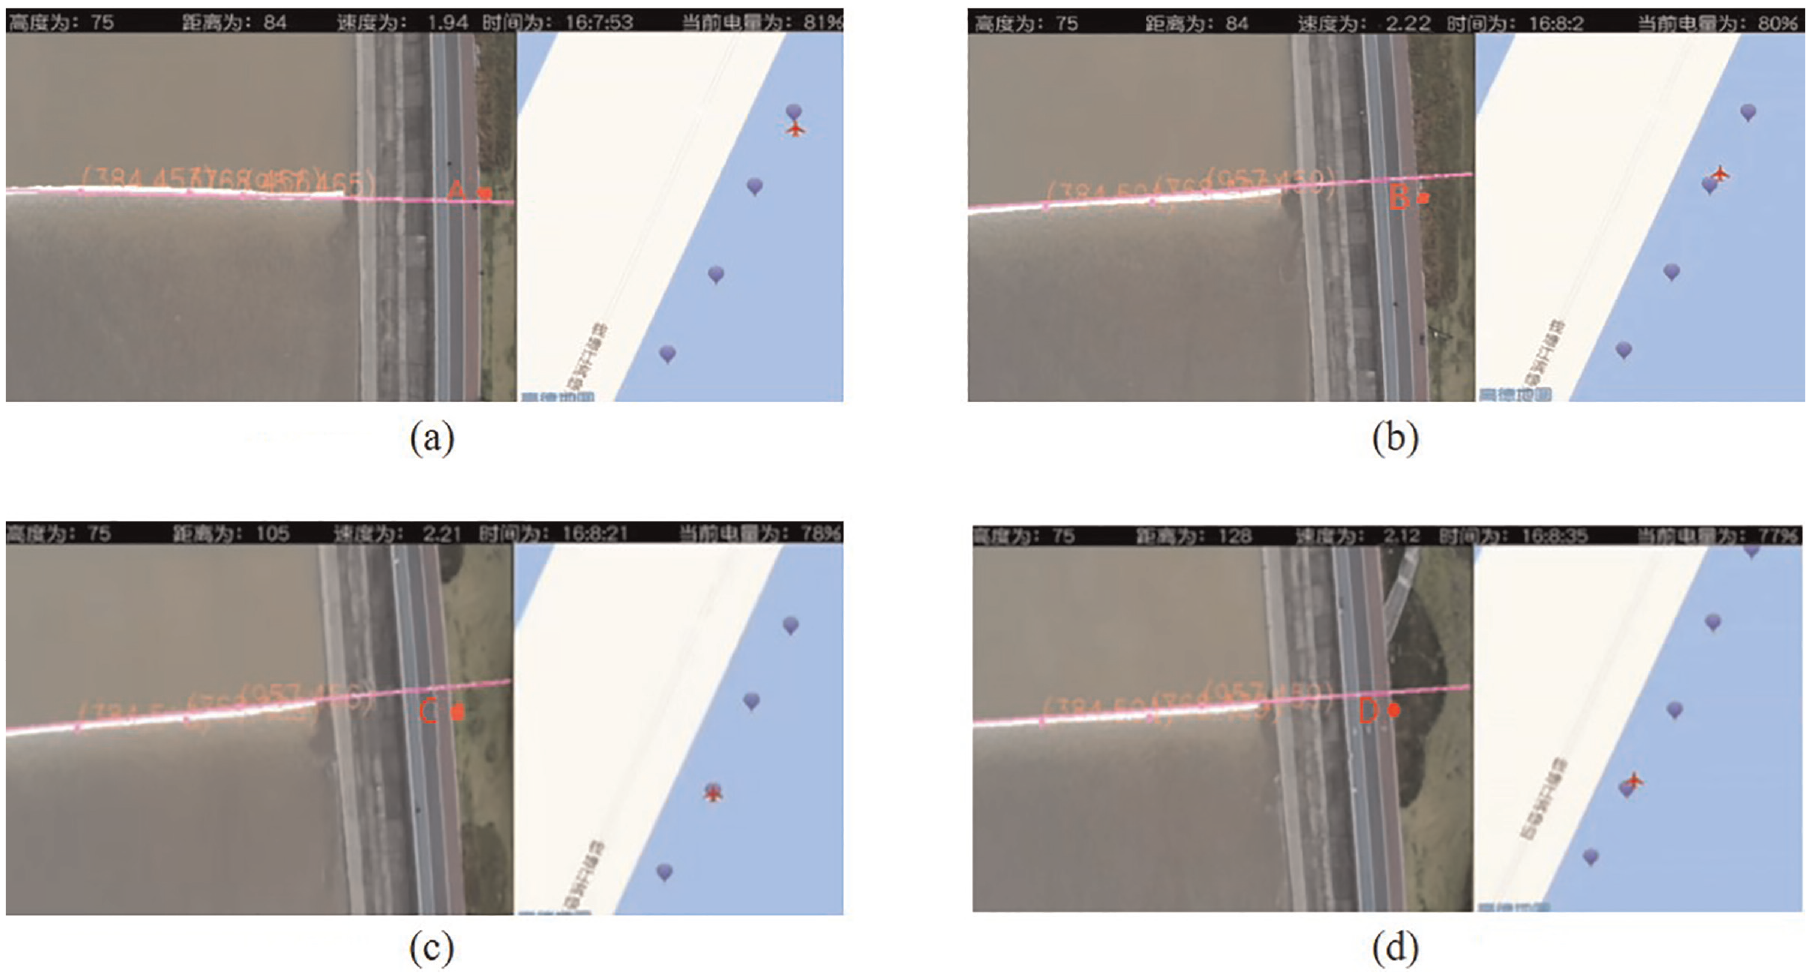
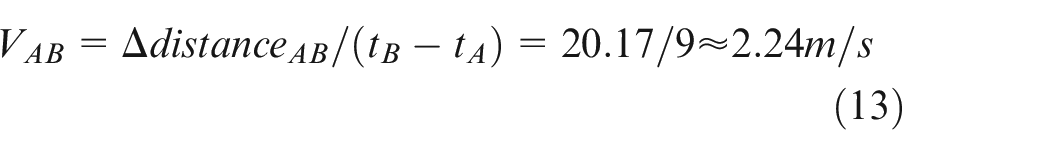
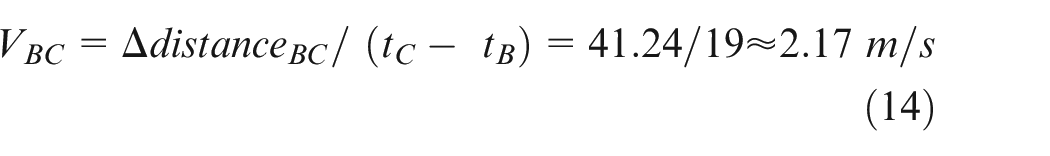
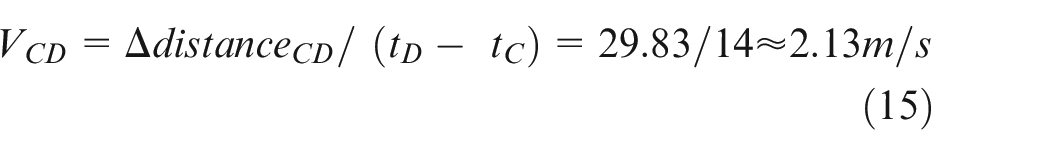
Due to differences in depth, terrain, wind speed, and other factors between the center and banks of the same river section, there are deviations in the propagation velocity of tidal headlines at different spatial points. Firstly, point A (384, 513) and point B (768, 492), as shown in Figure 9, are recorded to the coordinate information of the point to be calculated for propagation velocity at t1 of 16:08:24, while point C (384, 513) and point D (768, 492) are recorded to be calculated for propagation velocity at t2 of 16:08:26.
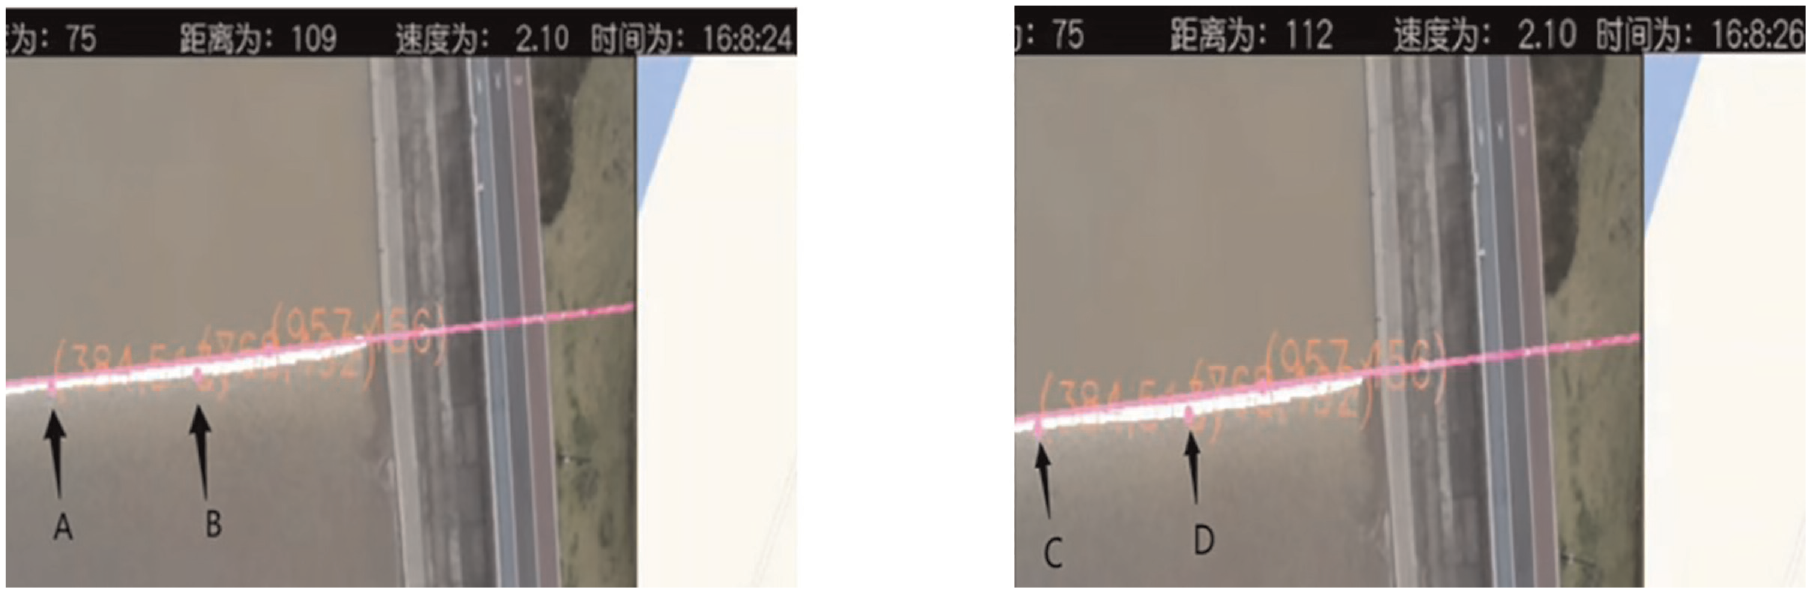
Positions of A, B, C, D points on the tidal headline.
The current speed Va = 2.10 m/s, height H = 75 m, number of image pixels N = 1920, camera sensor size L = 6.17 mm, camera focal length f = 24 mm of the UAV are used to calculate the average velocity V between A-B and C-D. The formulas are as follows:


In the equations (11) and (12), The velocities for points A and B are calculated as 2.10 and 2.10 m/s respectively, which are the same as the propagation velocity of the center point on the tidal headline. Therefore, this algorithm can be used to obtain the accurate propagation velocity of tidal headline.
Experiment on UVA observation platform
The UAV connection function, flight starting point function, route task, and tidal line recognition and tracking function of the ground station were tested separately.
(1) Application registration and connection to UAV
Register as a DJI developer and enter the account password to activate the application after successful registration. When the drone, remote control, and application are connected, the interface will prompt successful connection and enter the ground station interface.
(2) The UAV flies to the starting point and hovers to wait
The UAV flies to the artificially calibrated starting waypoint of the route through the flight algorithm proposed in this article, and hovers and waits after reaching the waypoint.
The current longitude and latitude coordinates of the UAV are (120.407213E, 30.318966N), and the longitude and latitude coordinates of the starting waypoint in the route list are (120.407215E, 30.318969N). And then, the distance between the two points is 0.38 m, which can maintain the accuracy of the UAV reaching the starting point within 0.5 m. Subsequently, 100 on-site experiments are conducted, and then the calculated deviation range of the UAV remains within 0.5 m.
(3) UAV route tasks
The UAV’s route task aims to complete the designated route together with tidal headlines recognition and tracking. The test results of UAV on the designated route are shown in Figure 10.
Tests of UAV in the designated route and the field points: (a) arriving point A, (b) arriving point B, (c) arriving point C, and (d) arriving point D.
When the UAV passes through the three waypoints, the longitude and latitude coordinates are (120.407074E, 30.318697N), (120.406930E, 30.318381N), and (120.406787E, 30.318062N), respectively. The longitude and latitude coordinates of each point in the route list are (120.407077E, 30.318696N), (120.406933E, 30.318383N), and (120.406787E, 30.318064N), respectively. The error of the UAV passing through each point is 0.31, 0.36, and 0.22 m, respectively. Therefore, it can be seen that the on-site experimental error can also be maintained below 0.5 m. Subsequently, 100 flight experiments were conducted, and the deviation range of the UAV always remained within 0.5 m.
Verification of tidal bore propagation velocity
To verify the accuracy of the calculation method for the tidal bore propagation velocity in this article, it is necessary to compare the propagation velocity of tidal bore calculated on site with the method proposed in this article. In January 2023, 850 Pantou section of Qiantang River has been selected to conduct a field observation experiment on tidal bore propagation velocity. By observing the time when the tide line reaches each street lamp on the bank and the distance between each street lamp, we can calculate the propagation velocity of the tidal headline.
As shown in Figure 10, the time for the UAV to reach points A, B, C, and D is 16:07:53, 16:08:02, 16:08:21, and 16:08:35, respectively. At this time, the UAV speed displayed on the ground station, which is the propagation velocity of the center point on the tidal headline at that time, is 1.94, 2.22, 2.21, and 2.12 m/s, respectively. The propagation velocity of the tidal headline at each point are calculated based on the distance between each point and their arriving time measured on site. The distances between points A, B, C, and D are 20.17, 41.24, and 29.83 m, respectively. The time intervals between points A, B, C, and D are 9, 19, and 14 s, respectively. Based on the above data, it can be concluded that the calculation formulas equations (13)–(15) for the propagation velocity of the tidal headline from point A to point D are:
After comparison, the actual propagation velocity of the tidal bore calculated on site is basically consistent with the results calculated by the algorithm proposed in this article. And then the tidal bore propagation velocity at other points were calculated using the same method, which are as shown in Table 1.
Records of the datasets.
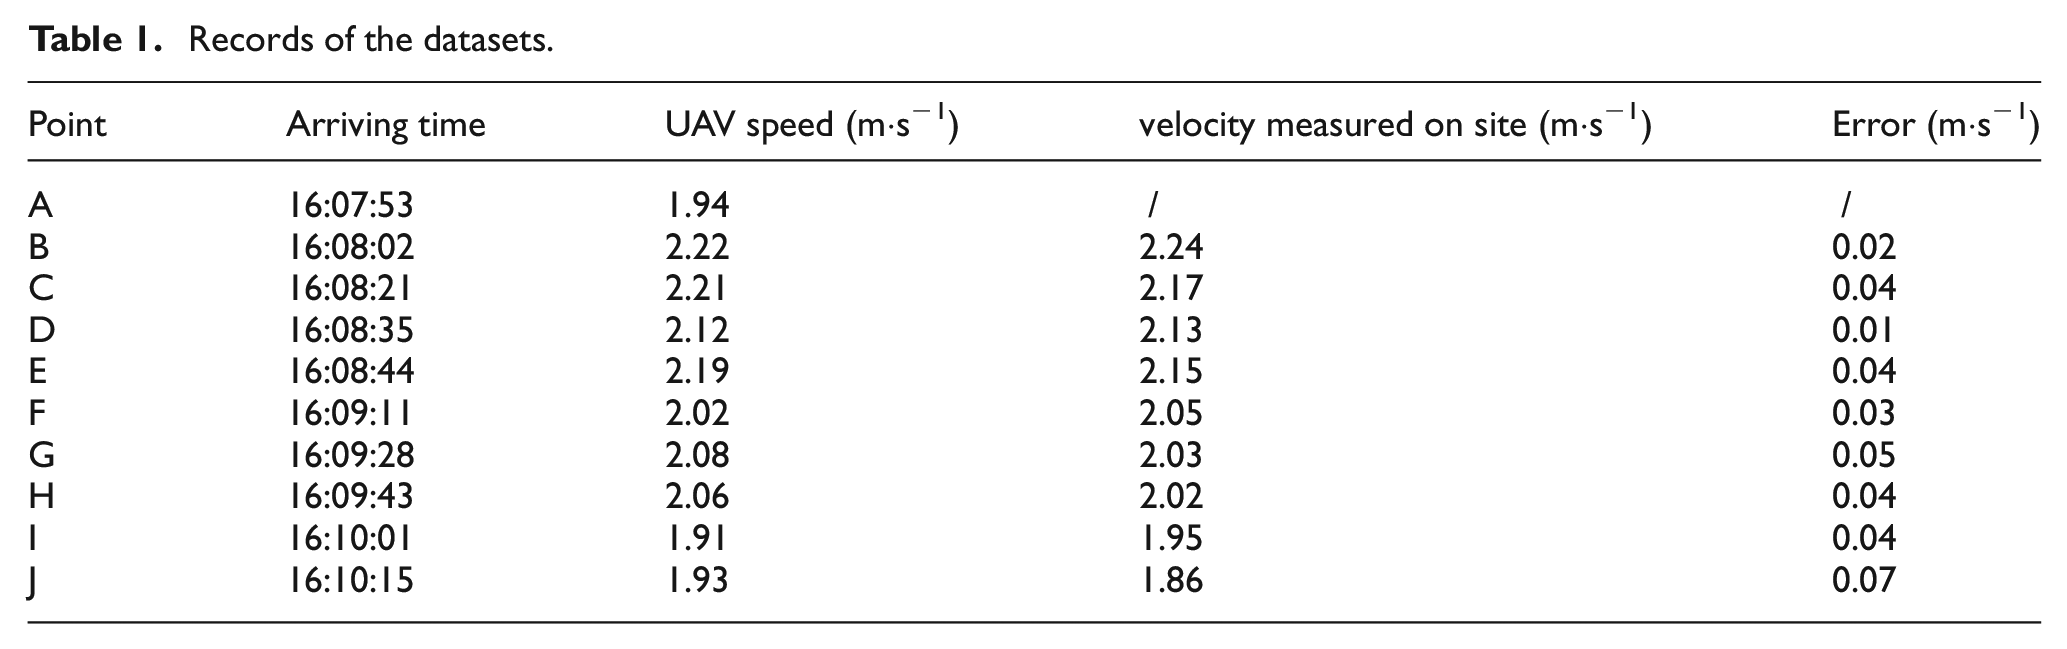
The datasets mainly include information about each point, the arriving time of the tidal bore, and the current forward speed displayed on the UAV, together with the tidal bore propagation velocity measured on site and errors in Table 1. After recording and analyzing the above 10 sets of point data, it can be seen that the data obtained through the algorithm in this paper can achieve a good match with the measured data. According to the final errors, the accuracy of the propagation velocity obtained through the algorithm in this paper can be guaranteed within 0.1 m/s.
Conclusions
This article proposes a method for observing the propagation velocity of tidal bore based on UAV and computer vision, which combines the strong maneuverability of UAV and the large detection range of computer vision to complete the identification and tracking of tidal headline. At the same time, the propagation velocity of tidal headline at different points can be obtained, which can complete the observation of tidal bore propagation velocity in a large scale, solving the low accuracy and complex operations and range limitations of traditional tidal bore observation methods
(1) This article uses Sobel edge detection, improved Otsu image segmentation algorithm, and edge connection algorithm based on region growth to complete the detection of tidal headlines. This method can effectively avoid the interference of river surface waves and water ripples to achieve accurate identification of tidal headlines, effectively solving the problem of discontinuous tidal headlines caused by unclear local changes, and laying the foundation for real-time tracking of tidal bore by UAV. The experiment shows that the recognition accuracy of the proposed algorithm for tidal headline in this paper reaches 91%.
(2) This article proposes an automatic identification and tracking method for the tidal headline by UAV. This method can effectively reduce the occurrence of UAV deviation from the route by controlling the roll angle and yaw angle in real-time. The real-time recognition results of the tidal headline are used to control the forward speed of the UAV, ultimately achieving stable tracking of the tidal bore on the specified route. The experiment shows that the position deviation of the proposed unmanned aerial vehicle during automatic tracking flight can be maintained within 0.5 m.
(3) This article validates the algorithm based on on-site experiments, recording the propagation velocity of tidal headlines over a large scale and during continuous time. By comparing it with the propagation velocity of tidal headlines calculated on site, it shows that the error between the results obtained by the proposed tidal bore propagation velocity observation method and the results calculated on site remains within 0.1 m/s, fully verifying the accuracy of the algorithm.
Footnotes
Declaration of conflicting interests
The author(s) declared no potential conflicts of interest with respect to the research, authorship, and/or publication of this article.
Funding
The author(s) disclosed receipt of the following financial support for the research, authorship, and/or publication of this article: This research was funded by “Zhejiang Provincial Philosophy and Social Sciences Planning Project (24NDJC293YBM),” “Major Humanities and Social Sciences Research Program of Colleges and Universities in Zhejiang (2021QN053)”.
Data availability statement
Data sharing not applicable to this article as no datasets were generated or analyzed during the current study.