
Abstract
Both the bushing installation angle and bushing stiffness of torsion beam suspension have important and complex effects on suspension characteristics and vehicle handling stability. For improving the vehicle handling stability by optimizing the two, this paper systematically analyzes the influence mechanism of the bushing installation angle and bushing stiffness of the torsion beam suspension on the suspension C characteristic. The nonlinear relationship between the bushing installation angle and the steady-state characteristics index in the local design space is discussed. The influence mechanism of the bushing installation angle and bushing stiffness on the frequency response characteristics is deeply analyzed, the variation relationship of the frequency characteristic index at the low frequency of 0.5 Hz under different bushing installation angles and bushing stiffnesses is obtained. Finally, the bushing stiffness, which has a great influence on the frequency characteristics, and the bushing installation angle are taken as the optimization variables, and the frequency characteristic index is taken as the optimization goal, and the multi-objective collaborative optimization of the frequency characteristic is carried out with the help of genetic algorithm. From the comparative analysis of transient and steady-state characteristics before and after optimization, it can be seen the vehicle handling stability has been improved.
Keywords
Introduction
In recent years, a kind of suspension between independent suspension and semi-independent suspension, namely torsion beam suspension, has the characteristics of simple structure, low manufacturing cost, and installation on the vehicle body. And then it is widely used in the rear suspension system of miniature and medium-sized cars. Although the torsion beam suspension structure is simple, many factors such as opening direction, bushing installation angle and bushing stiffness, cross-beam section shape, etc. will affect the suspension characteristics and vehicle handling stability.1,2 In the design stage, if the above design parameters are different, the performance of the suspension and vehicle performance will also be different. At present, there are few systematic studies on the effects of torsion beam suspension bushing installation angle and bushing stiffness on suspension and vehicle performance. In addition, the bushing is an important bearing component of the suspension. The research on the bushing installation angle and bushing stiffness belongs to an important branch of the automotive field and is of great significance.3,4
Until now, numerous scholars have executed lots of research on the rubber bushing of various suspension. Aydemir et al. 5 put forward a simplified frequency-dependent transfer function model to overcome the problem of lower accuracy due to limitations in representing the frequency-dependent dynamic characteristics of vibration isolators. The proposed method is validated on centain heavy commercial truck, and the proposed model was more accurate than that modeled by Voigt. Khaknejad et al. 6 optimized the installation angle and stiffness of the rubber bushing on the vehicle, improved the toe-in stiffness, and improved the handling stability of the vehicle through an example. In order to overcome the trade-off between handling stability and ride comfort in passenger cars equipped with traditional suspension, Qi et al. 7 created a new suspension configuration and compared it with the conventional suspension. The test results showed that vehicles equipped with hydraulic interconnected suspension and electronically controlled air springs can achieve higher performance in the light of handling stability and ride better comfort. Dzierzek 8 put forward an experimental model, which can simulate the damping and stiffness characteristics of the bushing well, and can be easily applied to the ADAMS model, but this model was limited to describing the axial and radial characteristics of the bushing. However, the torsion and swing characteristics of the bushing were invalid, and the coupling effect of the force in all directions of the rubber bushing was not considered. OK et al. 9 analyzed the bushing characteristics under various excitation conditions, and established a new nonlinear bushing characteristic coupling model using the Bouc-Wen hysteresis model. The results showed that the bushing force is well matched with the test, and the established model can be used in vehicle dynamics simulation. Fichera et al. 10 calculated and analyzed the compliance characteristics of the suspension including the mechanical properties of the bushing, and predicted and evaluated the effect of the rubber bushing on the NVH performance of the vehicle. The simulation results of the linear flexible body multi-body dynamic model and the nonlinear model are analyzed and compared, and the effects of different bushing stiffness characteristics on the performance of the suspension are explored. By view of on the quasi-static test results, Gracia et al. 11 used an optimization algorithm to fit the model parameters required for the finite element calculation, and used the ABAQUS software to embed the Yeoh hyperelastic model and the multi-segment linear stress-strain elastic-plastic model into the cylindrical rubber lining set of finite element models, and the curve of reaction force and displacement of the action point of the rubber part was calculated. Wollscheid et al. 12 took carbon black filled rubber vibration isolators as the research object, built a model in the pre-deformed elastic rubber material based on the storage modulus and loss modulus, and obtained the preload dependence and frequency dependence through static and dynamic of the test. The constitutive parameters required by the finite element calculation were identified by the optimization of the least squares method. The numerical simulation results show that it can describe the pre-deformation and frequency dependence of the vibration isolator well. Khajehsaeid et al. 13 established a hyperelastic-viscoelastic model of rubber bushing by view of on the VUMAT subroutine method of ABAQUS software, and calculated three working conditions of axial, torsional, and axial torsion. The calculation results showed the hyperelastic-viscoelastic model can not only accurately calculate the unidirectional condition, but also can better predict the coupled condition of the torsional axial direction. Liu et al. 14 established a dynamic mechanical model of rubber bushing by view of the principle of mesh superposition. The model includes a hyperelastic model, a viscoelastic model and a friction model. And through the user-defined program interface of SIMPACK software, the nonlinear dynamic characteristics such as superelasticity, viscoelasticity, and friction characteristics of the bushing were considered in detail.
The above scholars have executed research on the rubber bushing from various thinking angles, yet have not systematically explored the influence mechanism of the bushing installation angle and bushing stiffness of the torsion beam suspension on the C characteristics; The influence mechanism of the bushing installation angle and bushing stiffness of the torsion beam suspension on the frequency characteristics has not been deeply analyzed. Regarding the collaborative optimization of the bushing installation angle and bushing stiffness and the frequency response characteristics of the vehicle, there is no research in this area yet.
In view of the issues that have not yet been discussed, this paper explores the following four aspects: (1) The influence mechanism of the bushing installation angle and bushing stiffness of the torsion beam suspension on the C characteristics is analyzed in detail; (2) The influence mechanism of the bushing installation angle and bushing stiffness of the torsion beam suspension on the frequency response characteristics is revealed in depth; (3) The evaluation indexes of steady-state and transient handling stability are determined, the nonlinear relationship between the bushing installation angle within a certain range and the steady-state handling stability index is obtained. Meanwhile, The variation law of the frequency characteristic index under different bushing installation angles and bushing stiffness when the low frequency is around 0.5 Hz; (4) Taking the frequency characteristic index at 0.5 Hz as the optimization target, and the bushing stiffness, which has a great influence on the frequency characteristics, and the bushing installation angle are taken as the optimization variables, the multi-objective collaborative optimization is carried out, so as to improve the handing stability of vehicle.
Establishment of torsion beam suspension model
During the movement of the torsion beam suspension, the torsion beam will deform, so a flexible body is needed to establish the model. 10 First, the neutral file MNF of the flexible body of the torsion beam needs to be generated by the finite element software, and then the central file MNF is imported into the ADAMS multi-body dynamics software, so as to establish a rigid-flexible coupled multi-body dynamic model of the torsion beam suspension in Figure 1.
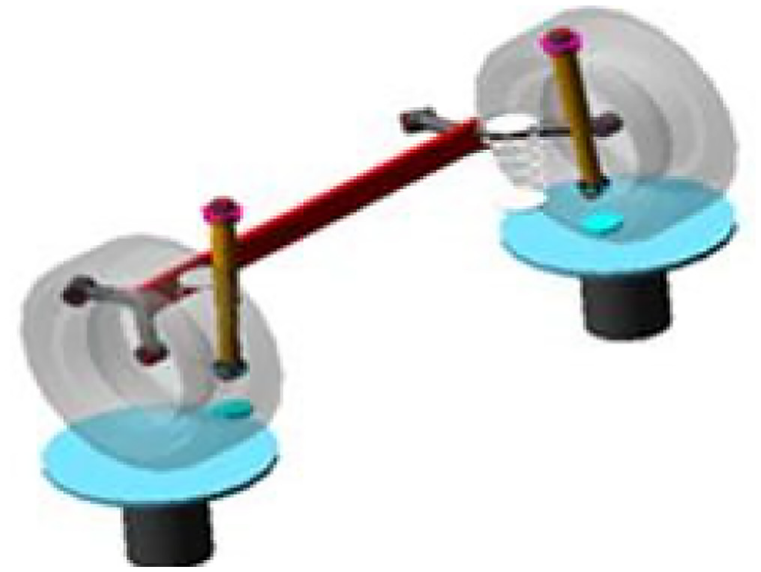
Multibody dynamic model of torsion beam rear suspension.
The rubber bushing commonly used in suspension is composed of an intermediate rubber body and inner and outer metal sleeves. The rubber bushing is used as the connecting part of the two objects. By view of the relative displacement of the two objects at the connection point, the bushing model applies elastic force and damping force in six directions to the two objects. Therefore, the mechanical properties modeling of the bushing generally considers the stiffness properties in six directions, and the force during the working process is more complicated, which transmits three axial forces and three torsional moments between the body and the guide mechanism.
As shown in Figure 2, the modeling coordinate system takes the axial direction as the z-axis, and the two radial directions as the x-axis and the y-axis. Under the action of the six component forces, deformation in six directions will occur, and correspondingly there are stiffness in six directions. In Figure 2,

Schematic diagram of the force of the rubber bushing.
Figure 3 is schematic diagram of the installation angle of the rubber bushing. The bushing installation angle refers to the acute angle formed by the axial direction of the bushing and the axis of the torsion beam, and the bushing installation angle in the initial state of the suspension modeling is −24.5°. In Figure 3,

Schematic diagram of bushing installation angle.
Calculation of roll stiffness of torsion beam suspension
The roll stiffness of the torsion beam suspension is mainly constitute of the roll stiffness contributed by the spring and the roll stiffness contributed by the torsion beam. So order to calculate the equivalent roll stiffness contributed by the torsion beam, it is necessary to first derive the torsion stiffness of the torsion beam.
Derivation of torsion stiffness of beam
Usually the stiffness of the trailing arm of the torsion beam suspension is much larger than that of the beam, so this paper mainly considers the torsion stiffness of the beam and the radial stiffness and axial stiffness of the bushing, ignoring the torsion stiffness of the trailing arm, so as to reflect the suspension deformation under various forces.
A pair of equal and opposite moments (torques) are applied to both ends of the beam member, and the torsion stiffness of the beam is defined as:

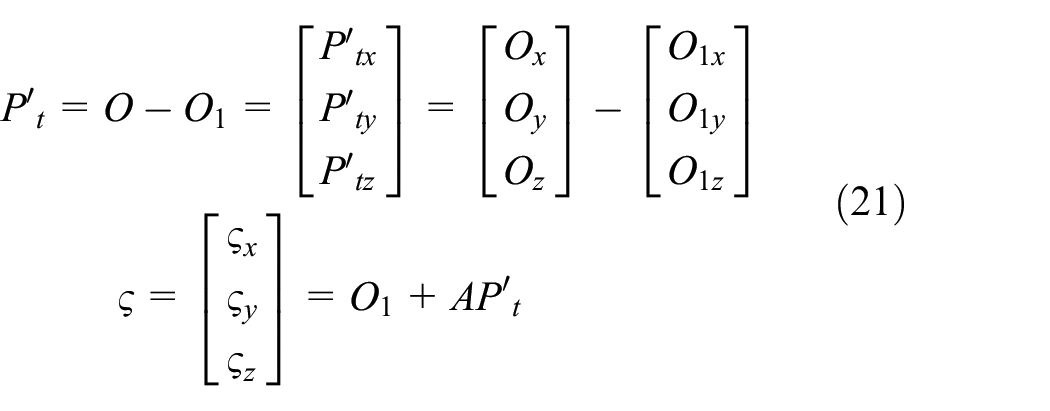
Where,
The V-section beam is a thin-walled member with a non-circular section opening, and the left and right ends are welded on the longitudinal arm. Therefore, the warping freedom of the beam is constrained when the beam is twisted, and the torsion stiffness of the beam is only calculated by the theory of restrained torsion. Before using the constrained torsion initial parameter solution method, the constrained torsion coefficient

Among them, the converted elastic modulus:
In equation (2):
Therefore, to obtain the constraint torsion coefficient
Since the beam is a symmetric section, the section intersects with the symmetry axis


Schematic diagram of the solution of the pole of the main sector.
The distance

The main sectoral moment of inertia

The intersection point

The distance

The main sectoral moment
The main sectoral moment

The moment of inertia of the entire section with respect to the z-axis is:

The value of

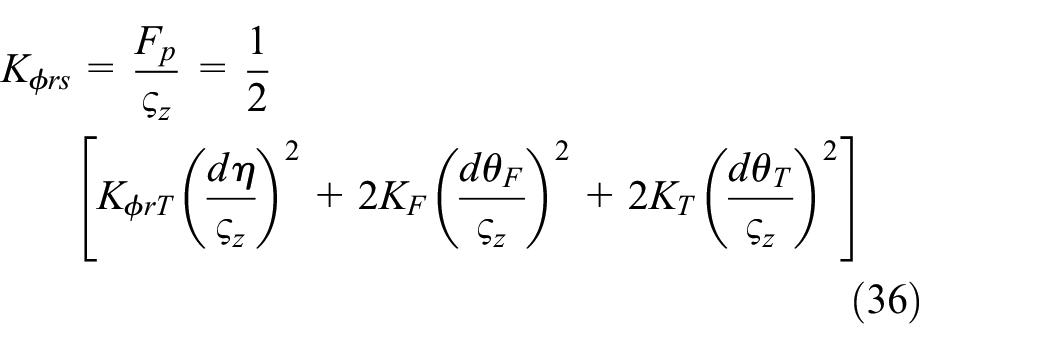
Schematic diagram of the solution of the moment of inertia of the main sector.
After determining the poles and zeros of the main sector, the main sector area

Then the main sector moment

Analyzing the rectangular part, the main sector area

Then the main sector moment

Then the main sectoral moment

After obtaining
When
According to the constraint torsion equation, so there is:

In equation (18):
According to the above equation, it is easy to solve:

Therefore, the torsion stiffness

Calculation of the torsion angle of the beam
From the equation (1) in Section 3.1, it can be seen that in order to obtain the torsion stiffness of the beam, the torsion angle of the beam needs to be deduced. The motion of the wheel of the torsion beam suspension is equivalent to swing motion of the rotation axis with the line vector connecting the body connection point

Equivalent kinematics model.
Before calculating the torsion angle of the beam, an initial vector


From the same reasoning above, it can be seen that in the reverse travel, the wheels on both sides are equivalent to the line vector

The Euler four-element vector is:
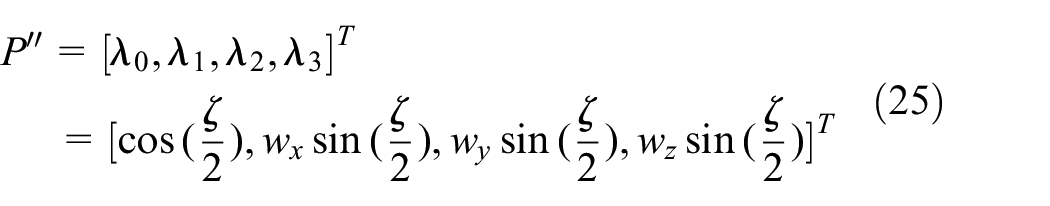
In equation (25),
The change matrix

Therefore, when the wheel on one side of the torsion beam suspension travels up by angle

A vertical unit vector is defined as

Combining the above equation and the geometric relationship in Figure 7, the torsion angle of the beam can be obtained:


Schematic diagram of the geometric relationship of the torsion angle of the beam.
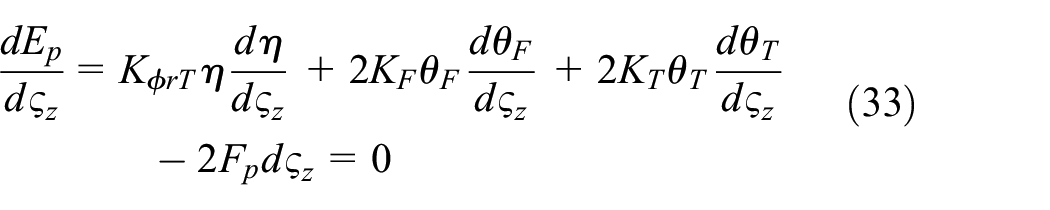
Calculation of the roll stiffness of the suspension
When the wheels on both sides bounce in the opposite direction, it is equivalent to have two forces with the same amplitude but opposite directions acting on the center point of the wheels. The energy generated is mainly absorbed by the deformation of the beam and the bushing, and since the stiffness of the trailing arm is much larger than the rest of the components, the deformation of the trailing arm can be ignored. Typically, rubber bushings have stiffness in six directions and are mounted on the body at an angle to increase the understeer tendency in Figures 2 and 3.
When considering the effect of the rubber bushing on the roll stiffness of the suspension, it is assumed that the torsion angle

Assuming that the external force acting on the wheel center is

Where,
In the initial state,
When the wheel travel is not large, the torsion angle of the beam and the rubber bushing is still in the linear range, that is:

The angle of rotation of the rubber bushing around the axial direction

Combining equations (30)–(35), the equivalent spring stiffness
where
Therefore, the roll stiffness

Bushing installation angle and bushing stiffness on suspension C characteristics
The C characteristic of the suspension, namely compliance kinematics characteristic, describes the change of the wheel alignment parameters caused by the deformation of the bushing and the connection point of the suspension in the process of transmitting the force and moment of the suspension. The suspension simulation analysis of the established torsion beam suspension is carried out, and the relationship between the toe angle and the roll stiffness under the action of lateral force under different bushing installation angles is obtained as shown in Figure 8.
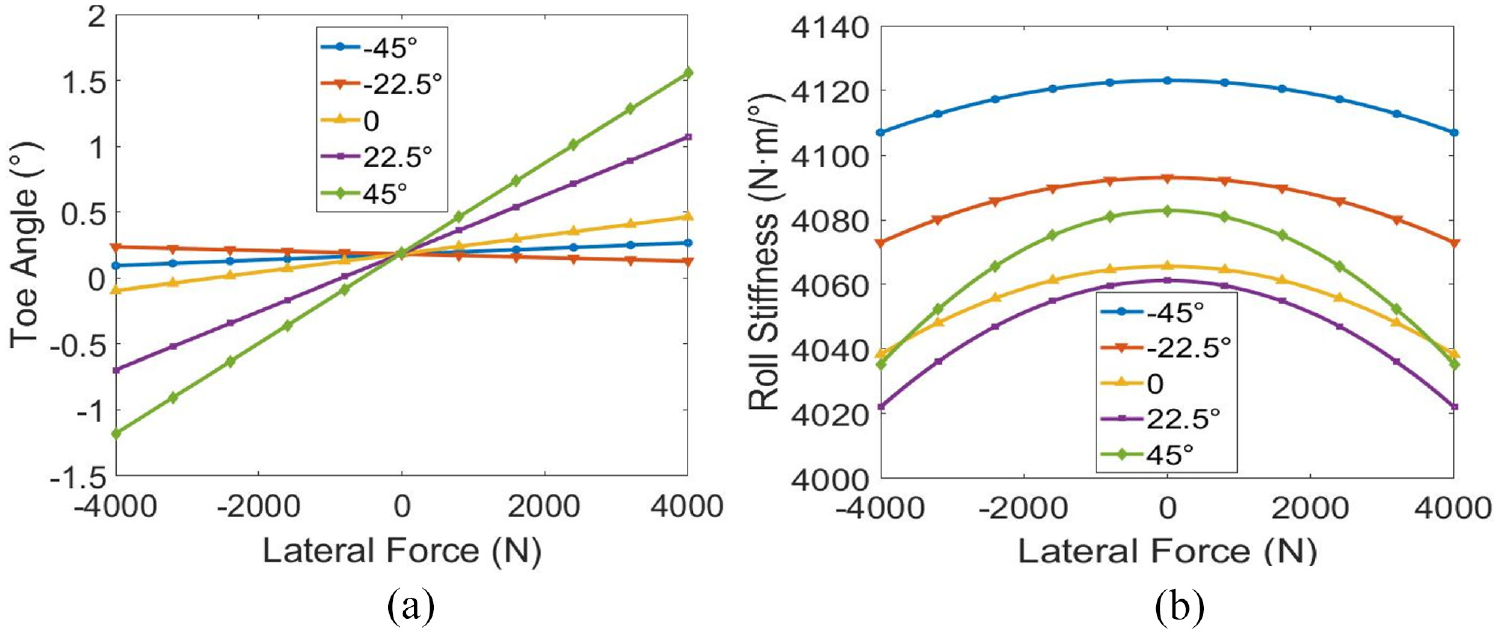
Influence of different bushing installation angles on suspension characteristics under lateral force conditions: (a) influence on the toe angle and (b) influence on the roll stiffness.
Under the lateral force condition of the torsion beam, the axle steering will occur, and the axle steering is mainly caused by the deformation of the rubber bushing at the connection between the trailing arm and the body, thus causing the C characteristics of the suspension to change, which in turn has a major impact on the handing stability of the rear axle. The change in toe angle due to bushing deformation under lateral force can be decomposed into the following two effects:
Due to the axial translation stiffness of the bushing, when a lateral force acts, the connection point between the torsion beam and the body moves in series along the bushing axis, resulting in a certain understeer of the rear axle. The lower the axial stiffness of the bushing, the more obvious the tendency of understeering.
Due to the radial translation stiffness of the bushing, when a lateral force acts, the connection point between the torsion beam and the body is compressed along the radial direction of the bushing, resulting in a certain understeer of the rear axle. The lower the axial stiffness of the bushing, the more obvious the tendency of oversteer.
In order to ensure the vehicle has better handling stability characteristics, when the rear suspension moves under lateral force conditions, the rear suspension should produce a change direction of the toe angle in the same direction as the lateral force, that is, appropriate understeer characteristics, which is called follow-up steering. 18 Therefore, the change gradient of the toe angle should be positive, that is, the slope of the curve is positive.
Usually for the rear suspension, if the change gradient of the toe angle is positive, it means that when the body rolls, the toe angle of the outer wheel increases, the wheel turns inward, the toe angle of the inner wheel decreases, and the wheel turns outward, then will beneficial to understeer. Conversely, if the change gradient of the toe angle is negative, it will be unfavorable for understeer.
It can be seen from Figure 8(a) that when the lateral force changes from −4000 N to 4000 N, when the bushing installation angle is within [−45°−45°], the toe angle changes regardless of whether the angle changes from small to large or from large to small, the change gradient of the toe angle is positive, which is conducive to understeer. It can be seen that it is consistent with the above analysis theory.
It can be known from equation (35) when the bushing installation angle changes (the torsion angle
Sensitivity analysis of influence of bushing stiffness on suspension characteristic index
Sensitivity analysis refers to the response quantity of the system dynamic change caused by the parameter change, that is, the influence of the parameter change on the time response, state vector, transfer function or other dynamic performance of the system. Since the suspension model is left and right symmetrical, the influence laws of the bushings on both sides are exactly the same. Therefore, the stiffness in six directions of the rubber bushing at the connection between the trailing arm and the vehicle body on one side of the model is used as the design variable to analyze the influence on the suspension characteristic index, and the sensitivity analysis results shown in Table 1 are obtained. Among them, the bushing stiffness in six directions is recorded as DV1-DV6 in turn, and the positive and negative signs of the sensitivity value indicate the changes of each variable and the performance index of the suspension are the same or opposite. The change gradient refers to the slope of the curve of the suspension performance index changing with the lateral force when the lateral force is [−4000 N, 4000 N].
Sensitivity analysis results of bushing stiffness.

From Table 1, the bushing stiffness in different directions that are most sensitive to the suspension characteristics can be screened out. According to the experience of engineering design, the bushing stiffness is reduced or increased to 10% or 20% of the initial value, respectively, and then the suspension simulation is carried out, and the relationship between the suspension characteristic index and the lateral force is obtained, as shown in Figure 9.

Influence of different bushing stiffnesses on suspension characteristics under lateral force conditions: (a) influence on the toe angle, (b) influence on camber angle, (c) influence on the roll center height, and (d) influence on roll stiffness.
Under the force of the wheel, the bushing will be deformed, and the deformation of the bushing will lead to the change of the wheel alignment parameters, which will eventually affect the C characteristics of the suspension, resulting in the change relationship shown in Figure 9. It can be seen from Figure 9 that when the wheel is under the action of lateral force, the bush stiffness varying in the range of [−20%, 20%] has obvious effects on the wheel toe angle, camber angle, suspension roll center height, and roll stiffness.
Establishment of theoretical model of handling stability considering suspension roll
Figure 10 shows the established vehicle handling dynamics model,

Three-degree-of-freedom manipulation model.
The magnitude of the absolute acceleration

In equation (38), the velocity at the center of mass
The direction of the acceleration vector

where

In equation (40),
The component

In equation (41),
The balance equation for the lateral force is:

In equation (42),
The balance equation for the moment about the z-axis is:
In equation (43),
The balance equation for the moment about the x-axis is:

In equation (44),
The side slip angles


In equations (45) and (46),
The relationship between the roll steering angle
In equation (47),
Supposing that the camber angle caused by the body roll is proportional to the body roll angle, the camber thrusts

In equation (48),
Considering the roll steering and roll camber of the suspension, and combining equations (45)–(48), the tire lateral forces

In equation (49),
When the vehicle rolls, the front and rear wheels will produce corresponding slip angles due to the roll of the vehicle, which are denoted as
Side slip angle of front wheel:

Side slip angle of rear wheel:
Among them,
Equations (45) and (46) can calculate the roll steering angle and camber thrust, and after sorting out equations (42)–(44), the 3-DOF dynamic equations can be obtained as follows:


In equations (52)–(54), there is:

Then the Laplace change is performed on the equations (52)–(54), and the state equation system after the Laplace change can be obtained, and then the transfer function of the corresponding response indexes relative to the steering wheel angle can be obtained, and then then let
Based on the above theories, it can be concluded that the influence mechanism of the bushing installation angle and bushing stiffness of the torsion beam suspension on the frequency response characteristics is as follows:
The difference in the bushing installation angle will affect the roll stiffness of the suspension, which in turn affects the roll stiffness of the suspension, thereby affecting the frequency response characteristics.
The camber angle of the front and rear wheels in the above equation (48) and the side slip angles of the front and rear wheels in the equations (50) and (51) only take into account the additional turning angle due to the suspension movement. Only the additional turning angle due to the suspension movement is considered, and the influence of the deformation of the suspension bushing, etc. on the side slip angle and camber angle of the front and rear wheels is not considered. It can be seen from the above analysis that when the bushing installation angle and the bushing stiffness are different, the C characteristics of the suspension will change, which will affect the side slip stiffness of the front and rear tires
Bushing installation angle on steady-state and transient handing stability of vehicle
The vehicle multi-body dynamics model of the front McPherson suspension and the rear torsion beam suspension is established from a real vehicle parameter. The parameters of the established vehicle model in Table 2.
Vehicle parameters.

Analysis of transient handing stability index
The indicators of transient handing stability include yaw rate gain, roll angle gain, delay time of yaw rate (DT2), and delay time of lateral acceleration (DT1).
Among then, the yaw rate gain refers to the gain value of the yaw rate relative to the steering wheel angle, and the roll angle gain refers to the gain value of the roll angle relative to the lateral acceleration. The delay time of the yaw rate refers to the delay time of the yaw rate relative to the lateral acceleration, and the delay time of the lateral acceleration refers to the delay time of the lateral acceleration relative to the steering wheel angle. The resonance frequency refers to the frequency corresponding to maximum gain of yaw rate relative to steering wheel angle.
Figure 11(a) is the curve of the yaw rate gain. In Figure 11(a), when the low frequency is around 0.5 Hz, the change of the bushing installation angle has a significant impact on the yaw rate gain. The gain value does not change according to a certain law with the change of the bushing installation angle. Generally, the driver’s frequency does not exceed 1 Hz when manipulating the vehicle, therefore the transient stability index changes at the high frequencies are not considered for the time being.

Influence of bushing installation angle on transient handing stability:(a) Influence on yaw rate gain, (b) Influence on roll angle gain, (c) Influence on the delay time of lateral acceleration, (d) Influence on delay time on yaw rate.
Figure 11(b) is the curve of the roll angle gain. In Figure 11(b), when the low frequency is around 0.5 Hz, the change of the bushing installation angle has little effect on the roll angle gain. The gain value does not show a certain regular change with the change of the bushing installation angle.
Figure 11(c) and (d) are curves of delay time of lateral acceleration and delay time of yaw rate. In Figure 11(c) and (d), when the low frequency is around 0.5 Hz, the change of the bushing installation angle has a significant impact on the delay time of lateral acceleration and the delay time of yaw rate. The delay time does not change according to a certain law with the change of the bushing installation angle.
Analysis of index of steady-state handing stability
Steady-state characteristic analysis adopts the constant radius cornering simulation, and the variation of steady-state handling index with bushing installation angle in the range of [−90° to 90°] is obtained through simulation calculation in Figure 12. The steady-state handling stability indicators include: maximum lateral acceleration, understeer, the side slip angle of lateral acceleration at 0.7g, and steering wheel angle of lateral acceleration at 0.7g.

Influence of bushing installation angle on steady-state handling index: (a) influence on the maximum lateral acceleration, (b) influence on understeer, (c) influence on the side slip angle, and (d) influence on steering wheel angle.
The maximum lateral acceleration and the steering wheel angle of the lateral acceleration at 0.7g can be obtained from the slope of the curve of the steering wheel angle relative to the lateral acceleration; Understeer refers to the steering wheel angle of lateral acceleration at 0.4g, which can be obtained from the slope of the curve of the steering wheel angle relative to the lateral acceleration at 0.4g; The side slip angle of lateral acceleration at 0.7g can be obtained from the slope of the curve of the side slip angle of lateral acceleration at 0.7g.
In Figure 12(a), the maximum lateral acceleration generally shows a trend of first decreasing, then increasing, then decreasing and finally increasing with the increase of the bushing opening angle; In Figure 12(b) and (d), the understeer and the steering wheel angle of lateral acceleration shows a trend of first decreasing and then increasing with the increase of the bushing opening angle at 0.7g generally first decreases and then increases with the increase of the bushing opening angle. In Figure 12(c), the side slip angle of the lateral acceleration at 0.7g generally In addition, in Figure 10, when the bushing installation angle is around −22.5°, the understeer of the vehicle and the steering wheel angle of the lateral acceleration at 0.7g reach the maximum, while the maximum lateral acceleration and side slip angle of lateral acceleration at 0.7g reach the minimum, indicating that the understeering characteristics of the vehicle are the best, and the steady-state performance is optimal near this range.
It can be seen from the above analysis that when the wheel is subjected to external force, the bushing is deformed, which in turn affects the C characteristics of the suspension, which further affects the steady-state performance index of the vehicle, and finally affects the steady-state performance of the vehicle.
Collaborative optimization of bushing stiffness and bushing installation angle
Firstly, the sensitivity analysis of the handling stability of the vehicle is executed by taking the rubber bushing at the connection between the trailing arm and the body as the object of sensitivity analysis. The importance of each objective is comprehensively weighed and the bushing stiffness that has a greater impact on the frequency characteristics is screened out. The sensitivity analysis results are in Table 3. It can be known the radial stiffness of the bushing in the x- and z-direction is more sensitive
Sensitivity analysis results of handing stability.

In addition, the swept-sine input simulation test is carried out on the whole vehicle, and the influence of the change of the bushing stiffness on the frequency response characteristics is obtained. Through the analysis, it is known the bushing stiffness that changes in the range of [−20%, 20%] has little effect on the frequency characteristics of the vehicle when the low frequency is around 0.5 Hz. This paper gives the effect of the change of bushing stiffness on the delay time of lateral acceleration in Figure 13. It can be seen from Figure 13 that the bushing stiffness varying in the range of [−20%, 20%] has little effect on the lateral acceleration delay time at low frequencies around 0.5 Hz, and the absolute value of the delay time of the lateral acceleration at 0.5 Hz gradually decreases as the bushing stiffness changes from large to small.
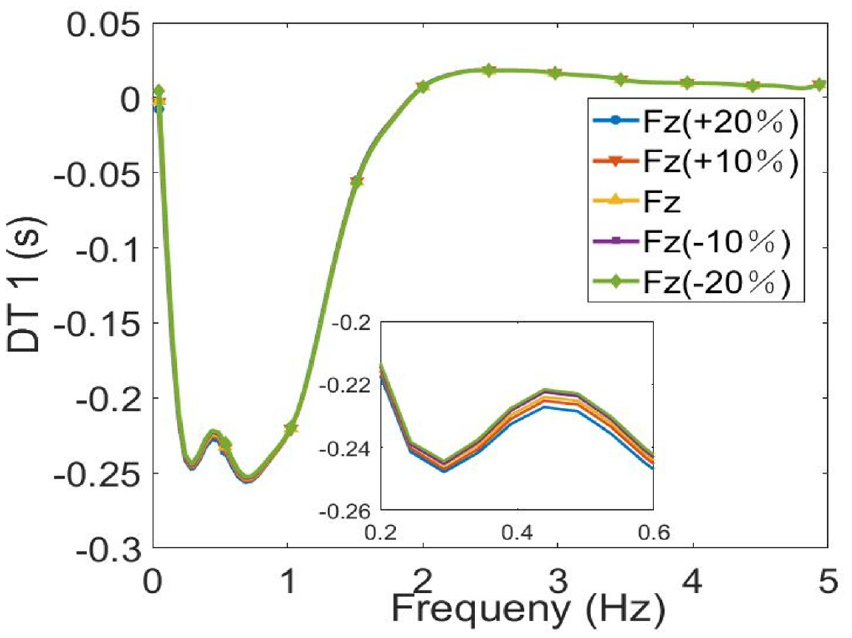
Effect of variation in bushing stiffness on delay time of lateral acceleration.
According to the results of sensitivity analysis, the stiffness in the direction with higher sensitivity of the bushing at the connection between the suspension trailing arm and the body and the bushing installation angle are taken as optimization variables, and generally the frequency of the driver steering the steering wheel is about 0.5 Hz, so the frequency characteristic index of the whole vehicle at 0.5 Hz is taken as the optimization target (Gain and delay time at 0.5 Hz) and the multi-objective optimization of the frequency characteristics is carried out through the genetic algorithm.
From the following description of formula (55), it can be known that the transfer function of the frequency characteristic index of the vehicle can be obtained from the equations (52)–(54), and make
In equation (56),
Therefore, the mathematical expression of the optimization objective can be expressed as follows:

In equation (57),
The constraints are as follows:

In equation (58),
In this paper, the non-dominated sorting genetic algorithm NSGA-II is used to solve the constrained multi-objective optimization problem. 20 The algorithm is an improved multi-objective algorithm based on the NSGA algorithm. The algorithm introduces fast non-dominated sorting, crowding, and elite strategies. Through fast non-dominated sorting, the complexity of computing sorting is effectively reduced; The crowding degree and the comparison factor are introduced as the comparison criteria of the individuals in the population to ensure the diversity of the population; Compared with other genetic algorithms, it has better convergence and robustness, and has a good optimization effect on multi-objective optimization problems; The elite strategy is introduced to expand the sampling space, improve the global search ability, and the accuracy of optimization results.
The crossover operation and sudden mutation operation between individuals in the NSGA-II algorithm use the SBX method, and then generate sub-individuals according to this method. Formula (59) is the crossover calculation formula:

where,
And the mutation operation in generating sub-individuals according to the SBX method is:


where,
After optimization, the iterative process of the optimization objective shown in Figure 14 and the Pareto solution set of the frequency characteristic index in Figure 15 are obtained. The abscissa in Figure 14 refers to the number of swept-sine input simulation. It is obvious that through the optimization process, the vehicle has undergone 240 times to obtain the optimal optimization scheme.

Iterative diagram of the optimization objective: (a) iterative graph of yaw rate gain at 0.5 Hz, (b) iterative graph of roll gain at 0.5 Hz, (c) iterative graph of resonant frequency at 0.5 Hz, (d) iterative graph of resonant frequency at 0.5 Hz, and (e) iterative graph of delay time for lateral acceleration at 0.5 Hz.

Pareto solution set of frequency characteristic index: (a) pareto solution set of yaw rate gain relative to roll angle gain and (b) pareto solution of the delay time of lateral acceleration relative to the delay time of yaw rate.
Generally, in order to make the vehicle achieve better frequency characteristics, the optimization objective should show the following changes during optimization: That is, the smaller the gain of the yaw rate within a certain range, the more favorable it is to improve the handling stability; The smaller the roll angle gain within a certain range, the better the roll stability; The smaller the delay time of lateral acceleration and the delay time of yaw rate within a certain range, the faster the vehicle reaction speed and the better the handling stability; The larger the resonance frequency within a certain range, the more stable the whole vehicle is. In addition, each optimization objective should gradually converge toward the optimization direction and finally reach a stable state.
Figure 14 is the optimization iteration diagram of the yaw rate gain at 0.5 Hz, the roll angle gain at 0.5 Hz, the resonance frequency at 0.5 Hz, the delay time of lateral acceleration at 0.5 Hz, and the delay time of the yaw rate at 0.5 Hz. In Figure 14, with the advancement of the optimization process, the value of yaw rate gain at 0.5 Hz, the value of roll angle gain at 0.5 Hz, the delay time of lateral acceleration at 0.5 Hz and the delay time of yaw rate at 0.5 Hz all show a decreasing trend, and gradually converge in the decreasing direction. However, the resonance frequency at 0.5 Hz generally shows a gradually increasing trend with the advancement of the optimization process, and gradually converges to the increasing direction. It can be seen that each optimization objective conforms to the requirements of the changing trend that the above optimization objectives should meet in the optimization process, which is favorable to improve the handling stability.
After optimization, the corresponding Pareto solution set of the optimization objective is also obtained. Figure 15(a) and (b) show the Pareto solution set of the yaw rate gain at 0.5 Hz and the roll angle gain at 0.5 Hz, the Pareto solution set of lateral acceleration delay time at 0.5 Hz relative to yaw rate delay time at 0.5 Hz respectively.
Comparative analysis before and after optimization
After optimizing the frequency response characteristics, so as to verify whether the optimization results are reliable and effective, the optimal Pareto solution is selected from the Pareto solution set and brought into the established model for simulation and compared with the original car. The following mainly analyzes the transient and steady-state characteristics. Among then, the values of the vehicle transient characteristics before and after optimization are in Table 4.
Comparison between before and after optimization of vehicle transient frequency characteristics.

Analysis of transient characteristics
Figure 16 shows the yaw rate gain before and after optimization. In Figure 16, when the frequency is around 0.5 Hz at low frequency, the optimized yaw rate gain is smaller than that of the original vehicle, and a smaller yaw rate gain within a certain range is beneficial to the handling stability, which meets the changing trend of the optimization target requirements.

Yaw rate gain.
Figure 17 is the roll angle gain before and after optimization. In Figure 17, when the frequency is near the low frequency of 0.5 Hz, the optimized roll angle gain is slightly reduced compared with the original car, and the amount of reduction is small, but it still meets the changing trend of the optimization target requirements.
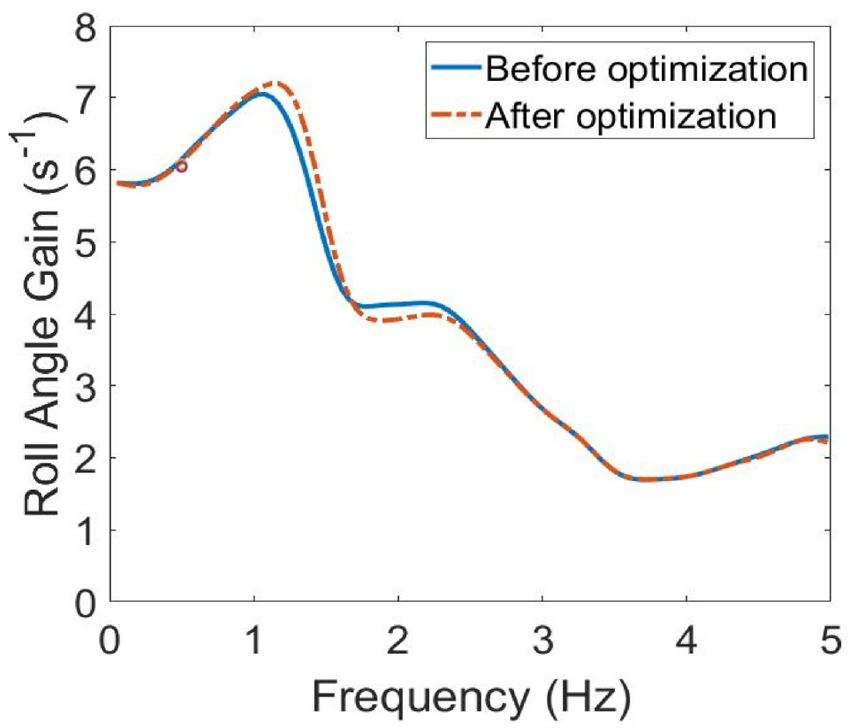
Roll angle gain.
Figures 18 and 19 show the delay time of lateral acceleration and the delay time of yaw rate before and after optimization. When the low frequency is around 0.5 Hz, the absolute value of the delay time of the two is reduced compared with the original car before and after optimization. The smaller the delay time within a certain range, the faster the reaction speed of the vehicle, the more beneficial to the handling stability.

Delay time for lateral acceleration.
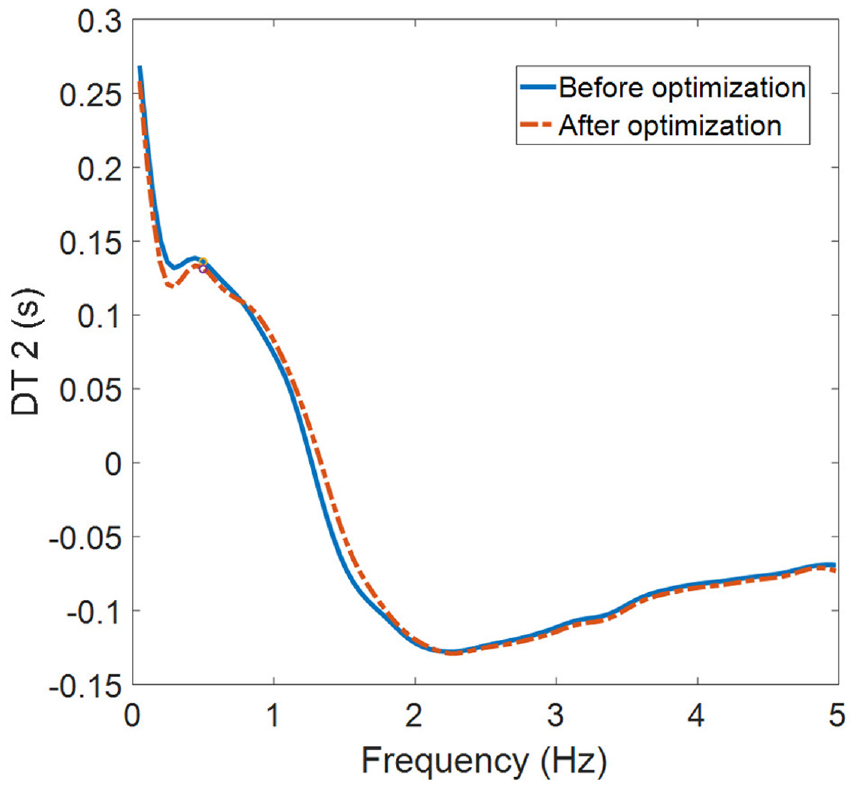
Delay time of yaw rate.
Steady-state characteristic analysis
Steady-state characteristic analysis adopts the constant radius cornering simulation. In Figure 20, The optimized steering wheel angle increases with the increase of lateral acceleration compared with the original car, indicating that the car needs a larger steering wheel angle to maintain the turning radius, and the understeer of the car increases, which is conducive to improving the handling stability.

Variation curve of steering wheel angle relative to lateral acceleration.
Figure 21 shows that the optimized roll angle remains basically unchanged as the lateral acceleration increases compared to the original car. Since it is a multi-objective optimization, it is normal for individual objectives to have no substantial improvement.

Variation curve of roll angle relative to lateral acceleration.
Conclusion
In this paper, the influence mechanism of the bushing installation angle and bushing stiffness of the torsion beam suspension on the C characteristics and the performance of the whole vehicle is analyzed. The frequency characteristic index is derived by view of the equivalent handling stability model, and the influence mechanism of the bushing installation angle and bushing stiffness on the frequency characteristic is revealed. Finally, the multi-variable and multi-objective optimization is executed for the bushing stiffness and bushing installation angle, which are more sensitive to the frequency characteristics. The specific conclusions are as follows:
The relationship between the bushing installation angle and bushing stiffness and the C characteristics of the suspension is analyzed: Under the condition of lateral force, the bushing of the suspension is deformed due to the external force, which leads to the axle steering of the suspension, which further affects the performance of the suspension. In addition, the bushing installation angle and bushing stiffness will affect the roll stiffness and force of the suspension, which will affect the suspension C characteristics, which in turn will affect the steady-state and transient characteristics of the vehicle.
The relationship between the bushing installation angle and the steady-state characteristic index in the range of [−90° to 90°] is discussed, that is: when the bushing installation angle is around −22.5°, the understeer characteristic of vehicle is the best, and the steady-state performance is optimal. The relationship between the change of the bushing installation angle and bushing stiffness and the change of the frequency characteristic index when the low frequency is around 0.5 Hz is obtained, namely: when the low frequency is around 0.5 Hz, the change of the bushing installation angle will have a significant impact on the yaw rate gain, the delay time of lateral acceleration and the delay time of the yaw rate, while the effect on the roll angle gain is small. However, the change of the bushing stiffness has little effect on the various indicators of the frequency characteristics of the vehicle.
The multi-objective optimization is executed on the frequency response characteristic index. After optimization, the optimal Pareto solution is screened out for comparative analysis with the original car. The results show that: When the radial stiffness of the bushing at the connection between the trailing arm and the body is reduced by 83.6% in the x-direction, the axial stiffness in the z-direction is reduced by 95%, and the bushing installation angle is −27.7°, it is concluded that the transient characteristics of the vehicle have been substantially improved. For the steady-state characteristics of the vehicle, the understeer of the vehicle have increased, and the roll angle is basically unchanged compared with the original car.
Footnotes
Handling Editor: Chenhui Liang
Declaration of conflicting interests
The author(s) declared no potential conflicts of interest with respect to the research, authorship, and/or publication of this article.
Funding
The author(s) disclosed receipt of the following financial support for the research, authorship, and/or publication of this article: This project was supported by National Natural Science Foundation of China (NSFC) (No. 51965026). The authors are greatly appreciated for the financial support.