
Abstract
This paper presents research related to the tubular combustion chamber of an expendable turbojet. Although annular combustors are dominant at present, tubular combustors are still attractive because they are simpler to produce and require lower amounts of air flow for testing. The objective of this research was to assess the combustor’s primary zone configuration, and four configurations were tested to obtain experimental answers for use in future work. The configuration of the combustion chamber is a simple and classic design in line with its expendable purpose. The test methodology was to perform initial testing of the primary and secondary zones under atmospheric conditions using the four configurations, and then to subsequently complete the combustor using the best configuration. The complete combustor was then tested under both atmospheric conditions and working conditions. The results showed that the stability margin was wide enough to cover the combustor’s entire working area. The measured efficiency and pressure drop were in very good agreement with the corresponding designed values. The design and testing methodology proposed here could be used for similar scientific and engineering research applications.
Introduction
This work presents an assessment of the primary zone configuration of a tubular combustion chamber for an expendable turbojet. The combustion chamber is the component of a turbojet engine in which the chemical energy of the fuel is transformed into heat. Pressurized air from a compressor is mixed with the fuel and the resulting mixture is burned to produce the hot gases required to power the turbine. Therefore, the combustion chamber must allow this process to proceed with a minimal pressure drop and maximum fuel efficiency. This requirement is expressed through the total pressure drop coefficient: 1

where Pi n and Pex are the total pressures at the combustor’s inlet and exit, respectively, and the coefficient of combustion efficiency is given by: 1

where mfideal and mfreal are the fuel flow rates in the ideal and real cases, respectively.
The combustion chamber must work through an envelope of working conditions and therefore must show good stability. Additionally, it must be possible for the chamber to ignite the fuel-air mixture reliably under various working conditions, which are defined through the typical stability and ignitability margin shown in Figure 1.

Typical combustor stability and ignition map. 1
The labels used in Figure 1 are described as follows. α: excess air coefficient; n: the number of revolutions per minute (rpm) of the engine during operation; nmax: maximum engine rpm; nmin: minimum engine rpm;
The turbine follows after the combustion chamber. Because the temperature at the exit from the combustion chamber is dictated by the turbine, which is designed while assuming a uniform temperature distribution, the combustion chamber must provide the desired temperature and uniformity at its exit. The quality of the temperature profile is estimated to be: 1

In equation (1.3), Tmax is the maximum total temperature at the exit, and Tin and Tex are the average total temperatures at the inlet and the exit, respectively. This equation defines the temperature nonuniformity at the combustion chamber’s exit. The desired value of the parameter Θ is less than 0.2, while the maximum value is 0.3, but because of the expendable nature of the turbojet, a higher value could be considered that depends on the engine lifetime required. In combination with all these demands, the combustion chamber, as with all other elements in a flight engine, must be as small as possible, easy to inspect and maintain, and constructed with appropriate materials and production technologies.
Combustion types and zones
With regard to the chamber construction, there are three types of combustion chamber: tubular, tubular-annular, and annular chambers. Regardless of which one of these chambers is used, the chamber is typically divided into three zones: the primary, secondary, and tertiary or dilution zones. This division is performed because the mixture of air and kerosene fuel required for stable combustion must have an excess air coefficient in the range from α = 0.6–1.7. On the other side of the turbojet engine combustion chamber, the exit temperature is limited by the turbine stresses, and if the uncooled maximum temperature is approximately 1173 K, the corresponding excess air coefficient in this case must have a value of α≈ 3–5.
The primary zone is the zone in which the fuel-to-air mixture is maintained around stoichiometric conditions to achieve good stability and ignitability. This is why it is very important to maintain an appropriate mixture with a typical value of α≈ 0.9–1.1. Because of the intensity of the process in the primary zone, approximately 70% of the fuel is burned within the primary zone. The rest of the fuel should then finish combustion in the secondary zone. Approximately 25% of the total air goes to the primary zone, while the length of this zone is approximately half of the liner diameter in the case of a tubular combustor or half of the liner’s height in the case of an annular combustor. The temperatures in the primary zone are of the order of 2000–2200 K. The designer may select the primary zone mixture ratio according to their specific goals. It is common to define the mixture ratio using the excess air coefficient: 1

where L represents the amount of air required to form a stoichiometric mixture, and ma and mf are the air and fuel mass flow rates, respectively. For the kerosene, gasoline and diesel fuel types, L=14.8. Consequently, if α < 1, then the mixture is rich, if α=1, the mixture is stoichiometric, and if α > 1, then the mixture is lean. In western literature, the so-called equivalence ratio is used instead of α and is defined as the inverse version of α.
The secondary zone follows the primary zone, and the fuel that was not burned in the primary zone should be processed completely in this zone. Approximately 25% of the total air again enters the secondary zone, where the mixture ratio is approximately α≈ 1.5–1.7, and the length is approximately 1.5 times the liner diameter or 1.5 times the liner height. At the end of the secondary zone, the combustion process should then be complete. The secondary zone exit temperature is approximately 1700 K.
The dilution zone serves to maintain the desired turbine inlet temperature with minimum nonuniformity. The approximate length of the dilution zone should be 1.5 times the diameter or 1.5 times the height of the liner.
Fuel that enters the combustion chamber must be vaporized and then mixed with air to enable combustion. Because of this, the fuel is atomized into fine droplets (50–100 μm in size) or pre-vaporized in so-called vaporizers. There are many different atomizer types, but the most popular versions are the pressure swirl and air-blast atomizers.
The pressure swirl atomizer uses the pressure from the fuel installation to force the fuel to swirl and then disintegrate into droplets, while the air-blast atomizer uses the kinetic energy of the air to atomize the fuel.
Because high temperatures occur inside the combustion chamber, specifically in the primary and secondary zones, its walls must be protected. Cooling is generally performed using air. The task in this case is to protect the wall while using the minimum quantity of air from a performance standpoint. Additionally, the technology used to produce the required cooling must be economical and must be based on currently available technology. A typical cooling solution is shown in Figure 2.

Cooling solution: film cooling. 1
Explanation of Figure 2: Cooling air with a flow rate of mvh passes through cooling holes and protects the wall until it is mixed with the combustion products, which have a flow rate of mps. The next cooling film is then added. TV and TPS are the temperatures of the air and the combustion products, respectively. The dotted line represents the typical temperature distribution near the liner wall.
Combustion chamber design
The design of the combustion chamber requires a very state-of-the-art approach. Different companies currently use their own design methods and models. Here, a classical and simple design is used. In the engine’s preliminary design, the volume, lengths and diameters have already been specified for the start of the combustion chamber design. Together with these parameters, we select a tubular combustion chamber to produce and test a single liner. The tubular liner requires lower air flow for testing and it is also easier and cheaper to fabricate. The next step is to select the diameter of the liner. The limits for this diameter are the inner and outer diameters of the housing and the required distance of approximately 20 mm between liners to allow connection because of the flame transition. The layout for the preliminary engine construction, the proposed combustion chamber package and the post-design package configuration are shown in Figures 3, 4 and 5, respectively. According to the preliminary design, we obtained the following inputs:

Layout for preliminary engine construction.

Layout for proposed combustion chamber with tubular configuration.

Package for tubes after the design process.
Air flow rate ma = 9 kg/s; total pressure at inlet Pin = 4 bar; total temperature at inlet Tin = 462 K;
casing diameter = 407.5 mm; number of tubes = 8; tube diameter = 86 mm; inner diameter of air passage = 161.3 mm; and liner length = 242 mm. The length of the primary zone, i.e., the axial position of the primary holes away from the head of the combustor was selected to be 60 mm, which corresponds to the size of the recirculation zone of the swirler. For the chosen volume V of eight liners, the loading is defined as: 1

This level of loading corresponds to efficiencies of the order of 0.93–0.98. 2 The loading for the primary zone or for the primary and secondary zones is calculated by selecting the appropriate air flow rate and volume. By its nature, the loading is correlated to the ratio of the residence time to the time required for the chemical reaction to occur. For stationary gas turbines, this ratio is below 10, but for flying engines, some kind of compromise must always be made between engine size and performance.
Aerodynamics of combustion chamber
Stable combustion chamber operation is achieved by artificially forming zones in which the flow velocity is of the order of that of the flame propagation. Because flame propagation velocities are of the order of 0.5 m/s, while the velocity of the air in the combustion chamber is of the order of 50 m/s, it is obvious that the flow must somehow be stopped. In the combustion chamber, this is done by forming reverse flow zones or so-called recirculation zones. The end of the recirculation zone is usually at the end of the primary zone, where the mixing ratio of the air and the fuel is close to stoichiometric. Combustion is highly intensive in the primary zone, where approximately 70%–80% of the fuel is burned, but the remainder of the fuel is burned subsequently in the secondary zone. The end of the secondary zone can be recognized by the positioning of the dilution holes that are required to reduce the temperature to that of the turbine inlet level. The flow division process described above is illustrated in Figure 6.

Typical zones in the combustion chamber. 1
The labels used in Figure 6 are described as follows. a: combustion chamber casing; b: liner; c: cooling openings; mv: engine air flow rate; mvI: primary zone air flow rate; mvII: secondary zone air flow rate; mvIII: tertiary zone air flow rate; mvh: cooling air flow rate; mg: fuel flow rate; mPS: combustion products flow rate; 1: atomizer; 2: swirler; 3: fuel spray; 4: two-phase mixture; 5: recirculation zone; 6: flame front; 7: combustion area; 8: additional combustion area; 9: dilution zone; q+: heat flux from the combustion products to the incoming mixture.
There are various ways to design the aerodynamics of the combustion chamber, which is why we refer to these designs as the state of the art. In our design, we selected a standard configuration: a swirler and primary holes for stabilization, as shown in Figure 7.

Test model.
Calculation of air distribution and pressure drop
To divide the air into primary, secondary and dilution zones with the corresponding required pressure drops, it is necessary to perform calculations of both the air distribution and the pressure drop. Starting from the initial drawing, the designer can then change the sizes and numbers of the holes to fulfill their specific requirements.
The input design data were the pressure, the temperature, the air flow rate and the predicted geometry. Then, for each group of holes, a flow equation was written. 3 The sum of the local air flow rates must then be equal to the total air flow. 3
The discharge coefficients were calculated using the procedure published in Lefebrve et al 4 .
By solving i+1 systems of equations with i unknown air flow rates and pressure drops, we obtained the air distributions through each group of holes and the corresponding hydraulic pressure drops. After several iterations using different sizes for the holes, the geometry was selected, with results as shown in Table 1. To test the combustion chamber before the final design stage, four design combinations were prepared to check the primary and secondary zones. The main reason for selection of four primary zone configurations was that no exact method is available to predict the amount of air that passes from the primary holes to the primary zone, particularly in the presence of the swirler. The design strongly influences the fuel-to-air ratio in the primary zone and the efficiency and stability of the entire chamber. The specific geometries are presented in Table 1, while the design iteration process is illustrated in Figure 8.
Geometries of tested models.


Illustration of iteration process for design of the numbers and sizes of the holes.
An illustration of the geometrical values is shown in Figure 9.
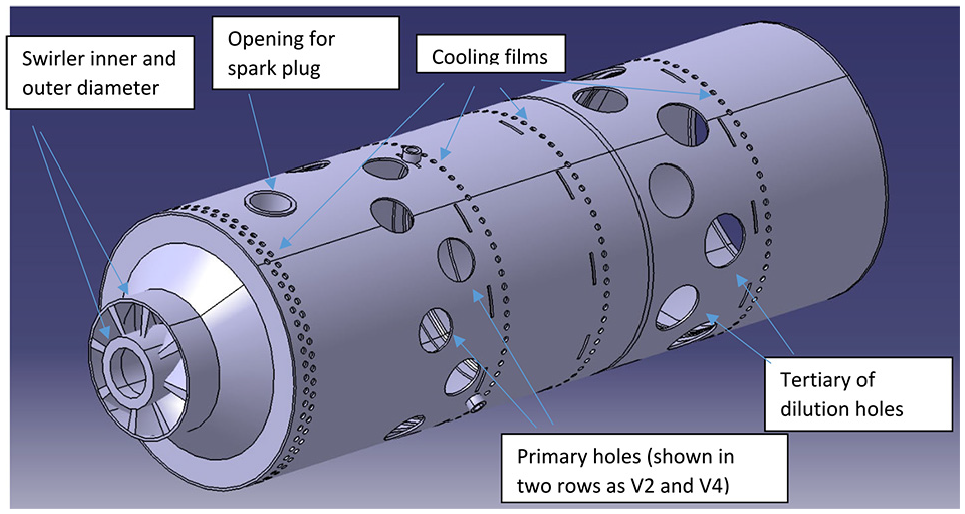
Illustration of the geometrical design values.
The calculated air distributions are listed in Table 2.
Calculated air distribution parameters.

Testing installation
The testing installation consists of the fuel, air and data acquisition systems. The fuel installation consists of a fuel tank (1), a rough 200-µm fuel filter (2), a geared fuel pump (3), a turbine flowmeter (4), a 3/2 electromagnetic valve (5), a fine 50-µm fuel filter (6), the test object (7) and a flow regulator (8), as illustrated in Figure 10. The flow regulator is a potentiometer that controls the rotation speed (rpm) of the electric motor that drives the pump. Control over the flow regulator is performed manually, i.e., it is controlled by the test operator. The fuel pump is capable of delivering 30 g/s at 20 bar.

Scheme of the fuel installation.
The air installation consists of a screw compressor (1), two manually controlled valves (2) and (8), a temperature sensor (3), two pressure transducers (4) and (5), a measuring pipe (6) and the test object (7). When the compressor is switched on, air is blown through the installation in accordance with the scheme shown in Figure 11. The positions of the valves (2) and (8) define how much of the air is blown to the test object (7). The air flow is measured with the measuring pipe based on measurements of total pressure, temperature and static pressure. The compressor is capable of delivering 1 kg/s per 10 bar of pressure.

Scheme of the air installation.
For the primary and secondary zone testing, a fan was used instead of the compressor. This fan’s maximum air delivery gauge pressure was 10,000 Pa with an air flow rate of 0.150 g/s. The tests were performed using a gauge pressure of 7000 Pa and an air flow rate of 0.17 kg/s. A photograph of the test model in the installation is shown in Figure 12. Some of the test details are indicated by labels on the figure: dPin indicates measurement of the total inlet pressure, dPst indicates measurement of the inlet static pressure, dPex indicates measurement of the total exit pressure, and Tex indicates measurement of the exit temperature. The procedure used was to establish the desired air flow rate and then to ignite and vary the fuel flow rate until the lean and rich limits were reached. In the case where it was not possible to ignite the mixture at the desired air flow, the procedure was to reduce the air flow rate until ignition was possible, and then increase the air and fuel flow rates simultaneously to achieve the desired air flow rate and the required fuel-to-air ratio. Additionally, there were cases when we were attempting to find the rich limit where the flame from the combustor was relatively long, and the decision was then made not to increase the fuel input further (the statement in the figures is “rich limit not achieved”). When the corresponding statement was used in the lean limit case, it was because of the minimum measurement values of the flowmeter used.
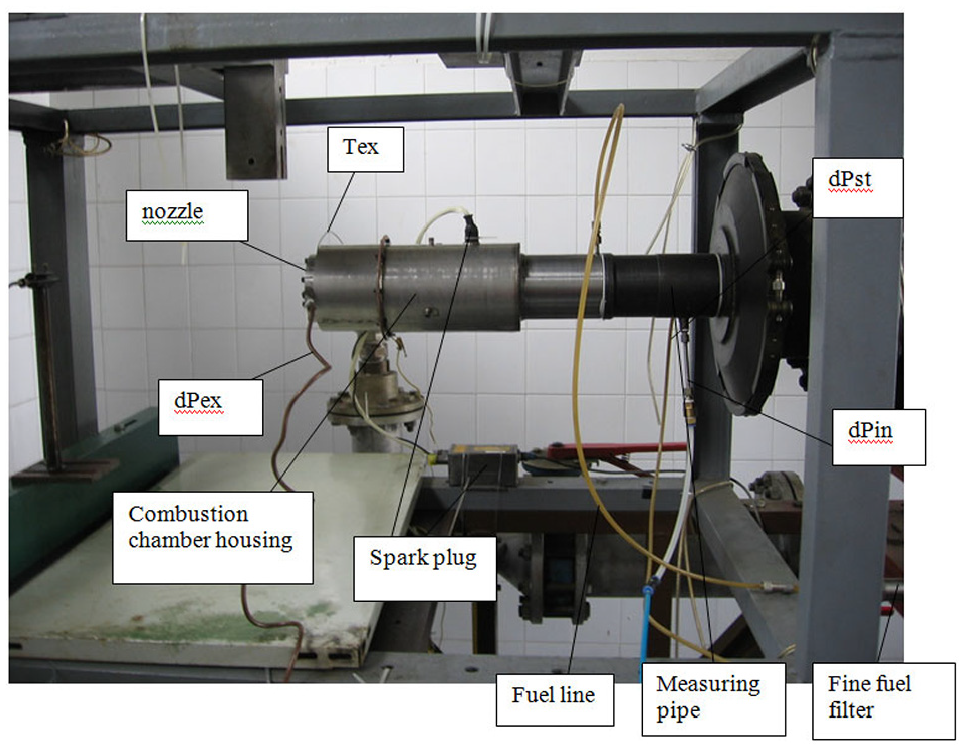
Combustion chamber in the laboratory. Labels: dPin: total inlet pressure measurement; dPst: inlet static pressure measurement; dPex: total exit pressure measurement; Tex: exit temperature measurement.
Combustion chamber testing
Atomizer testing
Two pressure swirl atomizers were designed and tested. One was intended for use in atmospheric testing when, with the same corrected air flow rate, the absolute flow is smaller and consequently the fuel flow rate is also smaller. Because of this smaller fuel flow rate, it was necessary to simulate approximately the same droplet size that occurred under working conditions. The designed atomizers were tested separately before use in the combustion chamber to check both the quality of the atomization and also their hydraulic characteristics, i.e., their discharge coefficients. Both the designed point and atmospheric test atomizers were tested with gasoline and the kerosene Jet A1 as fuels. The characteristics of the designed point atomizer are shown in Figure 13. A photograph of the spray from the designed point atomizer is shown in Figure 14.

Hydraulic characteristics of the designed point atomizer.
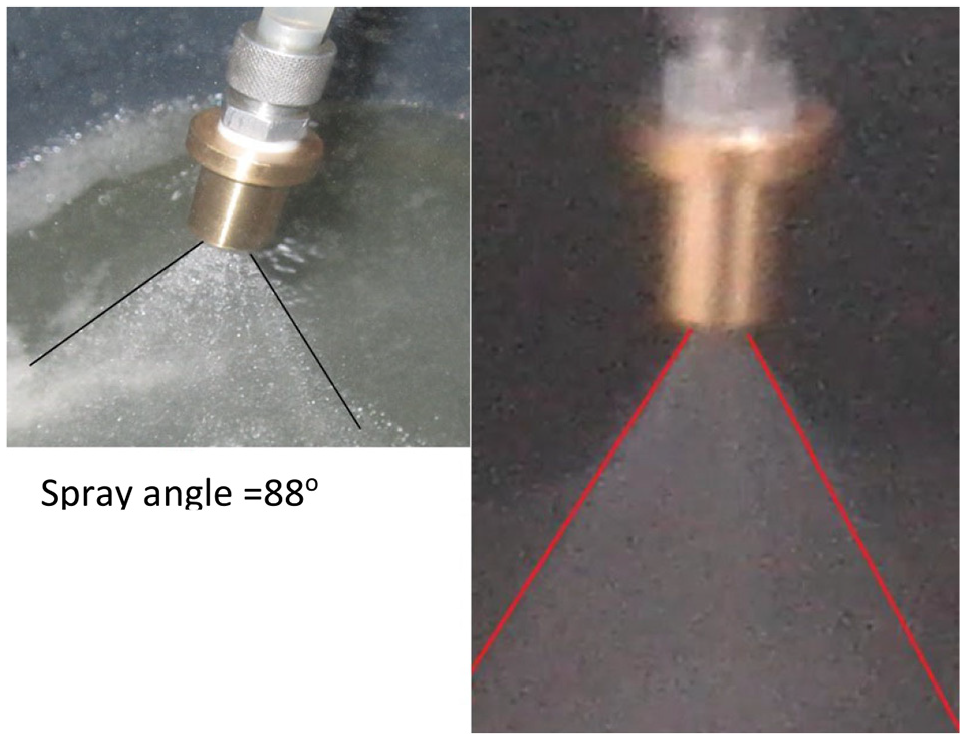
Spray from the designed point atomizer.
Primary + secondary zone testing
Four combinations of primary holes were tested under atmospheric equivalent conditions (using the same corrected flow rate and the same fuel-to-air ratio as occurred at 95% of the rotation speed (rpm) of the preliminary engine design). The results are shown in Table 3.
Calculated air distribution.mf: fuel mass flow rate.
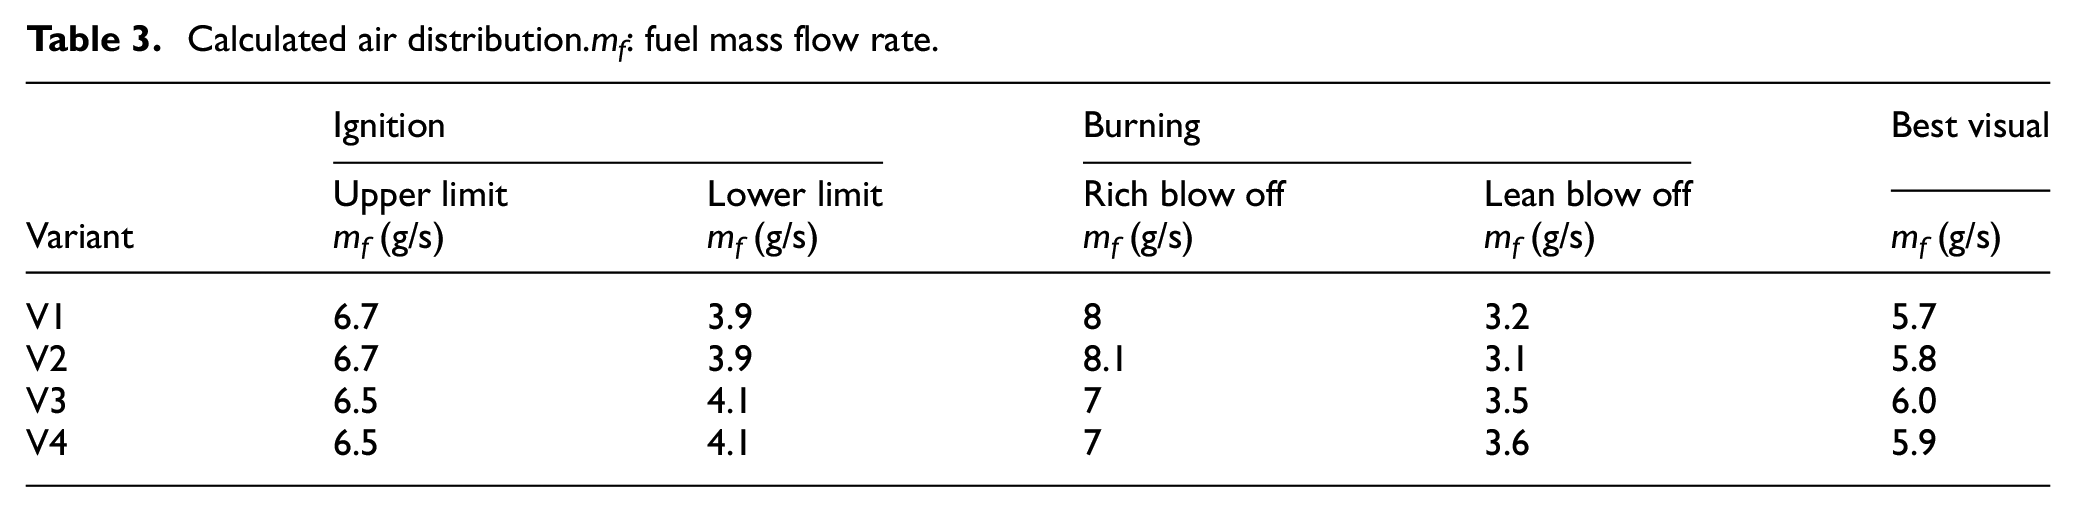
(Here, the air mass flow rate ma= 0.172 kg/s, and the rotation speed (rpm) was 95% of the designed speed.)
Combinations V1 and V2 were better than V3 and V4 in terms of their wider stability limits, and V2 was selected because of its better ignition characteristics and the consistency of its burning zone. After that, the dilution zone was welded to the primary and secondary zones, and all tests were then performed using the V2 combination. Photographs of testing of primary zones V1, V2, V3 and V4 are shown in Figures 15, 16, 17 and 18, respectively.

V1 testing at 5.8 g/s.

V2 testing at 5.8 g/s.
V3 testing at 5.8 g/s.

V4 testing at 5.8 g/s.
Combustion chamber stability and ignition margin under atmospheric conditions
Testing of the combustion chamber under atmospheric conditions was performed to test the stability and ignition properties under high loading. The equivalent conditions were calculated and they represented the same corrected air mass flow rate and fuel-to-air ratio, but the loading cannot be controlled along with the corrected air flow and fuel-to-air ratio. During testing, no lean or rich blow offs were observed at appropriate distances from the design point. Additionally, the chamber was able to ignite at all these points. A photograph of the testing procedure and the results are shown in Figures 19 and 20, respectively.

Testing of complete chamber without a nozzle.

Stability and ignition map recorded under atmospheric conditions.
Combustion chamber testing with a nozzle
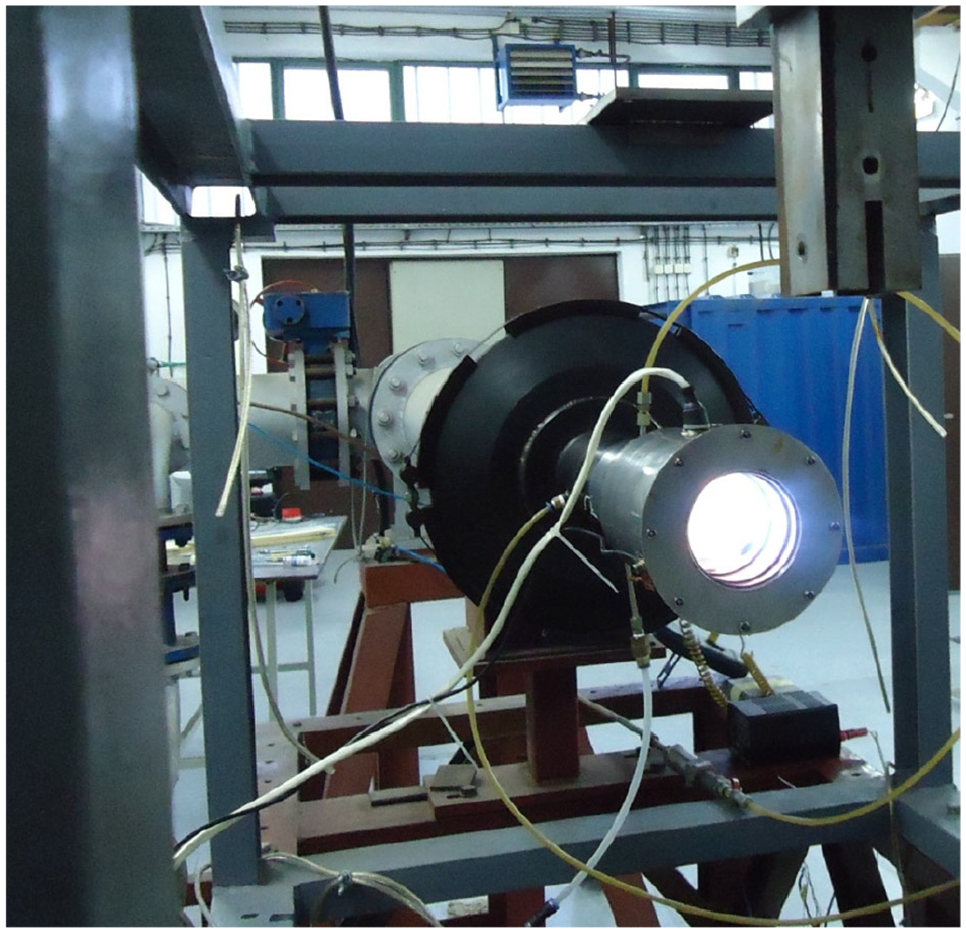
Testing with a nozzle was performed to simulate loading under conditions similar to those when the combustion chamber is mounted in the engine. All main performance characteristics of the combustion chamber were measured. A photograph of the complete model under test is shown in Figure 21.
Complete chamber with a nozzle under test.
Stability and ignition margin
The stability and ignition margin was observed by reducing and increasing the fuel flow rate at a constant air flow rate. These data were then compared with the working points extracted from GasTurb Software 5 calculations of the engine off-design. The measured data are presented in Table 4. The measured data graphed together with the calculated engine working line are shown in Figure 22.
Measured stability and ignition data.ma: air mass flow rate; mf: fuel mass flow rate.


Stability and ignition map under working conditions.
Pressure drop and efficiency
Figure 23 shows a comparison of the predicted and measured pressure drop characteristics. There is a difference between the characteristics of 1.8% at the maximum air mass flow achieved, while the other data are inside these limits; this is quite satisfactory for application to an expendable combustor.

Total pressure drop coefficient.
Both the pressure drop and the burner efficiency were extracted from the measured data. These samples were selected to correspond to the air and fuel flows from the engine data extracted from the GasTurb software calculations. The measured data are given in Table 5. The new labels shown in Table 5 are dPin and dPex, which represent the total gauge pressures at the inlet and exit, respectively, and Tin, which is the total temperature at the inlet; no preheater was used in this case.
Measured data for efficiency and pressure drop.σg: combustion chamber efficiency; σgcalculated: calculated combustion chamber efficiency; σp: combustion chamber pressure recovery coefficient; σpcalculated: calculated combustion chamber pressure recovery coefficient.

The burner efficiency was measured indirectly using a method from rocket propulsion, as described in Davidović. 6 The measured results showed good agreement with the designed values, with the small differences that occurred in nature probably being related to changes in the effects of the residence time and the droplet size. The data are presented in terms of the relative rpm and are compared with the off-design data obtained from the GasTurb software calculations. The reduction in efficiency observed with decreasing relative rpm is a consequence of increased loading. The slight increase in efficiency measured below the relative rpm of 0.69 is a consequence of the increasing residence time and the decreasing fuel flow rate (the engine data indicate that lower fuel-to-air ratios are required as the relative rpm decreases). In practice, the atomizer begins to work better, not because of the change in pressure, but because of reduction in the total amount of fuel that must be atomized. The results are shown in Figure 24.
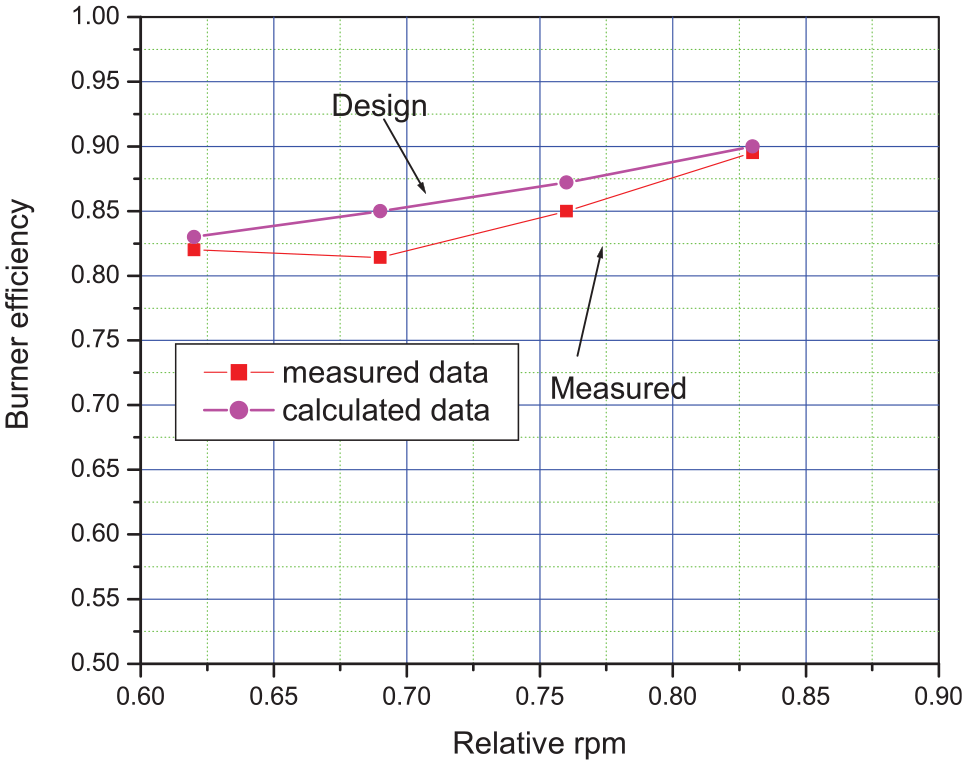
Burner efficiency characteristics.
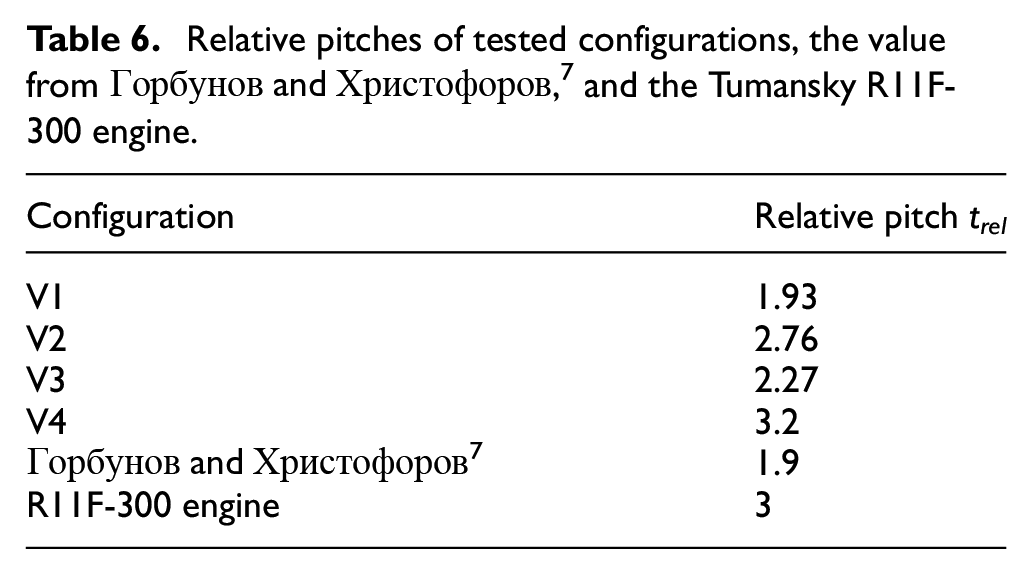
The designed numbers and sizes of the primary holes are the results of the desired air distribution, but it is possible to have many combinations that will give approximately the same results in terms of the air distribution but will not produce the same overall performance for the combustor. Another aspect is that the amount of the air from primary holes that will flow to the left in the primary zone is very difficult to predict. This behavior influences both the fuel-to-air ratio in the primary zone and the flow structure. As indicated earlier, this is why experimental work is required in addition to the theory. To enable comparison with similar previous studies, attention is paid to the relative pitch of the holes in the primary zone, i.e., the ratio of the distance between the holes to the hole diameter.
In a previous study, 7 it was found that the best efficiency was expected to occur at a relative pitch of 1.9, but this study was limited to efficiency and did not consider stability. In contrast, an existing combustor from a Tumansky R11F-300 engine owned by the EDePro company has a relative pitch of 3. It is obvious that the design guidance should be for relative pitch values of between 2 and 3, but the experimental verification must be performed.
For comparison, the relative pitch values of the configurations tested in this work are shown in Table 6.
Relative pitches of tested configurations, the value from , 7 and the Tumansky R11F-300 engine.
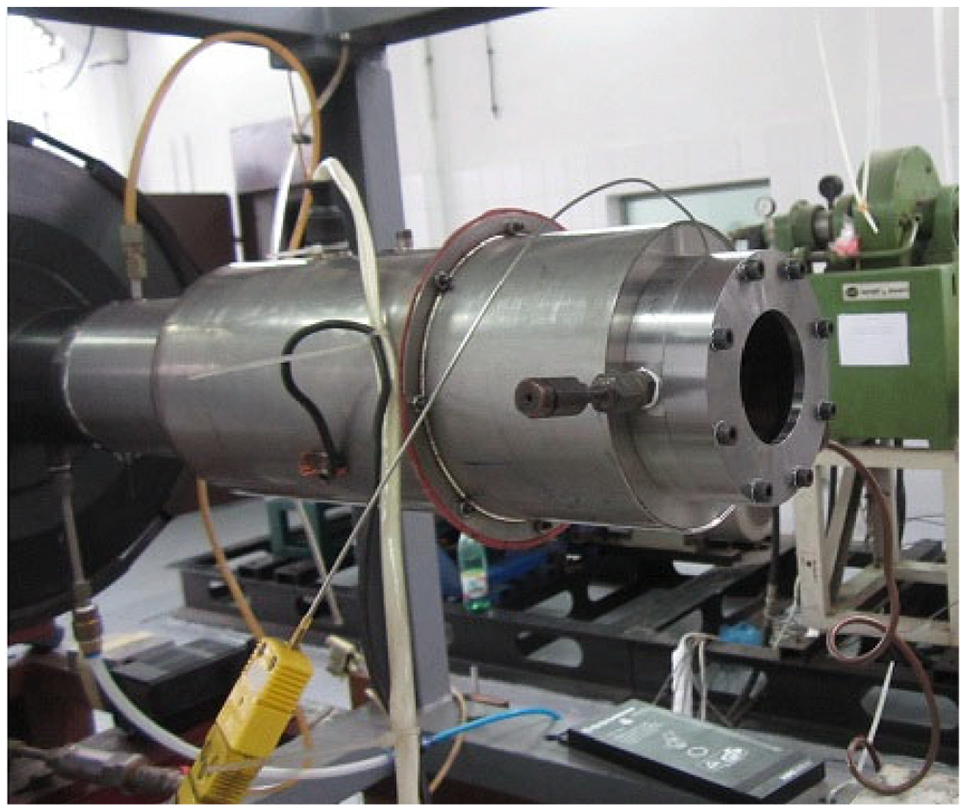
After testing, the model was disassembled to check for irregularities, but no problem was found. A photograph of the disassembled model is shown in Figure 25.

Photograph of disassembled model after testing.
Conclusion
This study presents a contribution to the experimental research into gas turbine combustors. Because combustors are known as state-of-the-art components, this study analyzed four primary zones and the complete combustor configuration experimentally in terms of its stability, ignitability, efficiency and pressure drop. The proposed methodology was based on the available experimental data for the design and then relied on subsequent experimental verification. The inputs were design data from a specific expendable turbojet of the 500daN thrust class. The object of the study was to analyze the primary zone configuration, i.e., to analyze the optimum numbers and sizes of the holes in the structure and realize an overall maximum performance that includes stability and efficiency together. When the primary zone was selected, the rest of combustion chamber was added to continue testing of the complete configuration. Tests of the combustion chamber without a tertiary zone were performed at atmospheric pressure, while the tests of the complete configuration were performed at both atmospheric and working pressures.
The results show that the combustor’s stability margin is wide enough to cover the entire expected working area. The measured efficiency and pressure drop show very good agreement with the corresponding designed values. A design parameter called the relative pitch of the primary holes was varied, and it was shown that relative pitch values of between 2 and 3 should be selected and subsequently verified through testing. The axial position of the primary holes was fixed and corresponded to the length of the swirler recirculation zone size.
Although annular combustors are currently more popular, tubular chambers are easier to test, fabricate and change, and more of the available data generally refer to tubular combustors. The results of this study could be used to perform similar designs for both tubular and annular combustors because there is a natural logical correspondence between the tubular and annular chambers. The design and testing methodology proposed here could be applied to similar scientific and engineering research activities.
Footnotes
Appendix
Acknowledgements
The authors wish to acknowledge and to thank the company EDePro – Engine Design and Production from Belgrade, Serbia, for their support in the realization of this project.
Handling editor: Chenhui Liang
Declaration of conflicting interests
The author(s) declared no potential conflicts of interest with respect to the research, authorship, and/or publication of this article.
Funding
The author(s) received no financial support for the research, authorship, and/or publication of this article.
References
 .
. .
.