
Abstract
The principal features of primary zone determine the performance parameters of the whole combustion chamber, such as the pollutant emissions and combustion efficiency. In this work, flow field and major species concentration measurements are conducted in the primary zone of an aero-engine combustion chamber. The operating conditions such as air inlet temperature, chamber pressure, and air-to-fuel ratio are chosen to replicate the realistic operating conditions. The velocity field and streamlines are obtained by particle imaging velocimetry technology. The concentrations of major species are acquired by a spontaneous Raman scattering system. This article validates the feasibility of two laser diagnostic measurement techniques and presents the initial results under realistic aero-engine conditions.
Keywords
Introduction
Stable and efficient combustion over the entire range of the aero-engine working conditions is the primary task of the combustion chamber to achieve the maximum heat release for the limited space available. The flow characteristics in the primary zone contribute significantly to the forming of the recirculation zone, the distribution of the fuel/air mixture, combustion stability, and the length of the combustion zone. 1 The investigation of aerodynamics in the primary zone causes the continuous concern in combustion chamber design community and has become increasingly important due to the stringent emission regulations. The objective of this work is to measure the velocity field and major species distribution in order to provide additional insight into the aerodynamics of the primary zone.
In recent years, miscellaneous laser diagnostics such as coherent anti-stokes Raman scattering (CARS), particle imaging velocimetry (PIV), and planar laser-induced fluorescence (PLIF) have been applied to the combustion research due to the rapid advancements in computer image processing. Nevertheless, it is still a great challenge to obtain valuable information in realistic aero-engine combustion chambers because of the extremely complicated measuring environment.
The flow features of swirling combustion obtained by intrusive instrumentation have been reviewed by Lilley. 2 The PIV was first applied to the model combustion chamber under atmospheric conditions to provide detailed flow structures. Stohr 3 used stereo PIV to investigate the flow structures in a typical partially premixed swirl-stabilized flames. The measurements showed that the vortex breakdown with a precessing vortex core (PVC) in the shear layer enhanced the mixing of burned gas and air. Khalil 4 measured the velocity field of swirl burner under both unconfined and confined conditions. It was revealed that the recirculation zone was enlarged and turbulence activities were enhanced by confinement under reacting conditions.
The laser diagnostic measurement techniques of velocity field have been gradually applied to the realistic aero-engine combustion chamber in recent years. Mohammad 5 applied laser Doppler velocimetry (LDV) system to a single annular combustion chamber to study the flow structure control. The influences on central recirculation zone and turbulence activities of the primary jets are discussed in detail. Fanaca 6 measured the velocity field in both the annular and single combustion chamber using high-speed PIV. The flow field change between the two configurations at the same operating conditions is well explained by new proposed theory.
In order to obtain the major species distribution, sampling probes are commonly used at the combustion chamber outlet. Spontaneous Raman scattering (SRS) is a feasible laser diagnostic technique for measurements of species concentrations. Magnotti et al. 7 presented SRS spectra of different hydrocarbon fuel at high temperature for combustion applications. The Raman scattering technique was then applied to laboratory flames to better understand the compositional structure.8–10 Stopper et al. 11 yielded the distribution of the major species concentrations in an industrial gas turbine combustion chamber by multi-scalar Raman technique under realistic gas turbine conditions.
To better understand the aerodynamics in the primary zone, a test rig of aero-engine combustion chamber is designed and established in our research group. The purpose in this work is to conduct velocity and major species measurements in the primary zone using PIV and SRS system separately and to evaluate the limitations of these laser diagnostics.
Experimental details
Test rig
All the experimental results presented in this article were obtained in the electrical resistance heated combustion experimental facility of Northwestern Polytechnical University (NWPU). This facility was initially designed for supersonic combustion testing and underwent a transformation to conduct aero-engine combustion chamber experiments.
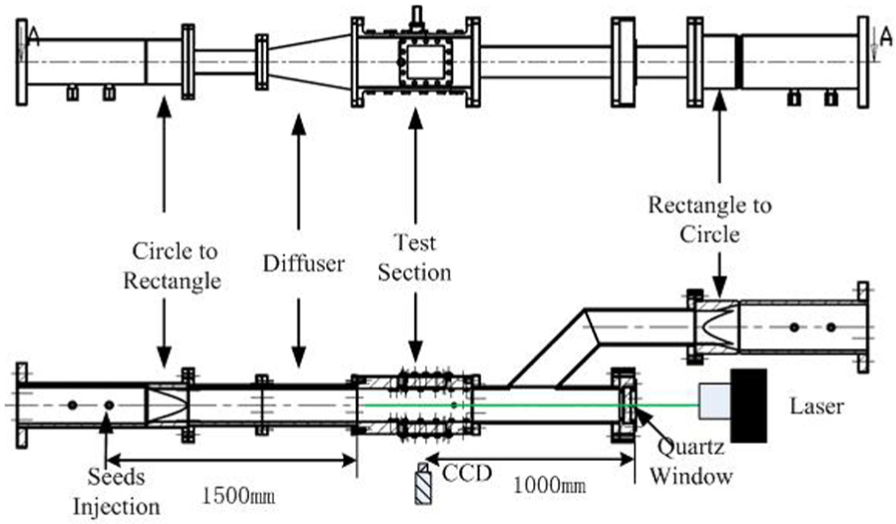
The schematic of test facility is shown in Figure 1. The core unit of this facility is electric resistance heating system which is capable of heating the incoming air up to 1000 K. This value is only satisfying the low range of the supersonic combustion chamber inlet temperature, but it is completely adequate for aero-engine combustion chamber research. The air comes from four air tanks which have a total volume of 18 m 3 and pressure is 60 bar. Before entering the heat system, the air is first filtered and adjusted by air regular system, then split into six airstreams, and passed into the six electric resistance heaters, respectively. There are two manual valves and two solenoid pneumatic valves mounted on the supply line to achieve long-distance control and air mass flow adjustment.

Schematic of the facility to study the aero-engine combustion chamber.
The six electric resistance heaters with overall power of 750 kW are capable of heating the air to the high temperature. The power is supplied to our experimental facility by an exclusive electricity substation. The input power of each heater is able to be manually adjusted to meet outlet temperature requirements. A manual valve is fixed at every electric resistance heater outlet to guarantee that the mass flow will be well-distributed during system calibration. Pressure sensors and thermocouples are installed downstream of each electric resistance heater to monitor the working conditions. At the downstream of the heaters, a cylinder is used to collect the air stream from the six heaters and provide uniform air stream to the subsequent test section. The temporal development of temperature at the heater system outlet is shown in Figure 2. Time for heating the air up to 1000 K is required not more than 3 min. The temperature in the test section remains unchanged during the testing period.

Temporal development of temperature at heater system outlet.
The high-temperature gas enters a water-cooled segment after it leaves the test section. The gas flow is then divided into two separate parts. The majority of the gas is exhausted through a motorized butterfly valve. The remainder is delivered to a pipe with an orifice plate. The use of a motorized butterfly valve and an orifice together can achieve precise control of the pressure in the upstream combustion chamber over a wide range of operating conditions. The incoming gas temperature must not exceed a limit determined by the materials of the valve core. The maximum temperature value permitted by the valve is up to 560°C at pressure up to 16 bar. As a result, water is injected into the pipe before the gas entering the valve.
Combustion chamber specifications
The experimental model is derived from an annular combustion chamber of a realistic aero-engine. It originally consists of 16 sectors altogether and each sector has its individual swirl cup and fuel supply system. In the current research, a rectangle combustion chamber model including only one swirl cup is designed and manufactured to investigate the flow field and flame features in the primary zone. In order to realize the optical accessibility, four transparent quartz glasses are used to perform the laser diagnostics. Two windows with the dimension 100 mm × 80 mm are located on the lateral sides of the combustion chamber model. The third window with the dimension of 90 mm × 73 mm is located on the rear side. The last one is a circular glass of diameter 15 mm and located on the bottom wall just across the middle primary hole on the flame tube. Additionally, the temperature in the primary zone is possibly high to 2400 K. In order to protect the quartz glasses from the heat loads and sweep away the PIV particles accumulated on the window surface, cooling air stream is introduced from outside to cool and clean the glass.
Inside the combustion chamber model, a flame tube (Figure 3) is used to contain the high-temperature gas. There are a number of primary holes, secondary dilution holes and cooling air holes on the upper and lower surfaces of the flame tube. The air in the passage between the flame tube and combustion chamber walls is fed into the flame tube through these holes. The flame tube is commonly convergent in realistic combustion chamber. However, in the current research, the cross-sectional area of the flame tube is kept constant to achieve an enlarged visible area from the rear window. It is worth noting that the spark plug is fixed on the top surface of the flame tube to initiate the flame.

Flame tube of the current model.
The swirl cup (Figure 4) is mounted on the dome to produce recirculation zone to stabilize the flame. One jet and one vane-type swirler are mounted concentrically to impart swirling to the stream. The rotation directions of the airstreams are counter-rotating according to the design. The kerosene is injected from a pressure swirl fuel nozzle which is located in the center of the swirl cup. A Venturi tube and conical flare are connected to the primary and secondary swirler to promote the atomization of fuel and mixing with air, respectively.
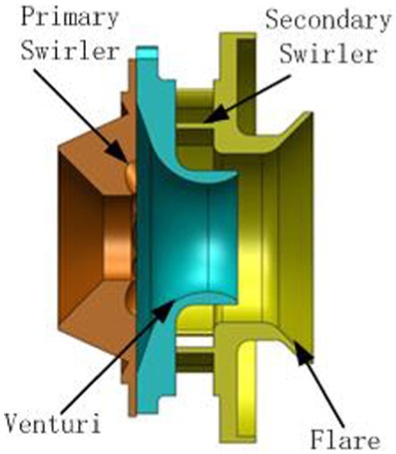
The swirl cup.
Measurement techniques
PIV setup
A PIV system provided by Microvec Pte Ltd is applied to measure flow field in the primary zone. This system mainly consists of a double-pulsed Nd:Yag laser with energy of up to 350 MJ per pulse and a wavelength of 532 nm and a double-frame double-exposure charge-coupled device (CCD) camera with resolution of 2048 × 2048 pixels per frame. The camera delivers 12-bit digital images and exposure time as short as 200 ns at a repetition rate of 15 Hz. A filter with 532 ± 5 nm bandpass and 50 mm diameter is equipped to reduce the influence of the background light in the second frame. The separation time between two pulses is 2.5–25 μs. SM-MicroPulse725 synchronizer is utilized to adjust the laser system and the CCD. The final interrogation window size is 32 × 32 pixels and the corresponding spatial resolution is 0.045 mm. The absolute measuring uncertainty of instantaneous velocities is estimated as 0.5 m/s. The data post processing is accomplished with the software SM-MICROVEC3 which is also provided by Microvec Pte Ltd.
Alumina (Al2O3) particles with nominal diameter of 400 nm are chosen for seeding. To prevent its agglomeration from the moisture, the alumina particles are dried prior to the experiments to remove the water vapor contained. Pressurized nitrogen is used to drive the seeding device and add the particles into the main air stream at the position of 1500 mm upstream of the test section. Cooling nitrogen passes through holes of the window and forms an insulating film on the inside surface to protect the quartz glass and prevent contamination from the particles.
The PIV system is set up in two arrangements with different orientations of the laser and CCD system. First, the laser sheet is introduced from the rear of the test section parallel with the flow direction to illuminate the measurement plane, and the camera is positioned at lateral side window perpendicular to the laser sheet. Second, the light sheet enters the combustion chamber from the lateral side window, and the camera is positioned at the rear of the combustion chamber. In one experiment, at least 150 pairs of image frames are continuously captured. The laser sheet of 0.2 m width in the test section is sufficient for PIV measurement. The waist distance Z is determined given a Gaussian beam’s waist size
PIV setup on the aero-engine combustor experiment.
All the measurement planes are shown in Figure 6. The velocity measurements are focused on the plane cutting through the middle primary air hole and two middle secondary air holes longitudinally. And the Plane 6 just cuts through all the primary air holes transversely.

Position of the PIV measurement planes on flame tube surface.
SRS setup
The SRS system is utilized to measure the major species concentration including CO2, H2O, O2, and N2 in the combustion zone. The frequency-tripled Nd:YAG laser is used to emit laser beam with an average diameter of 8 mm and a pulse energy of about 150 mJ at a repetition rate of 10 Hz. The spectrograph includes NanoStar ICCD and a Spectro500 monochromater, with grate constant 600 g/mm and 392 nm center wavelength. Spectrum range is about 40 nm, which covers the Raman spectrum of major species due to combustion. The delay time of the ICCD is set to 90 ns and the gate time is 60 ns.
SRS setup is shown in Figure 7. After reflection from the focusing lens, the laser beam goes into the combustion chamber from the bottom primary hole on the flame tube surface. The Raman scattering signal is collimated into a collective lens and then examined by spectrograph perpendicular to the side window. A concave cylindrical lens and achromatic lens are used to intensify the signal and remove noise, respectively. All the components of the Raman apparatus are secured to a same shell frame during the experimental process in order to keep the system stable and reliable.

SRS setup on the combustion chamber experiment.
Results and discussion
Analysis of particle images
For the PIV results presented here, the experiments are operated with pressure 5.5 bar and temperature 300 K. First, the quality of the particle images obtained in the current research is evaluated. Figure 8(a) gives a representative original PIV image. The laser sheet propagates from right to left and the air flows from left to right. The white dots are the alumina particles distributed in the flow field. To clearly indicate the particles, gray scale transformation is applied to the original images. Figure 8(b) shows that particle distribution from measurement is uniform without visible agglomeration phenomena and the intensity is moderate in the measurement region. This is essentially of importance to calculate the accurate velocity field. Figure 8(c) gives a representative image after window contamination. In this case, the window is severely vague. The similar images have to be removed before image processing. In the current experiments, particles are fairly prone to accumulate in the vicinity of the primary air holes and in the front and back edges of the window. Thus, the actual measurement area is slightly smaller than the window size.

Sample particle images in the current research: (a) original image before image processing, (b) image after gray-level transformation, and (c) image after window contamination.
The flow field immediately downstream of the flare is hard to be captured using the normal camera angle because the size of the window is still not large enough. In addition, the quality of particle image is significantly affected by the background. The back steel plate opposite to the window is roughly painted. It is found that diffuse reflection light from the plate has adverse effect on the quality of the image. Sand blast cleaning should be conducted before the spray painted to enhance the surface finishing in the future, including the flare and the whole inside skin of test section. Unfortunately, sand blast was not applied for this study to guarantee the machining accuracy.
Analysis of flow field
Mean velocity magnitude contours and streamlines on the central plane in the primary zone are shown in Figure 9(a). The origin of the coordinates is located at the center of the flare exit. The axial direction is the x coordinate, and the vertical and lateral directions are y and z coordinates. In the outer region, the primary air issued from the vanes passages of swirl cup expands abruptly and impinges on the flame tube walls at 20–25 mm downstream of the flare exit. After impingement, the swirling jets change to wall jets and deflect back to the central region together with the primary jets. In the inner region, the air flow reverses its direction and forms a toroidal vortex due to the axial adverse pressure gradient. A portion of primary air jets deflect backward due to the strong swirling jets and cause a horizontal jet angle of approximately 60°. The absolute velocity magnitude reaches up to 70 m/s in the core of the primary air jets. Therefore, the opposing jets roughly penetrate to the half-height of the flame tube and impinge with each other, and hence, two recirculation zones form behind the primary air jets.

PIV results at central plane: (a) velocity magnitude contours and streamlines and (b) axial velocity contours and the recirculation zone.
Mean axial velocity contours and zero axial velocity lines on the central plane are shown in Figure 9(b). The large central recirculation zone exists in the primary zone. The red bold line stands for the zero axial velocity and defines the edge of the recirculation zone. The range of velocity magnitude in the recirculation zone is 8–12 m/s. The central recirculation zone extends into the conical flare in the upstream and terminates at the downstream about 55 mm where the primary jets impinge. Thus, the momentum and position of the primary jets have a strong impact on the size of the recirculation zone, lean blowout, and emission index of the combustion chamber.
It is important to note that small recirculation zones behind the two primary air jets are fairly different. The size of recirculation zone behind the top primary jet is smaller than that behind the bottom one. Although the magnitudes of velocity in top and bottom primary airstreams are similar, the axial velocity in the top air stream is larger than that in the bottom air stream. The top primary air stream is more swept backward than the bottom one. As a matter of fact, the spark plug is fixed on the top flame tube wall, which leads to the size difference of the recirculation zones behind the primary air jets.
Normalized mean axial and radial velocity profiles at axial locations of 15, 30, 45, 60, 75, and 90 mm are presented in Figure 10. At locations of 15 and 30 mm, the axial velocities are positive at two ends due to the swirling jet and negative in the middle due to the existence of the center recirculation zone. At locations of 60and 75 mm, the axial velocities are negative at two ends due to the recirculation zones behind the primary air jets. At the location of 45 mm, the double peaks in velocity profiles are observed because this location just cuts through the two primary air jets and the rear part of the central recirculation zone. The magnitude of radial velocity is larger than axial velocity. The velocity gradient in y direction is greater than in axial direction. Therefore, we calculate velocity with step of 12 pixels in y direction, while with step of 8 pixels in x direction during the image processing.

Normalized velocity profiles at different axial locations: (a) mean axial velocity profiles and (b) mean radial velocity profiles.
The result of the Plane 6 which just cuts through the primary air holes transversely is shown in Figure 11. In order to promote the spatial resolution, only one-fourth of the overall cross section is captured. As shown in Figure 11(a), the background is the swirl cup. Because the swirl cup is unable to be completely painted black to keep the effective area of swirl cup unchanged, some diffusion reflection lights still exist. Consequently, data post processing are partially affected by the model background. From Figure 11(b), the high-speed jets emanated from the primary air holes are the dominant flow feature. The magnitude of velocity in the core of the primary jet reaches roughly 65 m/s, which is in accordance with the central plane results. Further downstream of the primary air holes, the velocity decreases and the width of the jet increases rapidly as the flow becomes fully developed. Since the area of the left primary hole is only half of the middle one (Figure 6), the left primary jet has larger momentum and penetrates more.

Plane 6 measurement results: (a) background and (b) the contours of velocity.
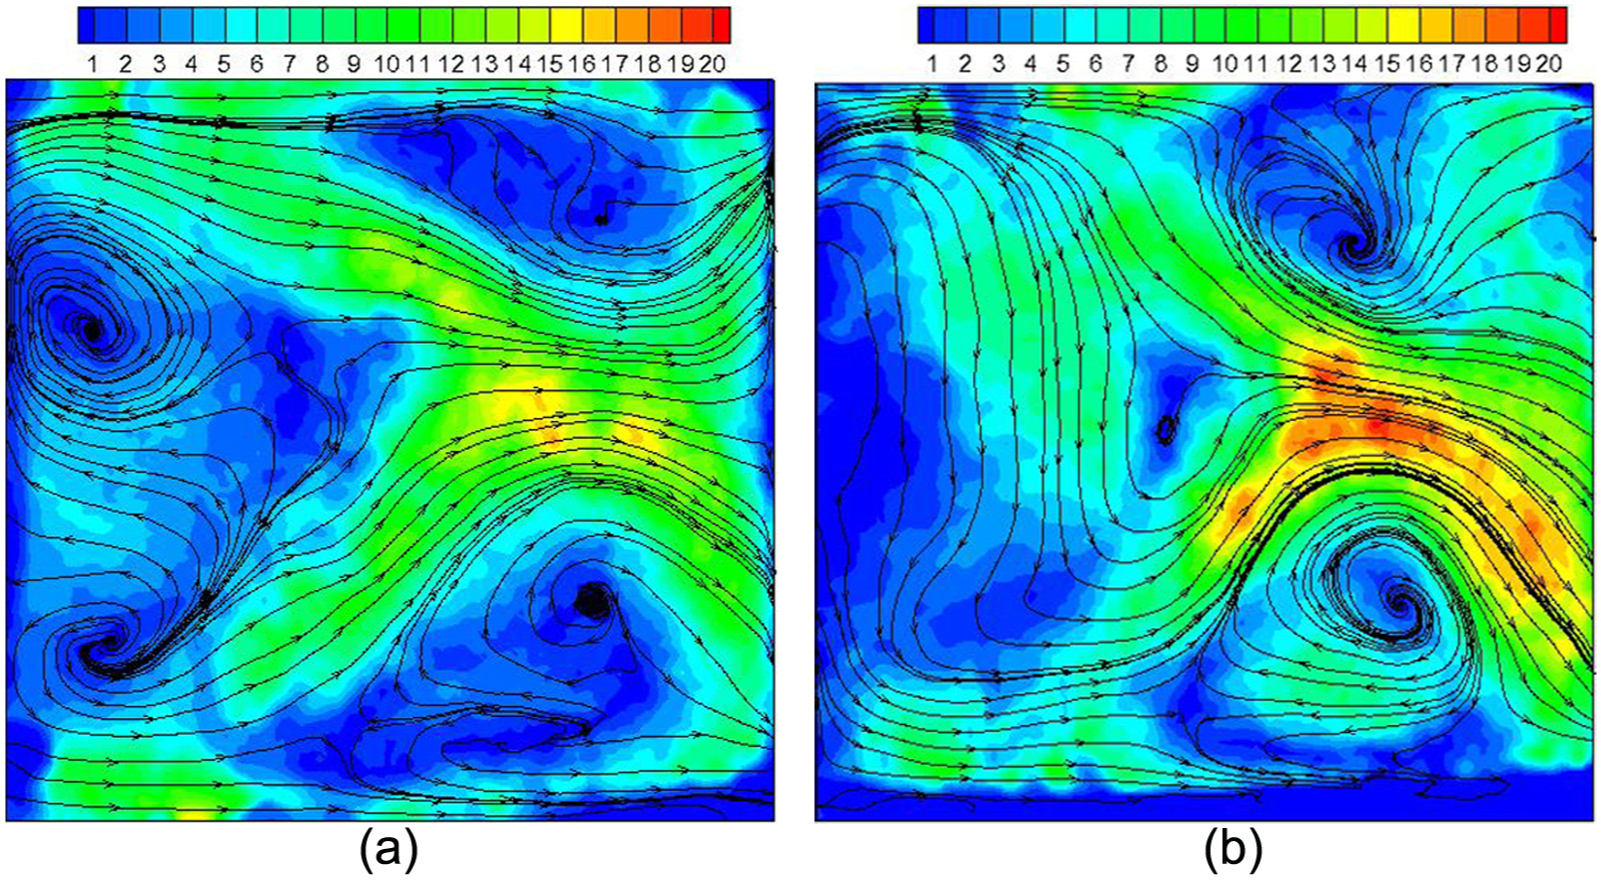
The velocity contours and streamlines at Planes 2 and 3 are shown in Figure 12. The velocity contours of the two planes are remarkably different. Although the top and bottom secondary dilution air holes are nearly symmetric, the vortices are totally different. The bottom vortices are more prominent. The reason is that the swirl cup imparts swirling motion to the flow. The effect remains in the downstream of the swirl cup. Compared with Plane 2, the magnitude of velocity at Plane 3 is lower and the corresponding jet angles are relatively small. The dilution air jet from the top wall is almost shooting into the flame tube vertically at Plane 3. This is because the spark plug and the injector are mounted on the top surface of flame tube. In addition, the spark plug tilts toward the Plane 2. Both the spark plug and injector have strong impact on the flow in the annulus passage between the flame tube and combustion chamber casing.

Velocity contours and streamlines at (a) plane 2 and (b) plane 3.
The contours and streamlines at Plane 4 and Plane 5 are shown in Figure 13. The maximum velocity is located in the vicinity of the center line downstream of the primary holes for both planes. The intermediate velocity regions shown in green indicate the influence of primary jets and secondary dilution jets. The low-velocity region shown in blue is near or in the recirculation zone. The difference between these two planes could be explained similarly to the above.
Velocity contours and streamlines on (a) Plane 4 and (b) Plane 5.
Analysis of species
The measurement uncertainty of SRS is evaluated before the combustion test. First, the Raman spectrum of incoming high-temperature air is measured. The corresponding working condition is the incoming air temperature 860 K and mass flow rate 0.44 kg/s. No fuel is injected in the combustion chamber. The measurement difference between the test section and theoretical value is less than 2%, as shown in Figure 14.

Species mole fraction of incoming air.
Then, SRS measurements of the primary zone are carried out at two working conditions. The working condition A is as follows: the air mass flow rate 0.44 kg/s, the kerosene mass flow rate 11.5 g/s, the incoming air temperature 860 K, and the pressure in the combustion chamber 5.5 bar. The corresponding equivalence ratio for the overall combustion chamber is 0.384. The measurement zone is a rectangle, x = 36 mm, −5 mm < y < 5 mm, and −3 mm < z < 3 mm. Figure 15 shows the flame shape in the primary zone. The photo of the flame is taken outside the quartz glass by a conventional camera. The primary jets from the top and bottom wall of the flame tube is clearly observed.
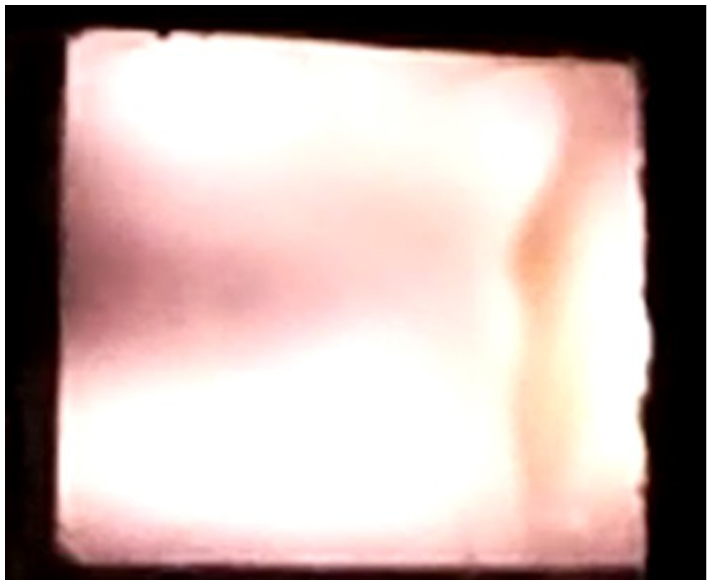
The flame shape in the primary zone.
A typical Raman image obtained under condition A is shown in Figure 16(a). The horizontal coordinate is the wavelength and the y coordinate is spatial distribution in the measurement zone. The Raman spectral images acquired in the experiments are continuous spectra. Based on the characteristic analysis, it is the fluorescence spectrum due to the interaction between the laser and kerosene. Because of the high turbulence essence in the primary zone, the unburned kerosene is fairly unevenly distributed in the combustion chamber. It is observed that the spatial position and intensity of the kerosene fluorescence vary rapidly over time.
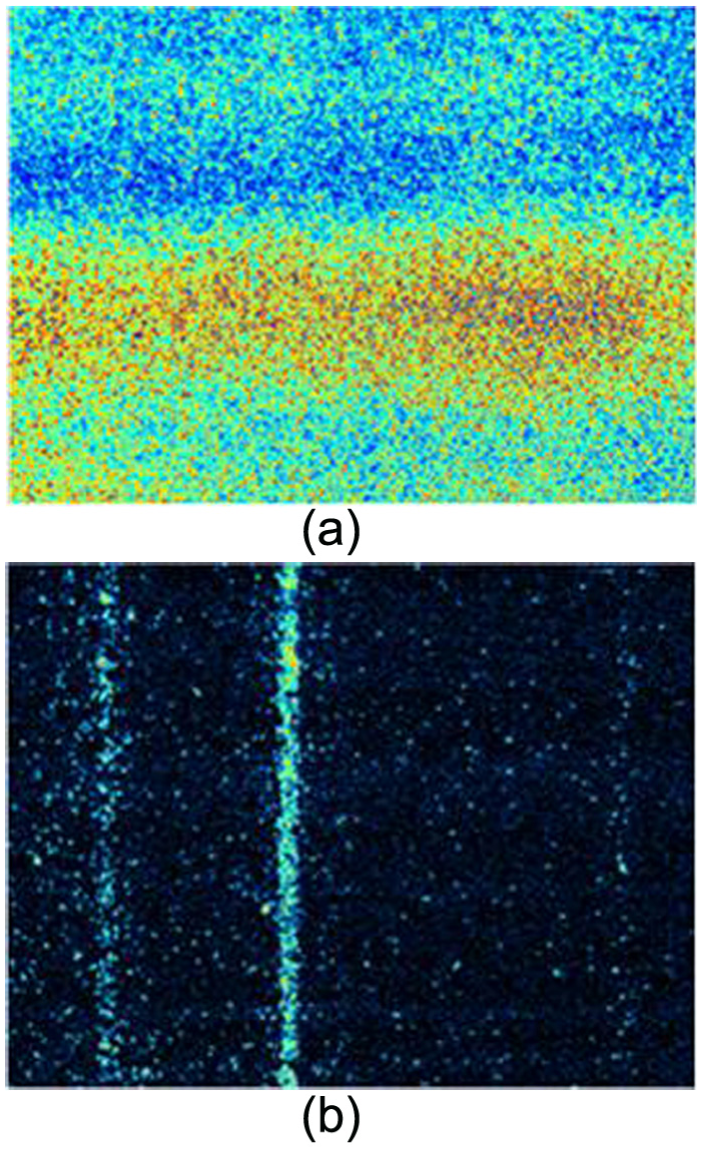
Raman images obtained under two conditions: (a) condition A and (b) condition B.
The measurement under this condition demonstrates that the kerosene fluorescence due to uncomplete combustion severely interferes with the Raman signal and even overwhelms it. In addition, the unburned kerosene absorbs the ultraviolet laser and the Raman signal, making difficult to detect the Raman signal. As a result, quantitative signals have not been obtained.
In order to decrease the interference of unburned kerosene, the working condition B is designed and it is similar to condition A except that the kerosene mass flow rate decrease to only 8.41 g/s and the corresponding equivalence ratio is 0.27. Figure 16(b) gives a typical Raman image obtained under condition B. Compared with condition A, the interference of fluorescence has nearly disappeared due to the more sufficient combustion in the measurement zone.
The major species in the measurement zone include CO2, O2, N2, and H2O. Based on the Raman spectrum intensity of major species, the average mole fraction and the variance of each species over the whole measurement zone is calculated, as shown in Table 1. The measurement variance in the primary zone is slightly worse than that in the incoming high-temperature air. This comes from two aspects. As the temperature in the primary zone increases, the gas density decreases; thus, the signal intensity decrease. However, background light intensifies due to the unsteady combustion.
The mole fraction of major species.

To acquire the mole fraction at different positions, the spatial zone measured by SRS is divided into four smaller zones. There are 480 pixels altogether along the vertical direction. The corresponding overall spatial area is 10 mm × 6 mm and each small zone is 2.5 mm × 6 mm. The mole fractions in each small zone are extracted and shown in Table 2.
The mole fraction of major species at different positions.
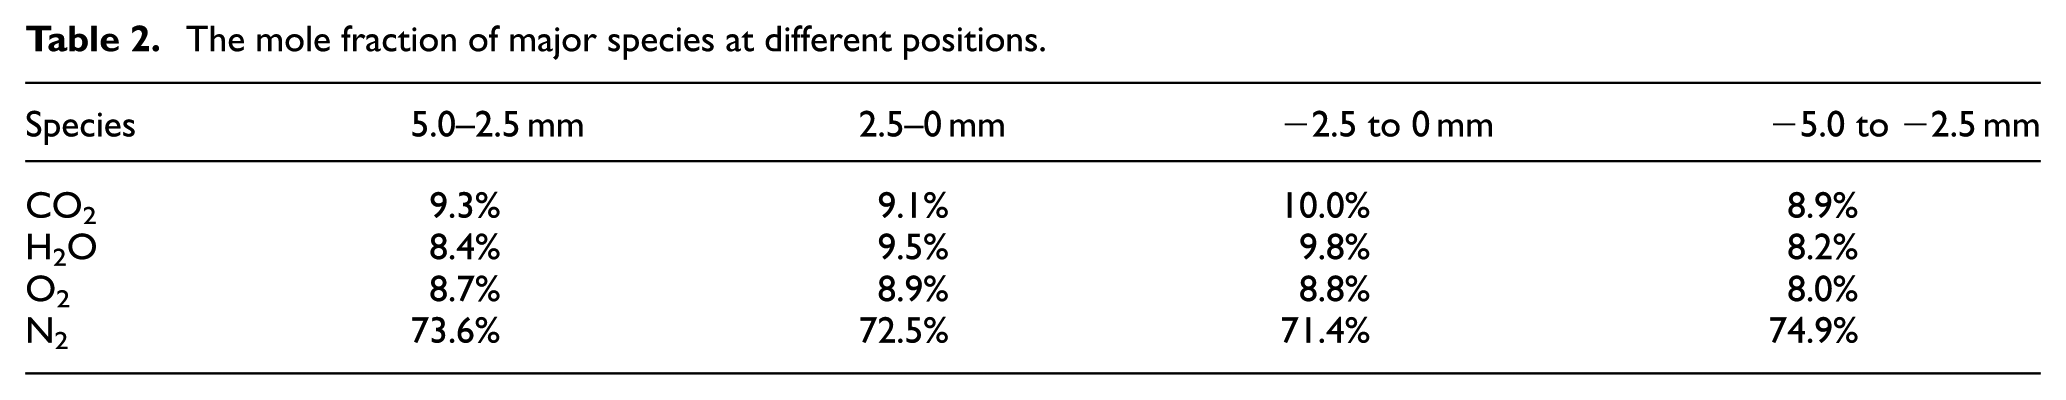
The two middle positions (2.5–0 mm and −2.5 to 0 mm) correspond to higher H2O mole fraction as well as low N2 mole fractions. Both CO2 and H2O reach its maximum value at −2.5 to 0 mm. This means that the combustion efficiency at −2.5 to 0 mm is higher than the other positions. The ideal combustion products for burning kerosene are CO2 and H2O, which should be in proportion if the final equilibrium state reaches. The mole fraction of CO2 and H2O does not vary proportionally for all the positions. It could be explained by the following: the equilibrium process is dominated by the three-body radical recombination reactions in the combustion zone. 12 The major products of kerosene combustion are only CO2 and H2O at low local equivalence ratios. It also includes CO when the local equivalence ratio is more than one. The CO2 production rate lags that of H2O because the CO is relatively slow to oxidize. Therefore, H2O reaches equilibrium state much sooner than does the CO2. Additionally, the mixing degree of fuel air varies dramatically with the spatial locations. Fluid particles in the hot region travel much faster than the fluid particles in the cold region.
Conclusion
PIV technique is utilized to measure the velocity field in a realistic aero-engine combustion chamber associated with a swirl cup. Velocity contours and streamlines in the primary zone are acquired in this work. The momentum and position of the primary jets have a strong impact on the size of the recirculation zone. The existence of spark plug in the annulus between the flame tube and combustion chamber casing considerably impact the primary jet penetration and flow features in the flame tube. The recirculation zone behind the top primary jet is much smaller than the bottom one.
This work demonstrates the successful application of SRS technique to measure the species distribution. Quantitative species measurement is achieved under the realistic combustion chamber conditions: 860 K, 5.50 bar, and equivalence ratio 0.27. The results clearly show that strong non-equilibrium and non-uniform distribution exists in the measurement zone. Much effort is in progress to apply the SRS technique to higher equivalence ratio conditions.
Footnotes
Acknowledgements
The authors deeply appreciate the collaboration with State Key Laboratory of Laser Interaction with Matter, Northwest Institute of Nuclear Technology, and China Aerodynamics Research and Development Center.
Handling Editor: Mustafa Canakci
Declaration of conflicting interests
The author(s) declared no potential conflicts of interest with respect to the research, authorship, and/or publication of this article.
Funding
The author(s) disclosed receipt of the following financial support for the research, authorship, and/or publication of this article: This work has been funded by the National Natural Science Foundation of China under grant 51576164.