
Abstract
For the friction and wear of the braking surface of the disc brake, the mechanism of friction contact deformation of rough surface is analyzed. Considering elastoplastic contact mechanics of the friction surfaces, combined with Archard wear calculation theory, a wear calculation model of fractal rough surface is established, and a wear life prediction of the brake disc is proposed. Based on high-speed and heavy-load braking conditions, the influence of different braking parameters on the surface wear of brake disc is studied. Moreover, a pin-on-disc wear test is used to verify the validity of the wear calculation model, and the average relative error of test and simulation is 4.97%. The research results show that the fractal parameters affect the complexity of the rough surface, and surface wear is mainly caused by interface plastic contact. The friction coefficient is large, which can strengthen the surface shear effect. Large load and high speed would increase the real contact area of the surface and increase the wear volume per unit time. Furthermore, the wear life of the brake disc could be estimated, which is of great significance for raising the wear life of the brake disc, improving braking life and braking efficiency.
Introduction
Disc brakes have the advantages of simple structure, high reliability and good braking efficiency, which are widely used in the fields of transportation, wind power generation, construction machinery, etc. As an important part of the braking system, the disc brake directly affects braking efficiency. Especially in high-speed and heavy-load braking conditions, severe friction and wear occurs at the braking interface, which makes surface wear analysis one of the research hotspots.
In braking conditions, brake friction pairs connect with each other, and the phenomenon of wear occurs under the action of friction. The changes in wear volume could reflect the service life of the disc brake, which makes wear calculations valuable. Based on the relationship between the wear volume and the wear process of friction materials, Tonn first established an empirical formula for wear. 1 Then Burwell, Strang, Archard, and Hirst put forward the theory of adhesive wear, which believed that wear was the process of material breaking and falling off.2–4 So far, the variables of wear calculation formulas considered by scholars have become more and more complicated with the continuous advancement of technology.
However, most of the wear calculation formulas are the expansion and modification of the classic Archard wear calculation formula. The research object is based on an ideal surface, so the influence of the randomness of the rough surface on the wear in the actual friction process has not been considered. Therefore, the study of rough surface wear has an important practical significance for revealing the objective laws of rough surface wear phenomena.
Due to the scale-independence of the fractal parameters, the fractal geometry is suitable for describing the characteristics of rough surface. Fractal parameters can effectively characterize the change of surface topography during the wear process. Yao et al. used the fractal parameters with scale-independence to characterize surface topography in the wear process by introducing the fractal theory, and developed the revised Archard wear calculation method, 5 which solved the problem that the adhesive wear constant is difficult to determine in Archard model. Qin et al. presented the methodology of determination of wear coefficient using the finite element method. The roughness of contact surfaces was characterized as fractal surfaces by the Weierstrass-Mandelbrot function, and the wear volume was calculated according to the solid-solid contact load. 6
A combination of adhesive wear and fatigue wear exists in many tribological applications. It is a matter of concern for the operation and safety of various systems. Gong et al. compared different model-based predicted results which showed the fractal dimension and wear rate have a strong positive correlation. 7 However, the hardness variation and inclusion of interaction between asperities in contact are not considered. Ciavarella and Papangelo discussed that the rough contacts of simulating an elastic multiscale contacted with fractal accurate models, and suggested that “plastic” and “adhesive” of rough contacts should be considered in the models of wear. 8 Wang et al. studied the contact behaviors of single asperities and rough surfaces, and found a new estimating method of fractal parameters based on a BP neural network model, so the values of the real contact surface, deformation volume, and rebounding volume on rough surfaces can be achieved. 9 Babici et al. found that the fractal function can describe the surface roughness. 10
It is vital to monitor the evolution of such a wear process through investigating the worn surface. Compared with traditional two-dimensional methods, three-dimensional measurements of worn surfaces can provide more information. Zuo et al. presented a new methodology of wear state recognition by using fractal parameters, multifractal parameters and recurrence parameters, which found fractal, multifractal and recurrence parameters could characterize the worn surface from different perspectives. 11 Xu et al. combined with the three-dimensional surface reconstruction and the computed fractal dimension, which could inspect the worn surface topography variations under sliding-rolling contact. It is more reliable to characterize the wear evolution by using fractal dimension than roughness parameters. 12
However, the true contact interface property is so crucial that it will affect macro-mechanical performance, such as friction, wear, assembly relation, fatigue strength, etc. The elastoplastic contact deformation of the surface asperities has a notable influence on the interface properties. Li et al. proposed a three-dimensional finite contact model considering the micro topography with the fractal theory in order to obtain the contact behaviors of linear sliding contact accurately. 13 Zuo et al. studied the dynamic evolution laws of surface in metal tribopair during the wear process by using monofractal and multifractal methods. 14 Lu et al. combined Weierstrass-Mandelbrot function (W-M fractal function) with traditional parameters to investigate the influence of surface texture distribution in respect to the procedure of pavement surface wear on friction performance, which could simulate the procedure of surface wear. 15 Paggi and He studied the dependency of the free volume between fractal rough surfaces in contact as a function of the real contact area and of the contact pressure by using the boundary element method. 16 Yuan et al. developed a revised elastoplastic contact model of a single asperity based on fractal theory, which provided a foundation for study of the friction, wear and seal performance of rough surfaces. 17 However, Müser and Wang found that true contact between solids with randomly rough surfaces tended to occur at a large number of microscopic contact patches. 18
In order to develop predictive wear laws, relevant material parameters and their influences on the wear rate need to be identified. Despite decades of research, there is no agreement on the mathematical form of wear formulas and even the simplest models, such as Archard model, contain unpredictable fit parameters. Brink et al. proposed a simple model for adhesive wear in dry sliding conditions. A novelty of the model was the explicit tracking of the sliding process, which connected particle emission rates and sizes to the macroscopic wear rate. 19
However, there is still no exact wear calculation model that could be applied to all wear cases because of difficulties connected with a variety of parameters involved in the wear process. One of the wear calculation methods is dealing with the calculation of rough surface peaks that make contact between two surfaces. Springis et al. considered the number of these peaks and applied the fatigue wear model under sliding-friction movement, which was possible to make the wear calculation of fitting under definite working conditions. 20
In the process of mechanical braking, the wear calculation of the brake is usually obtained by experiments to obtain empirical formulas, Zhang et al. studied the tribo-film by considering the evolution of substance and the wear mechanism on the friction contact surface of steel disc in the friction process. A series of pin-on-disc experiments were carried out, which aimed to simulate the characteristics of wear region on the steel brake discs. 21 Tavangar et al. discussed the fade and recovery and wear tests using thermal analysis, surface profilometer, and microstructural characterization techniques. 22 In practice, the disc and pad surfaces of the disc brake are rough surfaces. At the same time, the wear calculation considering the friction characteristics of the rough surface is not in-depth and needs further research.
In this paper, in order to calculate the wear depth of the real rough surface of the brake friction pair, the fractal theory describing the complexity of two-dimensional plane is introduced to characterize three-dimensional rough surface. Considering the comprehensive influence of the fractal parameters and the friction coefficient, the wear calculation model of the fractal rough surface is established, and the model could reflect the elastoplastic contact characteristics in the friction process. The wear laws of braking surface under different braking conditions are analyzed. Furthermore, under high-speed and heavy-load braking conditions, the prediction of the brake disc for wear life is calculated, which could reveal the wear mechanism of the brake friction pair during braking.
Wear calculation model of brake friction pair
Contact mechanical of brake friction pair
Friction and wear mainly cause the material failure of two contact surfaces with relative motion. The contact surfaces and material properties are important for friction and wear performance. In order to simulate the contact state of the actual friction interface of the brake friction pair, the rough surfaces with random characteristics are selected as friction surfaces. When the disc brake performs braking, the action of the braking load causes the brake disc and pad to be in contact with each other, and the friction resistance realizes the spindle stopping. During the braking process, the braking pair surface undergoes complex physical changes at the microscopic scale. Therefore, the contact process of braking surfaces can be regarded as the interaction of two rough surfaces, as shown in Figure 1.

Wear mechanism of rough surfaces: (a) contact process of rough surface and (b) wear types of rough surface.
As can be seen from Figure 1, the friction process of two rough surfaces can be divided into two parts: friction contact process and friction sliding process. From Figure 1(a), it can be seen that the asperities are in contact with each other under external load during the friction contact process, and the real contact area is smaller than the nominal contact area. A small number of the asperities are in contact with each other due to external loads, resulting in large stresses, which could lead to the occurrence of the stress concentration phenomenon. When the normal stress or shear stress exceeds the yield limit of the material, the asperity would undergo elastoplastic deformation, material damage, and destruction. As shown in Figure 1(b), during the friction sliding process, on the one hand, under the combined influence of normal force and friction force, the asperities occur deformation and plastic flow of materials, and the adjacent pits are filled up. The rough surface becomes smooth and the load-bearing capacity is strengthened, which improves physical properties of the rough surface. On the other hand, the plastic deformation of the asperity leads to a cold-welding effect in a local area, causing adhesive wear. At the same time, the wear debris and the third-body have collision and scratch effects on the rough surface during the friction process, which is abrasive wear. Wear causes surface damage, destroys the integrity of the surface structure, reduces the fatigue strength of the surface, and causes microcracks on the rough surface. Therefore, the wear of the roughness surface is mainly affected by plastic extrusion, adhesive wear and abrasive wear. The friction pair braking is a process of repeatedly acting on the surface, which causes the contact state of the rough surface to change with the braking process. The surface of the friction pair is rough at the first contact. Next, the surface of the friction pair is smoothed with braking, and the surface friction contact characteristics are improved. Furthermore, the degree of wear gradually slows down, the wear rate decreases, as well as topography characteristics and physical properties of the friction pair surface gradually stabilize.
Fractal characterization of rough surface
Fractal theory refers that the complex object could be partially enlarged, and the topography characteristics and complexity of the partially enlarged area is similar to the whole area. The fractal theory based on two-dimensional profile analysis is introduced into three-dimensional surface topography analysis in order to characterize rough surfaces with random features. The complex random rough surfaces constructed by fractal theory have the basic characteristics of fractal theory, as shown in Figure 2. After continuously enlarged, the local area and the whole area of the rough surface have similar characteristics, which reflects the self-similarity of fractal theory. That is, from the different views of space and time scales, the structure and characteristics of the rough surface with fractal characteristics are similar. Self-affinity is a special case of self-similarity. If the transformation ratio of the part to the whole in all directions is the same, it is a self-similarity transformation. If the transformation ratio is different, it is a self-affinity transformation. The scale-independent nature of fractal theory makes the topography characteristics, complexity and irregularity of the fractal rough surface unchanged after being enlarged or reduced, which can establish a connection between the part of the surface and the whole. Therefore, the fractal theory can be used to establish the surface of the friction pair and simulate the real rough surface with the characteristics of peaks and pits.

Rough surface with fractal features.
The change of the profile height of a rough surface with a certain roughness has the properties of randomness, scale-independent and self-affinity. W-M fractal function could be used to characterize rough surfaces. 23 However, the W-M fractal function is only limited to the rough surface profile representation on the two-dimensional level, and cannot express the variation of the rough surface on the three-dimensional scale. Yan and Komvopoulos derived the fractal function model of the three-dimensional fractal surface based on the W-M function, 24 that is:

where, z(x,y) is profile height of the rough surface, x and y are profile geometric coordinates, G is the scaling coefficient, and D is the three-dimensional fractal dimension, 2 < D < 3. γ is a parameter that determines the density of frequencies of the surface, and M denotes the number of superposed ridges used to construct the surface. L is the sample length, and Ls is cut-off length. n is the spatial frequency indexes, nmax is the highest frequency, nmax = int[log(L/Ls)/logγ]. nmin is the lowest frequency, nmin = int[log(1/L)/logγ]. φm,n is a uniformly distribute the values of random phase, φm,n∈ (0,2π). Therefore, based on the equation (1), the roughness surface could be established by MATLAB software. The arithmetical mean deviation of the profile is used to evaluate rough surface roughness:
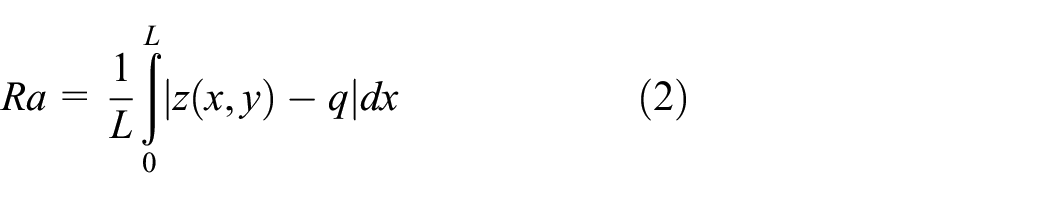
where, Ra is arithmetical mean deviation of the profile, q is mean height of contour peaks.
Generally, the initial surface roughness requirement of the brake friction pair is Ra = 3.2 μm, and the initial surface roughness requirement of the precision friction pair is Ra = 1.6 μm. Under the same friction condition that the other variables remain unchanged, the roughness of the rough surface is positively correlated with the fractal dimension. Combining equation (1), different fractal dimensions can be used to characterize rough surfaces with different roughness, as shown in Figure 3. The increase in the fractal dimension raises the height amplitude of the rough surface profile, which leads to the increase in the surface roughness. In addition, the fractal dimension can change the complexity of the rough surface. The large fractal dimension could lead to the high complexity of the rough surface texture structure and the large difference, which promotes the increase in the surface roughness.

Three -dimensional rough surface profile with different fractal dimensions (G = 1 × 10⁻⁴, M = 10, L = 1 × 10⁻⁴, Ls = 1 × 10⁻⁶, γ = 1.5): (a) D = 2.290 and (b) D = 2.423.
Wear calculation model for fractal rough surface
Elastoplastic contact of rough surface asperity
The brake friction pair of the disc brake is composed of the brake disc and pad. The surface topography of the brake friction pairs changes during braking, so that the surface profile is in a dynamic change process. The actual rough surface is composed of peaks and pits, and the contact of surface asperity has discrete characteristics. For two asperities in contact with each other, the contact interaction can be divided into two mechanical actions: elastic contact action and plastic contact action. Based on the Hertz contact theory, 25 taking a sphere model with an axisymmetric shape as an example, the elastoplastic deformation of the asperity contact is analyzed, as shown in Figure 4. Under the external load Wb, the asperity produces a normal deformation depth δ, and the asperity undergoes elastoplastic deformation. Where, an is the nominal contact area, ar is the real contact area, and R is the curvature radius of the asperity.
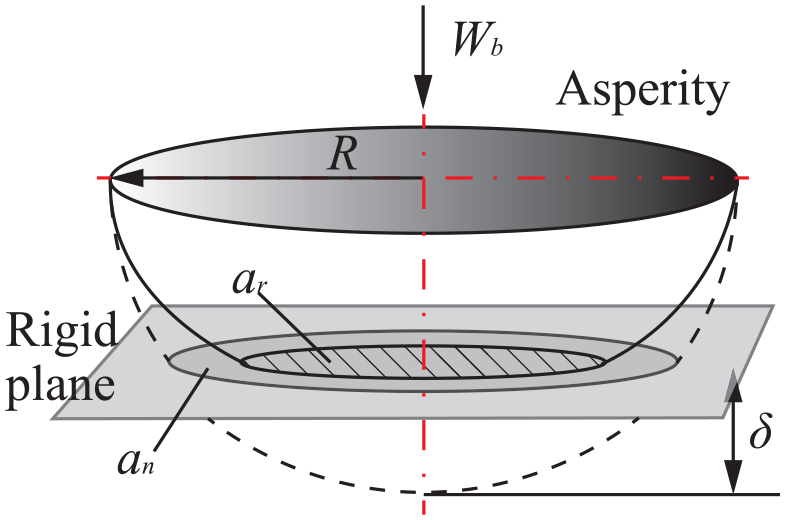
Elastoplastic deformation of asperity.
Under the action of external load Wb, the asperity deforms from elasticity to plasticity. When the normal deformation depth δ is greater than the critical deformation δs, the maximum real contact area of the asperity is greater than the critical real contact area, that is, al > ac. Based on the friction fractal theory,26,27 considering the relationship between the real contact area when the asperity deforms plastically and elastically, the real contact area can be expressed as:

where, Ds is the two-dimensional fractal dimension, Ds = D−1; σs is the yield limit of the material being worn out; E is the equivalent modulus, which can be calculated from the Poisson’s ratio and Young’s modulus of the friction pair material, that is:

where, E1 and E2 are the Young’s modulus of the friction pair. ν1 and ν2 are the Poisson’s ratio of the friction pair. Ψ is the domain expansion factor, the relationship between Ψ and Ds can be expressed as:

In the actual contact process of rough surface, the contact forms of asperity include elastic contact, elastoplastic contact, and plastic contact, making the contact forms of rough surface extremely complicated. Ignoring the elastoplastic transient conversion process of asperity, the contact deformation of asperity is divided into elastic deformation and plastic deformation. Assuming that the surface of the worn part as a deformable body, the relative friction surface is regarded as a rigid plane, as shown in Figure 5. When the asperity is in contact with the rigid plane, part of the asperity is in an elastic deformation state. Therefore, the normal deformation is less than the critical deformation, that is δe < δs. The elastic real contact area is smaller than the critical real contact area, that is ae < ac. Part of the asperity contact is in a state of plastic deformation, and the normal deformation is greater than the critical deformation, that is, δp > δs. The plastic real contact area is smaller than the critical real contact area, that is, ap > ac. In addition, factors such as external load and material properties would affect the normal deformation of the asperity and the change of the real contact area, resulting in different contact states of the asperity under different friction environments.
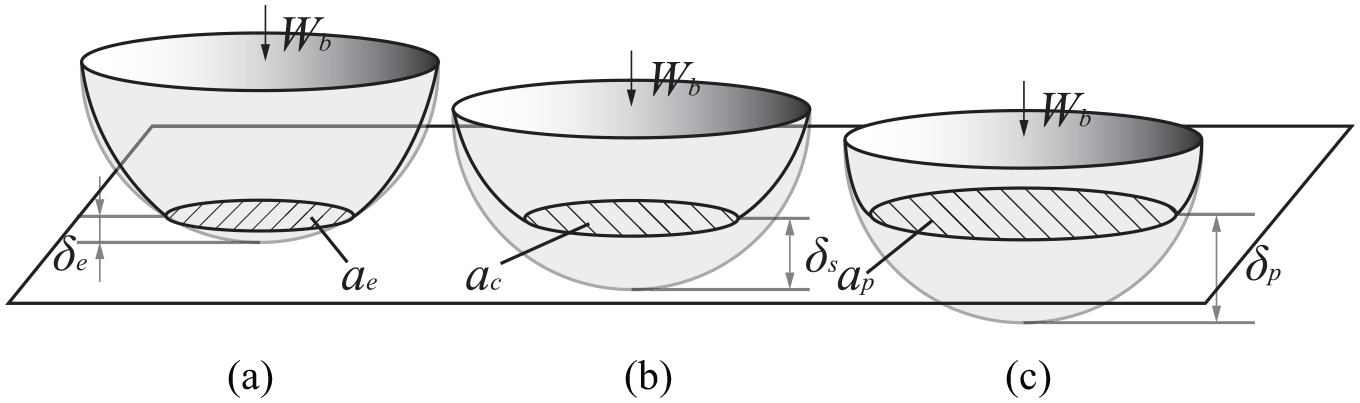
Illustration of asperity elastoplastic contact mode: (a) the elastic contact, (b) the critical contact, and (c) the plastic contact.
Considering the braking method of the disc brake friction pair, the braking load is an external load. Assuming that the elastoplastic material is an ideal material, the relationship between the real contact area and the load can be expressed as the relationship between the elastoplastic deformation force and the contact area, and the following equation can be expressed as:

where, σy is the strength limit of material deformation. Then the friction coefficient μ is:
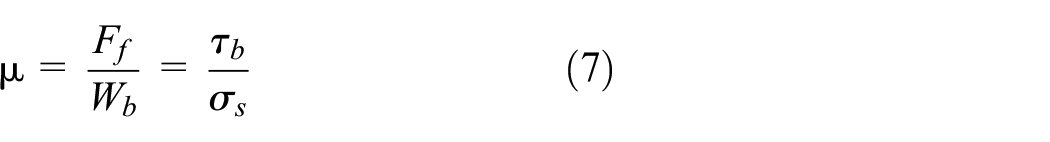
where, Ff is friction force, τb is the shear strength limits of the material being worn out. However, the contact stress state of the asperity is complicated. In the sliding friction process, the normal force causes the normal stress, and the friction force causes the shear stress, both of these stresses exist at the same time. Therefore, combined with the normal force and the friction force, the action of both forces could affect the actual real contact area of the asperity and the deformation form of the contact point. According to the modified adhesion theory, 28 assuming that the strength limit of material deformation represents the deformation resistance of the material, and the relationship between normal stress and shear stress can be expressed as:
where, λ is constant. When the contact form is in static friction state, the stress at the contact point is only normal stress at this time. When the contact form is in dynamic friction state, with the increase in shear stress, the contact area becomes large and the influence of normal force becomes small. Then, in the extreme case, only the shear stress is considered for the stress at the contact point, that is:

Then substituting equations (7) and (9) into equation (8), there can be expressed as:

Equation (10) can be explained as: when there is effect of friction force at the friction interface, if the normal stress or shear stress reaches the strength limit, the friction material would yield and produce plastic deformation.
Modeling for wear calculation model
Different from the strength check, the strength calculation focuses on the condition that the material does not damage, but the wear calculation is essentially to evaluate the characteristics of the failure process. Studies have shown that the wear mechanisms in the braking process mainly include abrasive wear and adhesive wear. These two wear mechanisms cause the wear volume to be proportional to the sliding distance and external load, and inversely proportional to the yield strength of the wear material, which is the Archard wear calculation model, 29 that is:

where, Vwear is the wear volume, kw is the wear coefficient, and S is the sliding distance.
Combining equations (6)–(11), the wear calculation equation considering friction contact can be obtained, that is:

The elastic deformation and plastic deformation of contact rough surfaces occur simultaneously in the friction process, and the number ratio of the two deformation conditions of asperity changes in real time, which affects the surface wear state. Therefore, the wear coefficient is related to the contact surface topography. Dividing the wear coefficient kw into elastic wear coefficient kwe and plastic wear coefficient kwp, the equation (12) can be changed into:

Generally, rough surface wear is mainly caused by plastic contact, that is kwe << kwp. Therefore, the change of the elastic wear coefficient kwe has little effect on the wear, and the change of the plastic wear coefficient kwp has a major impact on the wear.
Combining equations (3)–(12) into equation (13) can be expressed as:
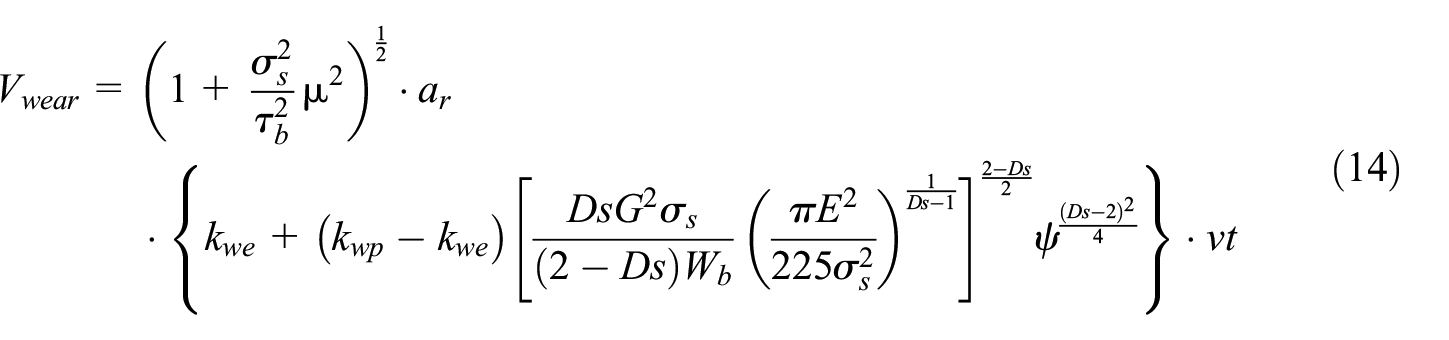
Assuming the average wear depth of the rough surface as:

substituting equation (14) into equation (15), the average wear depth expression can be obtained as:

where, a* is the dimensionless contact area, a* = ar/an. Then, the average wear rate can be expressed by the change in average wear volume per unit time:

During the friction process of the fractal rough surface, the average wear depth, average wear volume and average wear rate can be calculated using equations (14)–(17), respectively, and then evaluate and predict the wear state of the surface.
Wear characteristics of fractal rough surface
In fact, the wear of the brake friction pair is a kind of surface damage phenomenon. It can be seen from equations (14)–(17) that fractal parameters and wear coefficients are important factors affecting the wear rate of rough surfaces. Furthermore, the research method adopts the method of numerical simulation. MATLAB has the advantage of allowing matrix operations, function and data plotting, algorithm implementation, and more. Therefore, the MATLAB software is used as the computing platform, and the numerical simulation program based on the wear equations is written in the MATLAB assembly language. The initial parameters involved are as follows. Taking the friction pair composed of copper-based powder metallurgy and E355CC (ISO) as an example, the material to be worn is selected E355CC (ISO), then σs = 345 MPa, Rm = 600 MPa, σs/τb = 9, a* = 1 × 10⁻⁶, Wb = 552 Pa, and v = 0.60 m/s2. The mechanical properties of the studied materials are presented in Table 1. The wear characteristics during friction process with rough surface are studied.
Mechanical properties of the friction pair.

Considering the influence of the change of the elastic wear coefficient kwe and the plastic wear coefficient kwp on the wear of the rough surface, a numerical analysis is carried out to obtain the change curves of the wear rate, as shown in Figure 6. During the wear process, the elastic wear coefficient and plastic wear coefficient affect the surface elastic contact area and plastic contact area. With the decrease in the elastic wear coefficient and the plastic wear coefficient, the average wear rate shows a downward trend. When the elastic wear coefficient decreases from kwe = 1 × 10⁻² to kwe = 1 × 10⁻⁶, the change of the average wear rate is maintained at the same order of magnitude. Meanwhile, when the plastic wear coefficient is constant and kwe < 0.1 kwp, the average wear rate is almost not affected by elastic contact wear. From Figure 6(a), the wear caused by elastic contact accounts for a small proportion in the actual real wear process. When the plastic wear coefficient increases from kwp = 1 × 10⁻⁵ to kwp = 1 × 10⁻¹, the wear rate rises. And every time the plastic wear coefficient increases by an order of magnitude, the average wear rate also increases by an order of magnitude. It shows that the wear caused by plastic contact accounts for a large proportion in the actual real wear process, as shown in Figure 6(b).
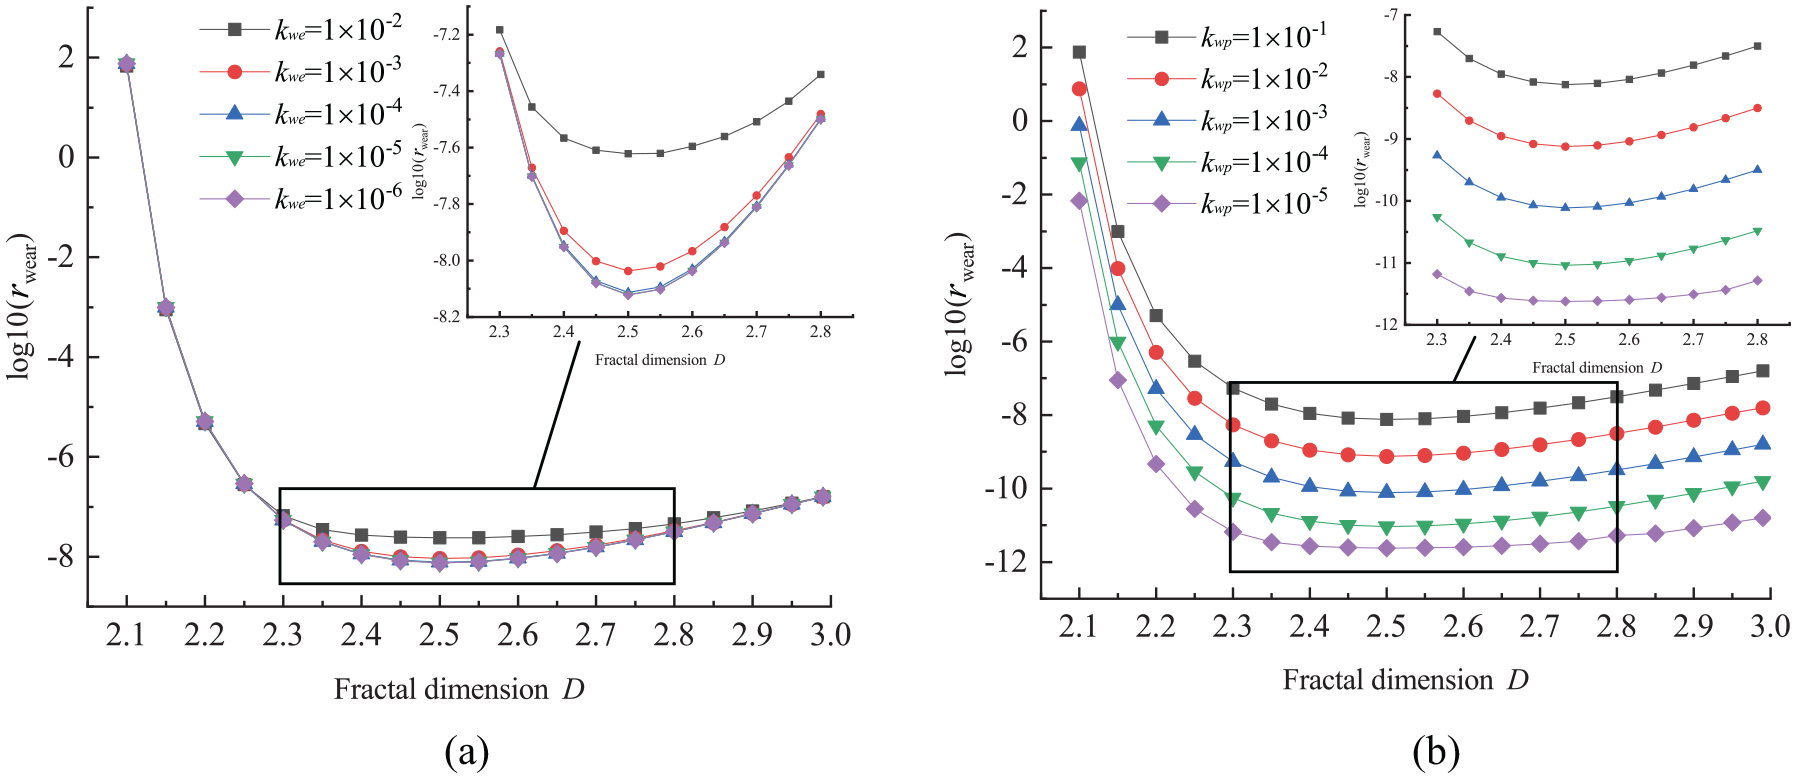
Effect of wear coefficient on wear rate: (a) elastic wear coefficient and (b) plastic wear coefficient.
Through the analysis of the influence laws of the wear coefficient on the average wear rate, it can be known that the main factor causing the wear of the fractal rough surface in the wear process is the plastic contact action of the rough surface, and the elastic contact action has little effect on the wear. Therefore, the plastic wear coefficient kwp = 1 × 10⁻¹ and the elastic wear coefficient kwe = 1 × 10⁻⁴ are selected to analyze the influence of different fractal parameters on the average wear rate, as shown in Figure 7. According to fractal theory, fractal parameters describe the complexity of the rough surface. From Figure 7(a), with the increase in the fractal dimension, the change of the average wear rate decreases firstly and then increases. When the fractal dimension D = 2.1, the peaks and pits structure of the rough surface is relatively simple, and the difference in surface topography is not obvious. These lead to an increase in the number of contact asperities in similar contact states during the contact process of the rough surfaces, lead to an increase in the supporting capacity of the rough surface, and lead to an increase in the friction area, resulting in a high wear rate. When the fractal dimension D = 2.9, the rough surface structure is extremely complicated, and the peak of the surface asperity fluctuates greatly. Consequently, there is a phenomenon that the height of some individual peaks is large, which are firstly worn during the contact process. Therefore, the average wear depth per unit time is fast, and the wear rate is high. However, the number of abnormal peaks is small, and the cumulative increase in wear value per unit time is small, so the increase in the average wear rate is not obvious.
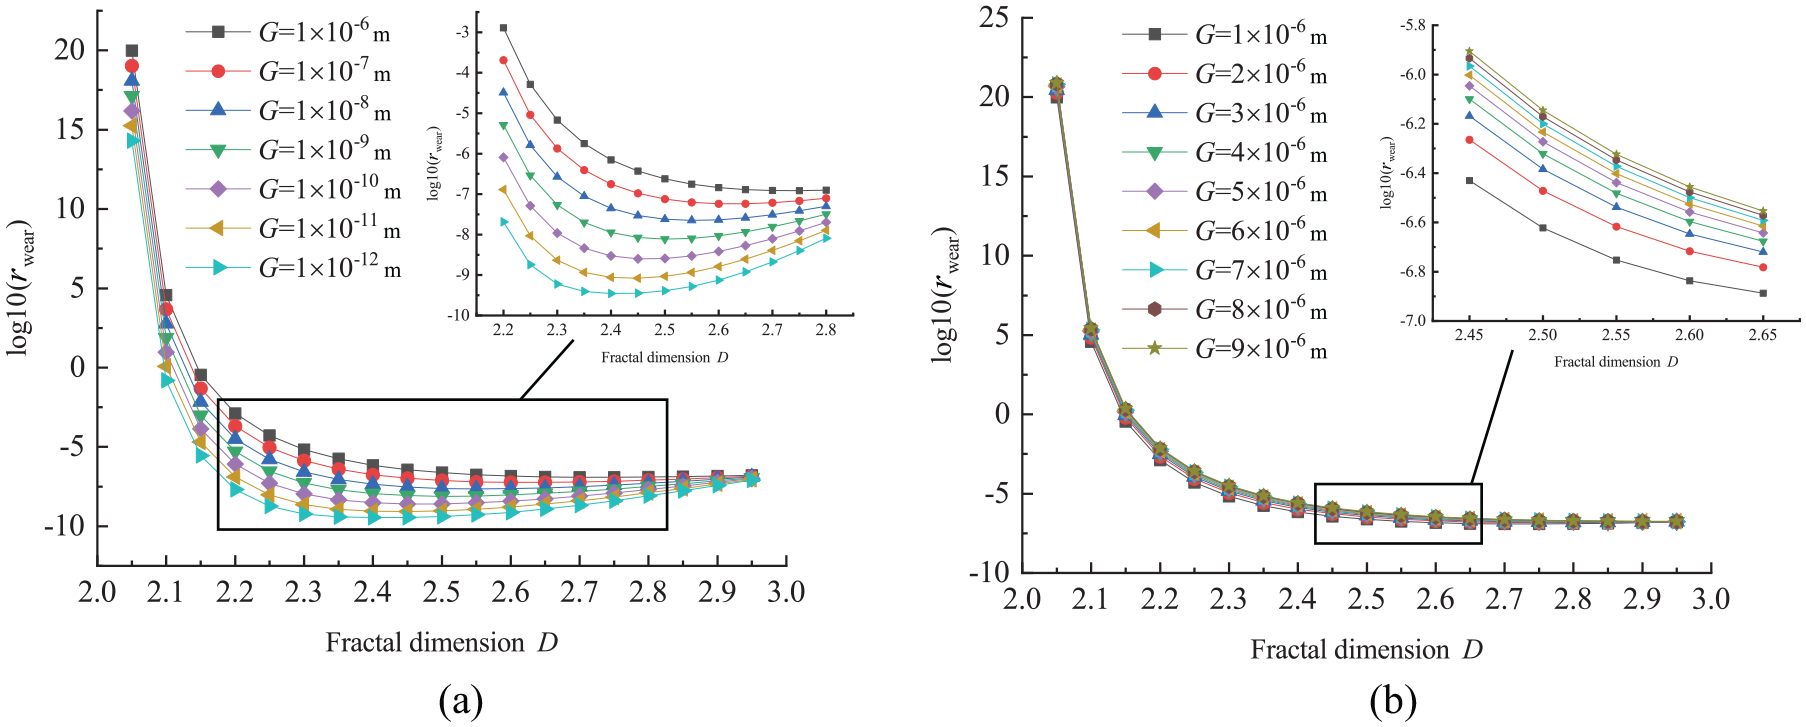
Effect of fractal parameters on wear rate: (a) scaling coefficient (1 × 10⁻¹²~1 × 10⁻⁶ m) and (b) scaling coefficient (1 × 10⁻⁶~9 × 10⁻⁶ m).
The scaling coefficient limits the peak range of the asperity on the rough surface. From Figure 7(a), with the increase in the scaling coefficient from G = 1 × 10⁻¹² m to G = 1 × 10⁻⁶ m, the average wear rate also rises. Figure 7(b) shows that the fractal dimension is small, the influence of the scaling coefficient on the average wear rate is great. From the critical area equation (2), it can be seen that the increase in the scaling coefficient would lead to large plastic deformation, which in turn increases the average wear rate. However, when the fractal dimension is large, the difference of asperities on rough surface is large, which weakens the effect of the scaling coefficient. This is the main reason that abnormal peak wear increases the average wear rate.
By analyzing the influence of fractal parameters on the average wear rate, it can be known that the fractal dimension changes the complexity of the rough surface, and the scaling coefficient controls the observation scale of the rough surface. Taking account of the braking friction pair with an initial roughness of 3.2 μm in the actual braking process as an example, the initial wear coefficient and fractal parameters in the wear process include the plastic wear coefficient kwp = 1 × 10⁻¹, the elastic wear coefficient kwe = 1 × 10⁻⁴, the scaling coefficient is G=1 × 10⁻⁶ m, and the fractal dimension is D = 2.29.
Wear life prediction model of brake disc
Taking the brake disc surface wear of a disc brake as an example, the main influence factors of the brake disc surface wear in the actual braking process are the initial braking load P, the initial braking speed v and the braking interface friction factor μ. In addition, through the analysis of the wear calculation model, it can be known that the wear calculation of the friction pair surface is affected by the fractal parameters of the rough surface. Considering that the braking process of the friction pair of the disc brake is a deceleration motion, equation (15) can be deduced as:

where, n0 is the initial braking speed, R is the braking radius, t0 is the braking time. Therefore, considering the influence of braking parameters and fractal parameters at the same time, the expression of the wear volume of the brake disc surface under the parameter state can be obtained as:

As shown in Figure 8, the friction contact area between the brake disc and pad is the wear area, and the wear area can be expressed as:


Schematic diagram of wind power disc brake (R1 = 375 mm, R2 = 245 mm).
Then the average wear depth of the brake disc can be expressed as:

Under high-speed and heavy-load braking conditions, friction could produce frictional heat. Considering the influence of frictional heat and other external factors on surface wear, the wear safety factor S0 is defined. Therefore, assuming that the maximum average wear limit of the brake disc is H0 and the number of braking is N, the wear life of the brake disc can be expressed as:
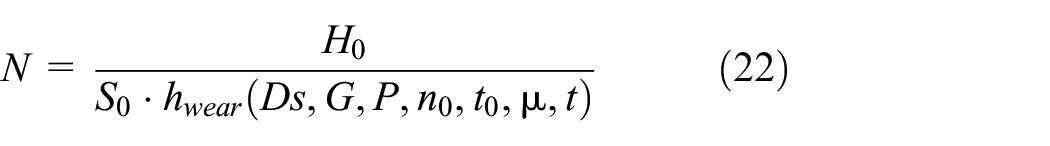
Equation (22) can predict the number of braking of the brake disc under a certain braking condition to ensure that the disc brake can be in normal working condition, and can predict the wear change of the friction pair, which could provide theoretical support for the wear life of the disc brake friction pair.
Pin-on-disc wear test
Test setup
A pin-on-disc wear test rig was designed to investigate the wear behavior of the test samples. In order to realize the wear test between different friction pairs, the system software can monitor the test process in real time and record test parameters and curves through computer control technology and modular data acquisition communication technology. During each wear cycle, the disc rotates at a constant velocity driven by a motor, as shown in Figure 9. The sample pin used in this test was copper-base powder metallurgy material, and the material of disc was E355CC (ISO). The dimensions of the pin and disc are shown in Figure 10. Before the pin-on-disc wear testing, the samples were ground up with 1200 grit paper to achieve a roughness of 3.2 μm. After processing, all test samples were cleaned in ethyl alcohol and then dried with compressed air.

Schematic of pin-disc wear test.

Dimensions of the pin and disc.
Numerical simulation and experimental verification
The pin-on-disc wear test is used to study the wear laws of the friction interface under the rough surface friction condition, and reveal the influence of load and speed on the wear performance of the friction pair. The controlled variable method is used to design the friction conditions, the load as 10, 30, and 50 N and the speed as 250 and 500 r/min are selected, as shown in Table 2. In addition, the surface fractal parameters used in the numerical simulation are given: initial fractal dimension D0 = 2.5, G = 1 × 10⁻⁴, and M = 10.
Friction parameters for friction conditions.

Before the pin-on-disc test, the surface of the pin and disc should be cleaned with brush to ensure clean friction surfaces. In order to measure the change of the wear depth of the surface each time, an external metal block is added as the original surface as a reference. The reference plane is used to fit the wear depth. Therefore, it is necessary to scan the three-dimensional surface topography before and after wear to obtain the height value of the surface topography. The difference values between all points of the sample length before and after wear is calculated, then the average value of all points difference values is calculated. the average value of the measurement points is taken as the average wear value.
Load and speed are the main factors that affect the wear state of the friction interface. The working conditions in Table 2 are selected to carry out the pin-on-disc wear test and numerical simulation for the surface wear of the friction pair. Through the data results analyzed, the change curves of the average wear depth of the friction pair surface are obtained, as shown in Figure 11. In the wear process, the elastoplastic deformation of the surface asperities in contact with each other produces a real contact area, and the area with small real contact area has large contact stress. When the contact stress exceeds the strength limit of the material, the asperities are damaged and fractured.

Comparison wear depth results of test and numerical simulation.
In the case of a fixed rotation speed, when the load is increased from 11 to 50 N, the average wear rate of the disc surface becomes large, and the average wear depth rises. This is because during the friction process of the rough surface, the increasing load results in a large number of contact pairs and a large contact pair size of asperity, which increases the real contact area of the disc surface and causes the average wear rate to change. That is, the average wear depth per unit time rises with a large load. When the speed is 250 r/min, the increase in the real contact area of the disc surface is small, so that the average wear rate changes little during the friction process. When the speed is 500 r/min, the amplitude of the average wear rate of the disc surface increases greatly. The reason is that the mutual squeeze of the friction surface is intensified, the surface contact points easily occur shear failure, and the fast relative movement speed raises the average wear depth per unit time.
Under the same load conditions, it can be found that the wear change caused by the speed is small when the load is low. When the load is high, the speed increases and the degree of wear depth becomes large. This is because the increase in speed not only strengthens the shear effect and squeezing effect on the rough surface, but also strengthens the centrifugal force of the test disc, making it easy for the wear debris to be discharged from the wear interface. Meanwhile, the wear distance of the pin and disc per unit time becomes longer, which aggravates the wear of the rough surface. When the load is low, the real contact area of the friction interface is small. The increase in speed makes the average wear depth per unit time not much different. The increase in load causes the actual real contact area to become large. At this time, the increase in speed makes the average wear depth per unit time increase significantly.
By analyzing the results of the pin-on-disc wear test and numerical simulation, it is found that the absolute error range between the numerical simulation and the pin-on-disc wear test results is 2.67 × 10⁻⁴∼1.26 × 10⁻³ mm, and the maximum relative error is 8.37%, the minimum relative error is 1.57%, the average relative error is 4.97%, as shown in Figure 12. The average wear depth obtained by the numerical simulation calculation is similar to the experimental measurement results, and the change laws of the average wear rate is the same. That is, the surface average wear rate of the friction pair gradually decreases over time during the wear process. When the load and the speed is low, the friction force on the friction pair surface is small, the initial average wear rate of the friction pair surface is low, and the attenuation amplitude of the average wear rate is small. When the load and the speed is high, the friction effect on the friction pair surface is strong, and the initial average wear rate of the friction pair surface is high. During the entire wear process, the attenuation amplitude of the wear rate is large. The validity of the numerical simulation model is verified, so the wear calculation model can be applied to actual production for wear prediction and estimation.

Error curves of test and numerical simulation.
Analysis of wear laws in factual braking condition
Effect of braking parameters on brake disc
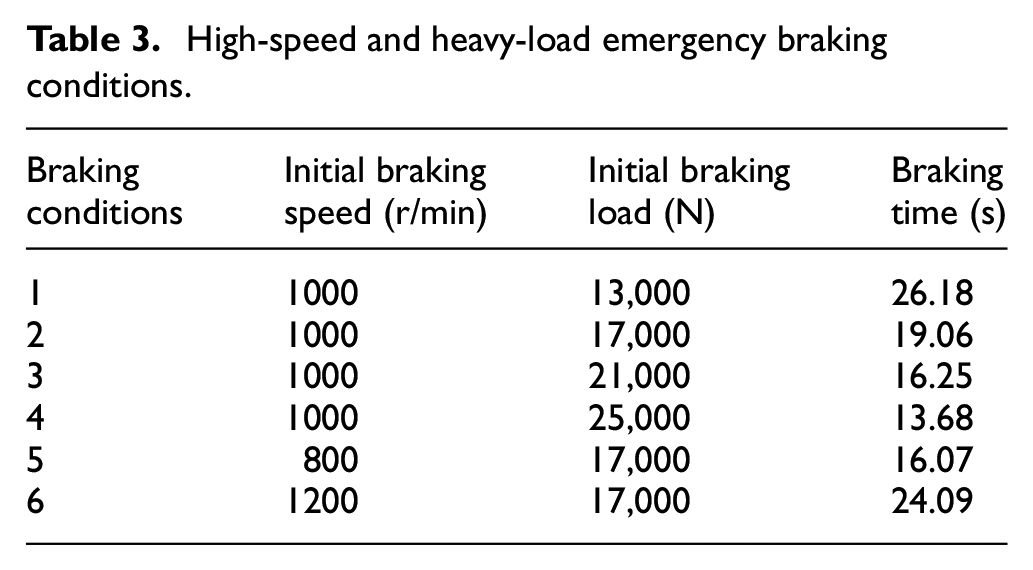
For high-speed and heavy-load braking conditions, the contact surfaces of the brake disc and pad of the disc brake have elastoplastic contact, and the severe friction causes wear phenomenon. The wear value of the brake disc is less than that of the consumable brake pad. During the braking process, the metal on the brake disc surface would undergo plastic flow of the material under the action of the load, which causes the adhesion phenomenon at the contact of the asperity. Affected by the shear effect, the adhesion point is destroyed, resulting in the wear of the material. Combined with the emergency braking conditions of wind power disc brake, the simulation conditions are designed, as shown in Table 3. E355CC (ISO) is selected for brake disc material, copper-based powder metallurgy is selected for brake pad material. Numerical simulation of wear calculation based on high-speed and heavy-load braking conditions is carried out, and the influence of braking parameters on the wear volume of the brake disc surface can be obtained.
High-speed and heavy-load emergency braking conditions.
Effect of initial braking load on brake disc
During the braking process of the disc brake, the initial braking load is applied to ensure the braking performance of the disc brake, but large load would cause the wear of the braking surface, as shown in Figure 13.

Effect of initial braking load on wear volume: (a) wear results of braking process and (b) fitting curve of wear results.
It can be seen from Figure 13(a) that the increase in the initial braking load shortens the braking time, but the average wear volume increases. The wear volume increases rapidly in the initial stage of braking, and the accumulation speed of wear volume gradually slows down with braking. This is because the load can affect the friction state of the interface through the size of the contact area and the deformation state. For rough surfaces machined by conventional methods, friction always occurs in the asperities that are partly in contact with each other, resulting in the uneven contact of the friction pair in the initial stage of braking. At this time, the asperities with the large peak height of the local area of the rough surface are in contact with each other to cause stress concentration, which leads to plastic deformation of the asperity and high average wear rate of surface. Furthermore, the matching degree of the friction pair surface gradually increases during braking, the real contact area also increases gradually. Consequently, the surface contact stress decreases, which reduces the friction effect of the brake surface and reduces the wear of the brake surface.
Counting the average wear volume at the end of braking under different initial braking load conditions, the polynomial fitting curve is shown in Figure 13(b). With the increase in the initial braking load, the increased amplitude of the average wear volume is similar. It can be seen from equation (19) that the formation of surface wear is affected by many factors. The load can determine the number and size of the contact points of the surface asperity, so a large load can increase the real contact area of the surface. According to the material elastoplastic deformation criterion, when the real contact area of the asperity is smaller than the critical value, the asperity contact is in an elastic contact state. When the real contact area exceeds the critical value, the contact state of the asperity changes from elastic contact to plastic contact. Furthermore, the material could cause plastic fracture and damage, and the wear of the braking surface is severe. The increase in load shortens the braking time, reduces the total contact area of the friction pair during braking, and weakens the wear of the braking surface. Therefore, affected by many factors, the surface average wear rate changes little, and the average wear volume increase rate is stable.
Effect of initial braking speeds on brake disc
The sliding speed can change the interaction and failure conditions of the surface during the friction process. The curves of wear volume are shown in Figure 14.

Effect of initial braking speed on wear volume: (a) wear results of braking process and (b) fitting curve of wear results.
As shown in Figure 14(a), under the same load, the initial braking speed is high, the braking time is long, and the average wear volume of the surface wear is large. The rate of the wear volume at high-speed stage is large, and the average wear volume at low-speed stage increases slowly. This is because when the speed is high, the kinetic energy of the brake disc is large, the energy conversion per unit time is high, and the interaction of the rough surface is strengthened. Therefore, the surface material easily reaches its strength limit, and causes plastic deformation and damage, resulting in increased wear. In the later stage of braking, the friction area per unit time is small with decreasing speed. The amount of damage caused by the contact of the asperity on the braking surface is small, and the wear rate of the braking surface is reduced.
Counting the average wear volume at the end of braking under different initial braking speed conditions, the polynomial fitting curve is shown in Figure 14(b), and the average wear volume becomes nonlinearly larger as the speed increases. The initial braking speed determines the accumulative speed of average wear volume per unit time. When the initial braking speed is high, the kinetic energy of the braking system is large, and the braking time is long under the same load, which leads to an increase in the total contact area of the friction pair during the braking process and a large accumulation of wear volume. Meanwhile, when the speed is high, the surface friction effect is severe. A variety of factors promote surface wear together, which makes the surface average wear rate increase, and the average wear volume exhibits a significant non-linear growth.
Effect of friction coefficient on brake disc
The influence of friction coefficient on the surface of the brake disc is researched, in order to be able to control the braking friction process and reduce the braking wear. The friction coefficient is the comprehensive characteristic of the friction pair system. When two kinds of material metals have a friction effect with each other, the friction coefficient would tend to a certain stable value. Taking the friction pair of a disc brake as an example, the friction coefficient ranges from 0.25 to 0.35. The influence of friction coefficient on surface wear during braking is analyzed, as shown in Figure 15.

Effect of friction coefficient on wear volume.
Under the same braking conditions, when the friction coefficient of the braking interface is large, the braking time is short, so that the total average wear volume of surface is small. Before the braking time 9 s, the rotation speed is similar, and the wear is mainly affected by the friction coefficient. The surface average wear rate increased with the friction coefficient raised. However, After the braking time 9 s, the braking speed is different, and the wear of the braking interface is mainly affected by the speed. The surface average wear rate decreased with the friction coefficient raised. In addition, friction coefficient has a small effect on surface wear in the early stage of braking, and has a large effect on surface wear in the later braking. According to classical physics, the friction coefficient is the ratio of the normal force to the shear force. The large friction coefficient leads to the strengthening of the shear effect in the contact process between the brake disc and pad, and the surface material easily causes shear damage. That is, the large friction coefficient promotes the wear of the braking surface. However, the relative movement of the braking interface during braking decreases sharply, and the average wear volume per unit time at low-speed stage is small. That is, the decrease in the braking speed can reduce the average wear rate of the braking surface. It shows that when the speed is the same, with the increase in the friction coefficient, the wear of braking surface can be aggravated. When the speed is different, the friction coefficient has a small effect on the wear but the speed has a large effect. In addition, the small friction coefficient results in low braking efficiency on the surface of the friction pair, prolongs the braking time, and increases the total wear of the entire braking process. Therefore, in the braking process, friction coefficient not only affects the braking time, but also changes the friction characteristics of the braking surface and affects the wear state of the contact surfaces. Moreover, combined with the actual braking demand, the friction coefficient is not as large as possible, and needs to be controlled within a certain range.
Wear life prediction of brake disc
Taking the emergency braking condition of a high-speed and heavy-load wind turbine as an example, using the braking conditions in Table 3, assuming that the maximum average wear limit is 0.3 mm in braking, and the wear safety factor is 0.85. Combined with equation (22), the emergency braking wear life of the high-speed and heavy-load wind turbine can be obtained. According to design specifications and actual operating experience, the emergency braking time of the wind turbine generator is not more than 5% of the total lifetime of the generator. Therefore, the theoretical life of the brake disc in this example is shown in Table 4.
Theoretical wear life of brake disc.

Based on the theoretical wear life in Table 4, a polynomial fitting method is used to fit the theoretical wear life data under different working conditions, the equations are:
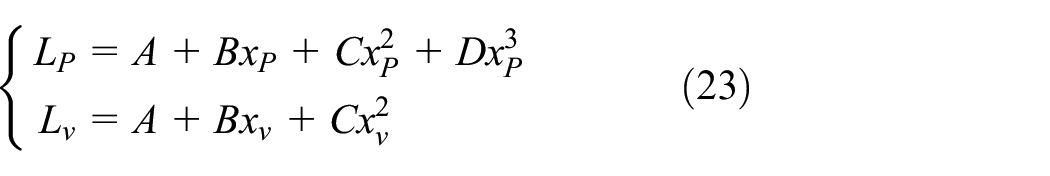
where, LP is the life of the brake disc when the initial braking speed is 1000 r/min, xP is the initial braking load, Lv is the life of the brake disc when the initial braking load is 17,000 N, and xv is the initial braking speed. A, B, C, and D are polynomial coefficients. After numerical fitting calculation, the specific parameters are shown in Table 5, and the prediction curves of brake disc wear life is shown in Figure 16.
Parameters of fitting wear life prediction formula.


Wear life prediction curves of brake disc: (a) fitting curve of load and (b) fitting curve of speed.
Under high-speed and heavy-load braking conditions, the increase in the initial braking load and the initial braking speed would reduce the wear life of the brake disc. However, the wear life curve of the load change is obviously non-linear, and the slope of the wear life curve caused by the speed change is small. This is because the large load can increase the number of contact asperities and the interface wear area, resulting in a rapid decline in the wear life. When the number of contact asperities reaches the maximum, the increase in interface wear area is mainly caused by the transformation from elastic contact effect into plastic contact effect, and the wear life decreases slowly. The increase of the rotational speed makes the relative movement of the brake friction pair fast, which enhances the interaction of contact asperities, and the material is prone to plastic deformation, which reduces the wear life. Therefore, through predicting the wear life of the brake disc under high-speed and heavy-load braking conditions, which can provide a theoretical basis for the design of the brake disc and provide theoretical guidance for the daily maintenance of the brake disc.
Conclusions
Aiming at the influence of real rough surface on the wear of brake friction pair, considering the elastoplastic deformation mechanism of asperity contact, the wear calculation model based on fractal theory is established, and a wear life prediction equation is proposed. Combined with the pin-on-disc wear test, the influence of fractal parameters on average wear rate is analyzed. Furthermore, under the high-speed and heavy-load braking condition, the effect of braking parameters on the wear of braking disc is studied, and wear life prediction of brake disc is calculation. The specific conclusions are as follows:
The wear coefficient affects the real elastoplastic contact area during the wear process, and the occurrence of wear is mainly caused by plastic contact of the asperity. The fractal dimension and scaling coefficient determines the complexity of the rough surface. With the fractal dimension from D = 2.1 to D = 2.99, the wear rate decreases sharply first and then rises slightly, and the average wear rate increases with scaling coefficient from G = 1 × 10⁻¹² m to G = 1 × 10⁻⁶ m. The small fractal dimension makes the scaling coefficient have little influence on the wear rate.
From the numerical simulation and the test, the relative error range of the average wear depth results are obtained. The maximum relative error is 8.37%, and the minimum relative error is 1.57%. The change trend of the wear rate corresponds very well, which verifies the validity of the numerical wear calculation model. In addition, the wear process of rough surfaces is affected by friction parameters. Large loads increase the real contact area of rough surfaces, and high speed can aggravate the interaction of surface contact, which makes wear more serious.
The large initial braking load aggravates the plastic contact area and intensifies wear, and the high initial braking speed improves the average wear volume per unit time. Under high-speed and heavy-load braking conditions, when the initial braking load is 13,000 N and the initial braking speed is 800 r/min, the wear volume is small. With the increase in the friction coefficient from 0.25 to 0.35, the average wear rate also increases.
According to the average wear volume of a single brake, the wear life prediction of the brake disc is calculated under different braking conditions. Meanwhile, the nonlinear fitting curves of wear life are carried out, which could predict the wear life of the brake disc.
Footnotes
Handling Editor: Chenhui Liang
Declaration of conflicting interests
The author(s) declared no potential conflicts of interest with respect to the research, authorship, and/or publication of this article.
Funding
The author(s) disclosed receipt of the following financial support for the research, authorship, and/or publication of this article: The authors gratefully acknowledge the financial support of National Natural Science Foundation of China (No. 51675075), Scientific Research Project of the Education Department of Liaoning Province (No. LJKZ0479), and Key R&D Program of Liaoning Province (No. 2019JH2/10100033).