
Abstract
There is an increasing scholarly and humanitarian interest in research involving older refugees, marking a notable departure from the historical marginalisation of this demographic within both academic literature, practice, and policy discourses. Despite this emerging focus, there remains a significant gap in the documentation and critical evaluation of methodological approaches tailored to the unique needs and experiences of older refugee populations. While our overarching study explored the social network and support experiences of 11 older African refugees in Calgary, Canada, through a participatory study, this paper presents methodological reflections and insights from the study. The research employed a combination of visual diagramming tools, including timelines and ecomaps, and oral storytelling to explore co-researchers’ migration journeys and evolving social support systems. We advance that these methods facilitated richer, more nuanced articulations of personal narratives, enabling co-researchers to visually and verbally map the complexities of their displacement experiences and their relational networks. We also critically examine the limitations of these approaches, particularly the challenges associated with interpretation and the potential dilution of narrative depth. This paper aims to inform future research design involving older refugees and similarly marginalised groups.
Introduction
As global populations of older adults continue to rise—particularly in regions experiencing high levels of violence, climate disruption, and other crises—so too does the number of older individuals subjected to forced migration (United Nations Department of Economic and Social Affairs, 2019). Older refugees, defined as forced migrants aged 60 years and over (UNHCR, 2015), constitute approximately 4% of the global forced migrant population (Barbelet, 2018; United Nations High Commissioner for Refugees [UNHCR], 2000). While UNHCR (2015) defines older refugees as international migrants over the age of 60, we follow the convention of other migration scholars (Cummings et al., 2011; Kuittinen et al., 2014) who argue that forced migration predisposes people to the early onset of age-related health and socio-economic conditions, and thus age 50 is considered to be the cutpoint to define older refugees. This group faces a multitude of intersecting health, nutritional, and psychosocial challenges exacerbated by poverty, inadequate access to services, and the cumulative stress of displacement (Burton & Breen, 2002; Ekoh et al., 2022; Ekoh & Walsh, 2024a). The migration process itself can be particularly traumatic for older adults, intensifying pre-existing vulnerabilities (Ajibade et al., 2017; Ekoh et al., 2025). As such, a growing body of research has emerged to address the unique needs of this underserved and under-researched demographic (Barbelet, 2018; Ekoh & Chukwuemeka, 2023).
In 2023, the United Nations High Commissioner for Refugees (UNHCR, 2023) reported that there were an estimated 29.3 million refugees among the 117.2 million forcibly displaced individuals globally. The demographic composition of Calgary mirrors broader global trends in migration and population ageing. Although precise statistics on refugees within the city are unavailable, Immigrant Services Calgary (2024) estimates that over 400,000 immigrants currently reside in Calgary. The city’s population of adults aged 65 years and older has also risen markedly—from 138,405 to 177,405 between 2016 and 2021, representing a 28% increase (The City of Calgary, 2021). This demographic shift reflects a global phenomenon in which an increasing number of older adults experience the intersection of ageing and forced migration (Ekoh & Chukwuemeka, 2023; Ekoh & Okoye, 2022; UNHCR, 2020).
Older refugees often encounter age-related discrimination in employment (Wang et al., 2017), which compounds barriers to meeting basic needs such as food, housing, and healthcare. These challenges are further exacerbated by frailty, physical limitations, and mental health difficulties (Taylor et al., 2005; Woodgate et al., 2017). Despite their heightened vulnerability, the experiences of older refugees have historically received limited scholarly and humanitarian attention (Barbelet, 2018). While recent studies have begun to address this gap, the specific experiences of older African refugees remain significantly underexplored. Existing research frequently treats older refugees as a homogenous category, thereby neglecting the historical, sociocultural, and structural contexts that uniquely shape the vulnerabilities and resilience of older African populations in migration contexts. To address the knowledge gap in research on experiences of older African refugees, especially those who migrate to Western countries and to advance research methods for this population, our main study employed visual diagramming and traditional African storytelling to explore the social networks and support experiences of older African refugees in Calgary, Canada. Again, very little is known about the process, challenges, and potential associated with using innovative methods such as diagramming and storytelling for research with this population. Hence, this paper presents our reflections and insights from co-research on adopting diagramming and storytelling for research with older African refugees.
However, conducting research with older forced migrants requires sensitivity in terms of both ethics and methodology. Data collection can be emotionally demanding and carries the risk of re-traumatisation (Seagle et al., 2020). To mitigate these risks—including disempowerment, emotional distress, and language barriers—art-based and participatory methods such as photovoice, storytelling, music therapy, visual art, and diagramming have been recommended (Abkhezr et al., 2018; Ekoh & Sitter, 2023; Ekoh & Walsh, 2024a; Umoquit et al., 2008). These methods provide a more accessible and empowering means for older refugees to express complex emotions and share their lived experiences, while also fostering resilience and reducing emotional harm (Ekoh & Walsh, 2024b).
Guided by a critical constructivist paradigm, which foregrounds the interplay of power and knowledge and values multiple ways of knowing critical for participatory research (Prior, 2018; Steinberg, 2014), we have previously advocated for the integration of visual methodologies—including ecomaps and timelines—in refugee research (Ekoh & Sitter, 2023; Ekoh & Walsh, 2024a). We argued that critical paradigm and participatory research can amplify the voices of vulnerable and marginalised groups (Ekoh & Sitter, 2023). Such tools have proven effective among other vulnerable populations, including children and those facing cultural or linguistic barriers (Kolar et al., 2015), and hold similar promise for work with older refugees. While our earlier contributions have been largely theoretical, this paper builds on that foundation by documenting the practical application of visual methods—specifically diagramming and storytelling—in research with older African refugees in Canada. Drawing on empirical insights from participants in our study, which explored the social networks and support experiences of older African refugees, we critically reflect on the affordances and limitations of these approaches in capturing the complexity of migration experiences and social support systems among older displaced populations.
Visual Diagramming as a Data Collection Method
Visual methods in research have their intellectual foundations in post-positivist paradigms, developed to challenge traditional power hierarchies between researchers and participants (Umoquit et al., 2013). While relatively new to qualitative research, visual approaches—especially diagramming—have gained increasing attention for their utility in generating rich, participant-driven data (Umoquit et al., 2008). Diagramming, a key form of visual methodology, is emerging as a powerful tool within health and social science research (Bagnoli, 2009; Umoquit et al., 2013). It involves the use of visual sketches to represent thoughts, experiences, and emotions, thereby facilitating communication that may be constrained by verbal or written language (Bravington & King, 2019).
Diagramming can be implemented in three general formats: participant-led, researcher-led, or co-created. In participant-led diagramming, individuals construct their own visual representations, while in researcher-led models, the researcher translates the participant’s input into visual form. Co-creation involves a collaborative process in which both the researcher and participant jointly construct the diagrams (Prosser & Loxley, 2008). The focus of diagramming lies not in artistic quality but in the depth and clarity of the information conveyed (Bagnoli, 2009; Scherer, 2016). It is a low-cost, accessible technique that requires minimal training and uses basic materials such as paper, coloured markers, and stickers (Umoquit et al., 2013).
Diagramming has proven particularly effective in contexts involving participants who face language barriers, cultural differences, limited formal education (Husbands et al., 2020; Mayoux, 2003), social marginalisation (Patterson et al., 2012), or trauma (Hollway & Jefferson, 2013; Kolar et al., 2015). As a gentle and non-intrusive tool, it facilitates discussions of emotionally sensitive topics with a reduced risk of re-traumatisation (Crilly et al., 2006), while simultaneously fostering critical thinking, emotional articulation, and reflexivity (Gauntlett, 2007; Prosser & Loxley, 2008). Importantly, it positions participants as knowledge producers or co-creators, enhancing agency and ownership in the research process (Goldenberg et al., 2016).
Diagramming is highly adaptable and can be used to examine a broad range of social phenomena. Concentric circles are used to map social networks at a given point in time or over time (Ekoh & Sitter, 2023). The Pictor technique is a visual method used in research interviews to help participants describe their experiences with collaborative working, especially in health and social care (King et al., 2013). Allows for the exploration of multidisciplinary support systems (Bravington & King, 2019). Additionally, tools such as ecomaps and genograms effectively capture relationship dynamics and structures (Umoquit et al., 2008). Timelines, often used to document life histories or migration trajectories (Pell et al., 2020), and mind maps, which examine intersecting vulnerabilities (Wheeldon & Ahlberg, 2017), further illustrate the versatility of this method. Diagramming can be employed in conjunction with other qualitative approaches, such as interviews, observations, narrative analysis, and focus groups, to generate layered and nuanced data (Bravington & King, 2019).
In our study, we adopted a multimodal visual strategy that combined two diagramming techniques—timelines and ecomaps—with storytelling to explore the social support networks and migration histories of older African refugees. Each of these methods is further elaborated in the following sections.
African Storytelling in Research
Storytelling, the practice of conveying knowledge, experiences, and cultural memory through narrative, has long served as a powerful epistemological and pedagogical tool across disciplines. It provides profound insights into the cultural, historical, social, and lived experiences of individuals and communities. In Indigenous contexts, including many African societies, storytelling predates formal Western education systems and has functioned as a primary mode of informal education for both children and adults (Edosomwan & Peterson, 2016). It has been employed not only to transmit cultural values and life skills but also to explore themes of spirituality, wellness, and philosophy (Achebe, 1958; Ben-Amos, 1967; Pointer, 2021).
A distinct tradition within this broader practice, African storytelling emerges from the continent’s rich oral heritage (Cancel, 2013). It has increasingly been recognised as a culturally resonant and decolonising research methodology, particularly in work involving African and African diasporic populations (Cancel, 2013; Chilisa, 2012; Osei-Tutu, 2022). This approach aligns with African worldviews that emphasise communal knowledge, intergenerational learning, and relationality. As such, storytelling can offer more expansive and culturally congruent avenues for participants to articulate their experiences, often in ways that transcend the limitations of conventional interview techniques (Banks-Wallace, 2002; Nelson et al., 2016).
African storytelling also facilitates more equitable power dynamics between researcher and participant by fostering collaboration, co-construction of meaning, and participant agency in the research process (Chilisa, 2017; Mama, 2013). Rooted in orature, it enables the communication of complex or traumatic narratives through metaphors, proverbs, analogies, and spiritual references, providing both psychological safety and cultural authenticity (Rwafa, 2015). Older Africans, often esteemed as custodians of cultural wisdom, may more readily engage through this form of storytelling, drawing on elements such as imagery, parables, and riddles (Finnegan, 2012; Obiechina, 1993; Okpewho, 1992). Moreover, storytelling may hold therapeutic potential, offering a cathartic outlet and promoting resilience (Nelson et al., 2016). The process of narrating one’s story, being listened to, and seeing one’s life mapped visually had an affirming and at times therapeutic quality, echoing Abkhezr et al.’s (2020) findings that narrative research can border on psychosocial intervention for displaced populations.
Importantly, African storytelling is not monolithic. It encompasses diverse techniques that vary by region and culture, including narrative tales, songs, poetry, tongue twisters, trickster tales, ceremonial recitations, and fireside dialogues (Mirzeler, 2020; Osei-Tutu, 2022). Researchers using this method must therefore approach it with cultural humility and contextual awareness, tailoring their approaches to the specific storytelling traditions of the population in question. In our study, which explores the social networks and support systems of older African refugees in Calgary, Canada, we integrate traditional oral storytelling, a preferred approach by the older African refugees, with visual diagramming techniques. This multimodal approach is designed to support narrative depth, cultural congruence, and participant empowerment. The diagramming tools used, including timelines and ecomaps, are further discussed in the following section.
Context, Research Materials and Methods
Context and Positionalities
While this article focuses on methodological reflections and insights, our overarching research question sought to understand the social network and support experiences of older African refugees living in Calgary. The study emerged from the intersecting positionalities of the two researchers. As the first author, I am a Black immigrant scholar and gerontological social worker, a descendant of African displaced persons whose family has experienced violence-related migration. My professional practice with older displaced individuals in Nigeria and my lived experience in Canada shaped my sensitivity to issues of belonging, ageing, and displacement. I approached this research as both an insider and outsider—connected through shared histories yet mindful of the distinct realities of those who migrated later in life.
The second author, a White settler scholar and professor of social work, contributed extensive experience in research on ageing and migration in Canada. Her mentorship guided the study’s conceptual and methodological grounding. Our differing social locations and perspectives fostered an ongoing reflexive dialogue, enabling a more ethical, culturally responsive, and critically engaged exploration of older African refugees’ lived experiences.
Methodology
Our study adopted Heron and Reason’s (1997) participatory paradigm, which positions participants as co-researchers—co-creators of knowledge and active agents of social change (Schneider, 2012). It is important to note that, while this is a participatory study, participants’ chosen level of engagement is an expression of self-determination and autonomy. Hence, similar to the experiences of other scholars (Cooke & Kothari, 2001; Khan, 2020), our participants wanted to generate textual and visual data, provide feedback on the analysis, and develop a short animation that tells the story of their experiences.
In alignment with this epistemological stance, from here onwards we refer to all participants in this study as co-researchers. A combination of purposive and network sampling (also known as snowball sampling), which involved interviewed co-researchers connecting us with other potential co-researchers (Palinkas et al., 2015), both non-probability techniques, was employed to recruit co-researchers. This approach was necessary considering the established difficulties in recruiting refugees for research (Bilecen & Fokkema, 2022). While we reached out to more than 20 potential co-researchers, only 11 participated in the study. This is not surprising, given that trust and mistrust of researchers have been significant barriers to recruiting older adults from some immigrant groups (Bilecen & Fokkema, 2022). However, this sample size provided sufficient data and is consistent with those used in prior studies grounded in participatory research (Bravington & King, 2019; Wheeldon & Ahlberg, 2017). We engaged 11 older African adults who had migrated to Canada at or after the age of 50 and had resided in Calgary, Alberta, for a minimum of one year. Individuals who migrated at a younger age were excluded, as they may have had greater opportunities to integrate linguistically, economically, and socially, which would influence the research focus on later-life migration. Ethical approval was received from the Institutional Review Board before commencing recruitment.
To ensure linguistic inclusivity, two professional interpreters, fluent in Somali and Kinyarwanda, respectively, were engaged to facilitate participation among nine co-researchers who were not proficient in English. The first author conducted all data collection. Data collection was conducted in three phases. The first two phases involved individual face-to-face storytelling sessions lasting 31-58 minutes. In addition, a timeline and an ecomap were completed in the first and second phases, respectively. The third and final phase consisted of three face-to-face group sessions, each lasting an average of 34 minutes. Our preliminary analysis was presented to the co-researchers in this phase of the study to ensure truthfulness and trustworthiness, as described in the section on trustworthiness.
In the first phase, co-researchers created migration timelines while narrating their migration experiences via storytelling. A visual sample template, developed by the lead researcher, was provided as an illustrative guide. Seven timelines were co-created with the assistance of either family members or interpreters; the co-researchers drove the co-creation process. Three co-researchers are constructing their timelines independently. In all cases, co-researchers guided the content as they narrated significant milestones and experiences. In the second phase, co-researchers developed ecomaps to illustrate their social networks and support systems, accompanied by related narratives. It is important to note that some of the co-researchers wanted to co-create the diagrams with interpreters with whom they had prior relationships (n = 5), with their children present during the interviews (n = 3), or with the researcher (n = 1). Only three co-researchers chose to lead the diagramming independently. The third and final phase involved member-checking: co-researchers were invited to review and reflect on preliminary analyses to ensure interpretive accuracy and resonance with their lived experiences. Given the communal nature of African families (Appiah, 2021), many family members dropped in during the storytelling sessions in the first two phases and during the group discussion in phase 3. To ensure the co-researchers’ voices are prioritised, we informed family members of the need to centre the voices of the older refugees.
Data analysis employed both conventional and innovative strategies. All narratives were audio-recorded and transcribed verbatim by professional transcribers fluent in the co-researchers’ languages. Employing transcribers fluent in the co-researchers’ language was necessary to minimise data loss during translation of the interviews. We expunged all family members’ voices that were mistakenly recorded to ensure the co-researchers’ voices are maintained. The lead researcher reviewed each transcript for accuracy, cross-referencing audio files and resolving any transcription gaps using detailed field notes. The final transcripts were imported into NVivo 14© for data management and coding. The first author, under the guidance of the second author, employed narrative thematic analysis to analyse the qualitative data (Patterson et al., 2012). We chose narrative analysis because of its alignment with the participatory paradigm, as both approaches share epistemological commitments to preserving the stories, voices, and agency of marginalised and vulnerable groups in the co-construction of meaning (see Colla & Kurtz, 2024). An inductive coding approach was adopted, with no pre-existing codebook or analytical framework. Initial codes were generated through deep immersion in the narratives and were subsequently clustered into broader thematic patterns. A coding hierarchy was developed, comprising parent, child, and grandchild nodes—for example, the grandparent node “post migration network and support” encompassed the child node “network composition” which in turn included the grandchild nodes “family, friends and Faith Based Organisation (FBOs)” (see Figure 1 for a sample of the coding hierarchy). An iterative process of thematic refinement followed, with constant comparison across narratives to identify emerging insights, contradictions, and relationships. Sample of our coding hierarchy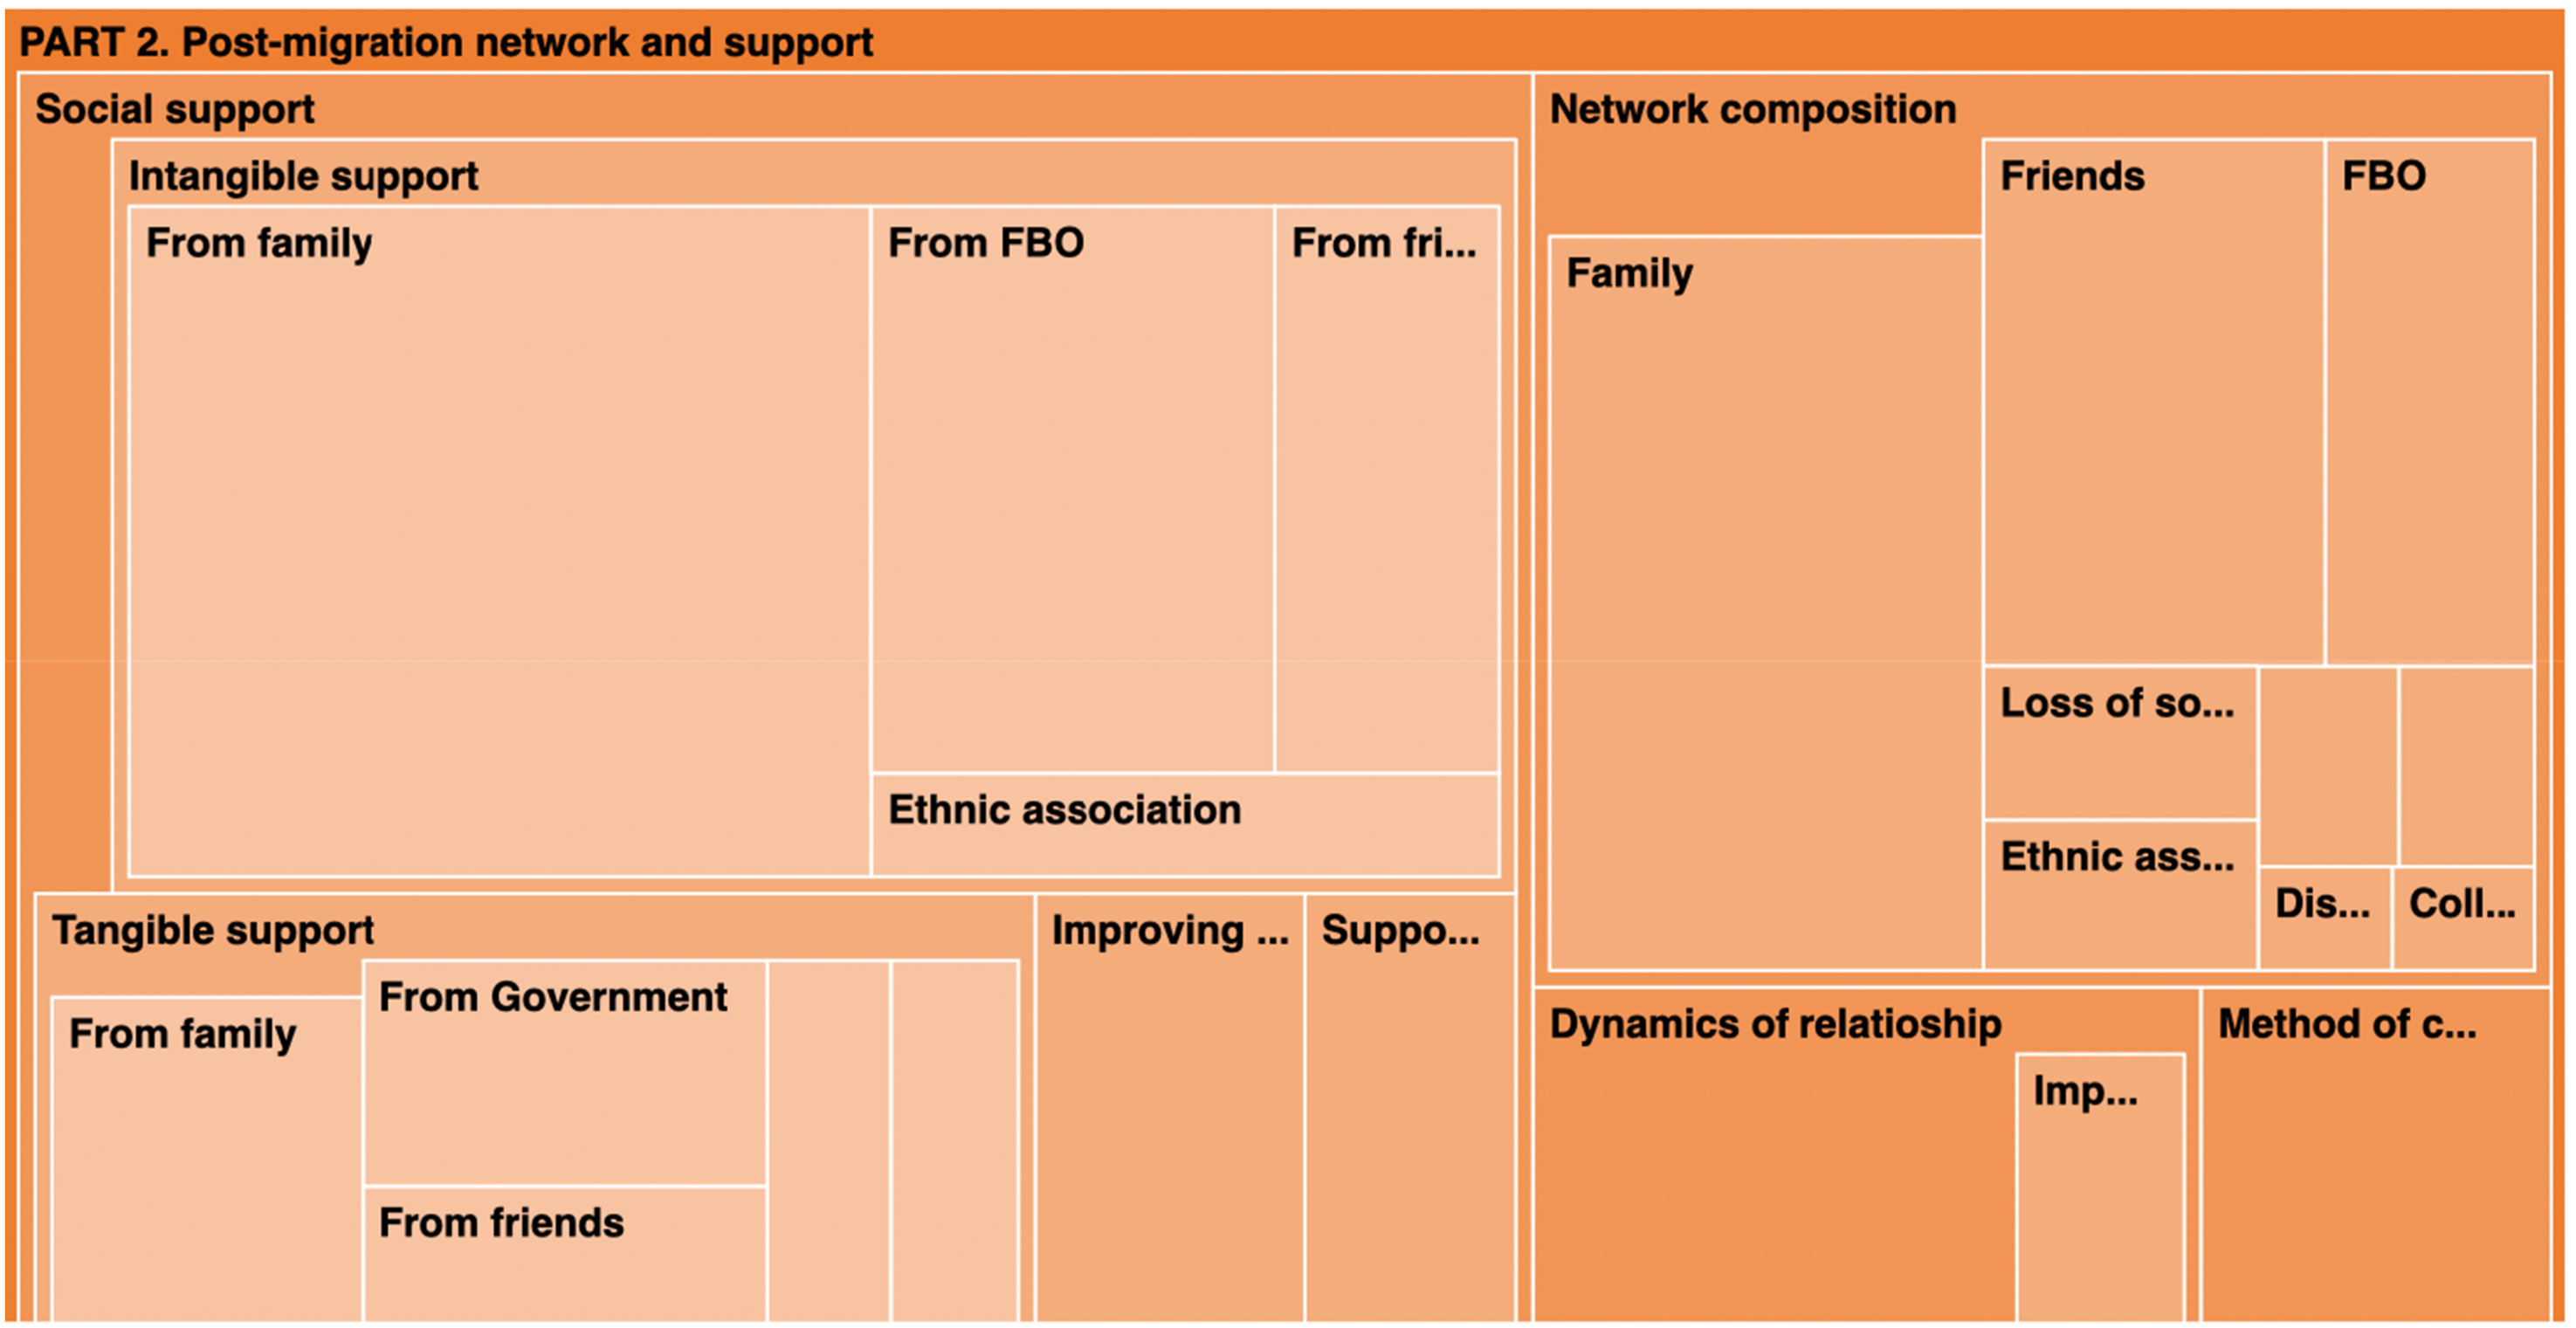
Visual data (timelines and ecomaps) were analysed using a case-based, interpretive approach informed by Goldenberg et al. (2016). Each diagram was examined for key data points, contextual relationships, and significant life events. The analysis of visual data (timelines and ecomaps) followed a systematic, case-based interpretive approach that was closely integrated with narrative analysis and grounded in participatory co-research principles. Rather than treating diagrams as illustrative artefacts, we analysed them as standalone data sources that both complemented and extended co-researchers’ narratives.
Firstly, during data collection, co-researchers explained the meanings of visual elements they used—including colours, line types (solid or broken), directionality, thickness, spatial positioning, and symbols—using keys that they either created themselves or adapted collaboratively with the research team. These explanations were audio-recorded and treated as integral analytic data rather than post hoc clarifications. Secondly, Visual elements were coded systematically using a structured coding framework that attended to the following features: colour (e.g., red, green, blue) to indicate emotional valence, relational tension, or type of connection; line type (solid vs. broken) to distinguish sustained versus fragile or intermittent relationships; line thickness to signal perceived strength or intensity of ties; spatial proximity and positioning (central vs. peripheral placement) to indicate relational importance. Thirdly, visual and narrative data were analysed side-by-side and iteratively. Codes derived from diagrams were placed alongside narrative codes within the same analytic matrices, allowing us to examine convergence, divergence, and elaboration across data forms. This approach enabled us to see not only what co-researchers said but also how relational dynamics were spatially and symbolically represented. For example, one co-researcher used a red solid line to represent a virtual relationship with an adult son, explaining that the colour signified emotional strain while the solidity reflected regular communication. In contrast, a broken green line was used to represent sporadic material support received from a network member. Comparative analysis across diagrams enabled the identification of shared patterns, divergences, and trends. The integration of visual and narrative data enabled a deeper interpretation, with findings grounded in both textual excerpts and co-researchers-generated visuals. The final themes are presented using illustrative quotes and diagrams to enhance credibility and analytic depth.
Trustworthiness
We strengthened the trustworthiness of our analysis through iterative dialogue and cultural grounding. Guided by the Africentric canon of Ukweki (truth), the process moved beyond conventional notions of objectivity toward principles of honesty, fairness, and relational truth (Dudu & Majoko, 2022). This epistemological stance ensured that the interpretation of the data authentically reflected the co-researchers’ lived experiences while addressing potential researcher bias or misrepresentation. Through collective review in the final session, co-researchers clarified and refined specific narratives and engaged in critical discussion of emerging themes, thereby enhancing credibility and confirmability (Birt et al., 2016).
Findings
All co-researchers participated in the two phases of the research, which included storytelling and diagram creation. However, only nine out of the 11 co-researchers took part in the final phase, which involved presenting a preliminary analysis and gathering feedback from the co-researchers. Three co-researchers indicated a lack of interest in the last phase of the study.
In the following section, we summarise how the storytelling and diagramming processes were instrumental in enabling co-researchers to convey their migration experiences, as well as their social networks and sources of support. The next theme delves into the co-researchers’ reflections on these data collection methods. Finally, we address our insights on the methods, including the challenges and limitations encountered.
Co-researcher Demographic Characteristics

Using Storytelling and Diagramming to Illustrate Migration, Social Network, and Support Experience of Older African Refugees
This theme presents a snapshot of the co-researchers’ migration journeys and social network post-migration. This theme does not provide detailed findings from the study; rather, it presents empirical illustrations of how co-researchers engaged with the study methods and the nature of the data they produced. This discussion provides vital contextual grounding for understanding the study and illuminates how co-researchers interacted with and interpreted the methodological approaches employed.
Depicting Migration Journeys With Timelines and Storytelling
In the first phase of the data collection, Co-researchers took various approaches: some offered intricate details, including specific events, travel companions, border crossings, time spent in various locations, and modes of transportation; others focused on places of refuge before reaching Calgary. The timelines reveal that most co-researchers recall their migration journey broadly, while fewer recall the dates of specific events and the exact duration of their stays in some transit destinations.
Figure 2 presents a collage of the diagrams that illustrate the migration paths of the co-researchers, shedding light on the complex and challenging journey they experienced. On average, the co-researchers resided in four temporary settlement camps and traversed two international borders. Zola’s timeline reveals that she stayed in the highest number of temporary settlements, totalling nine, while Abiba, Amari, and Kiange crossed the most international borders, with each of them crossing three. Collage of co-researchers’ migration journey timelines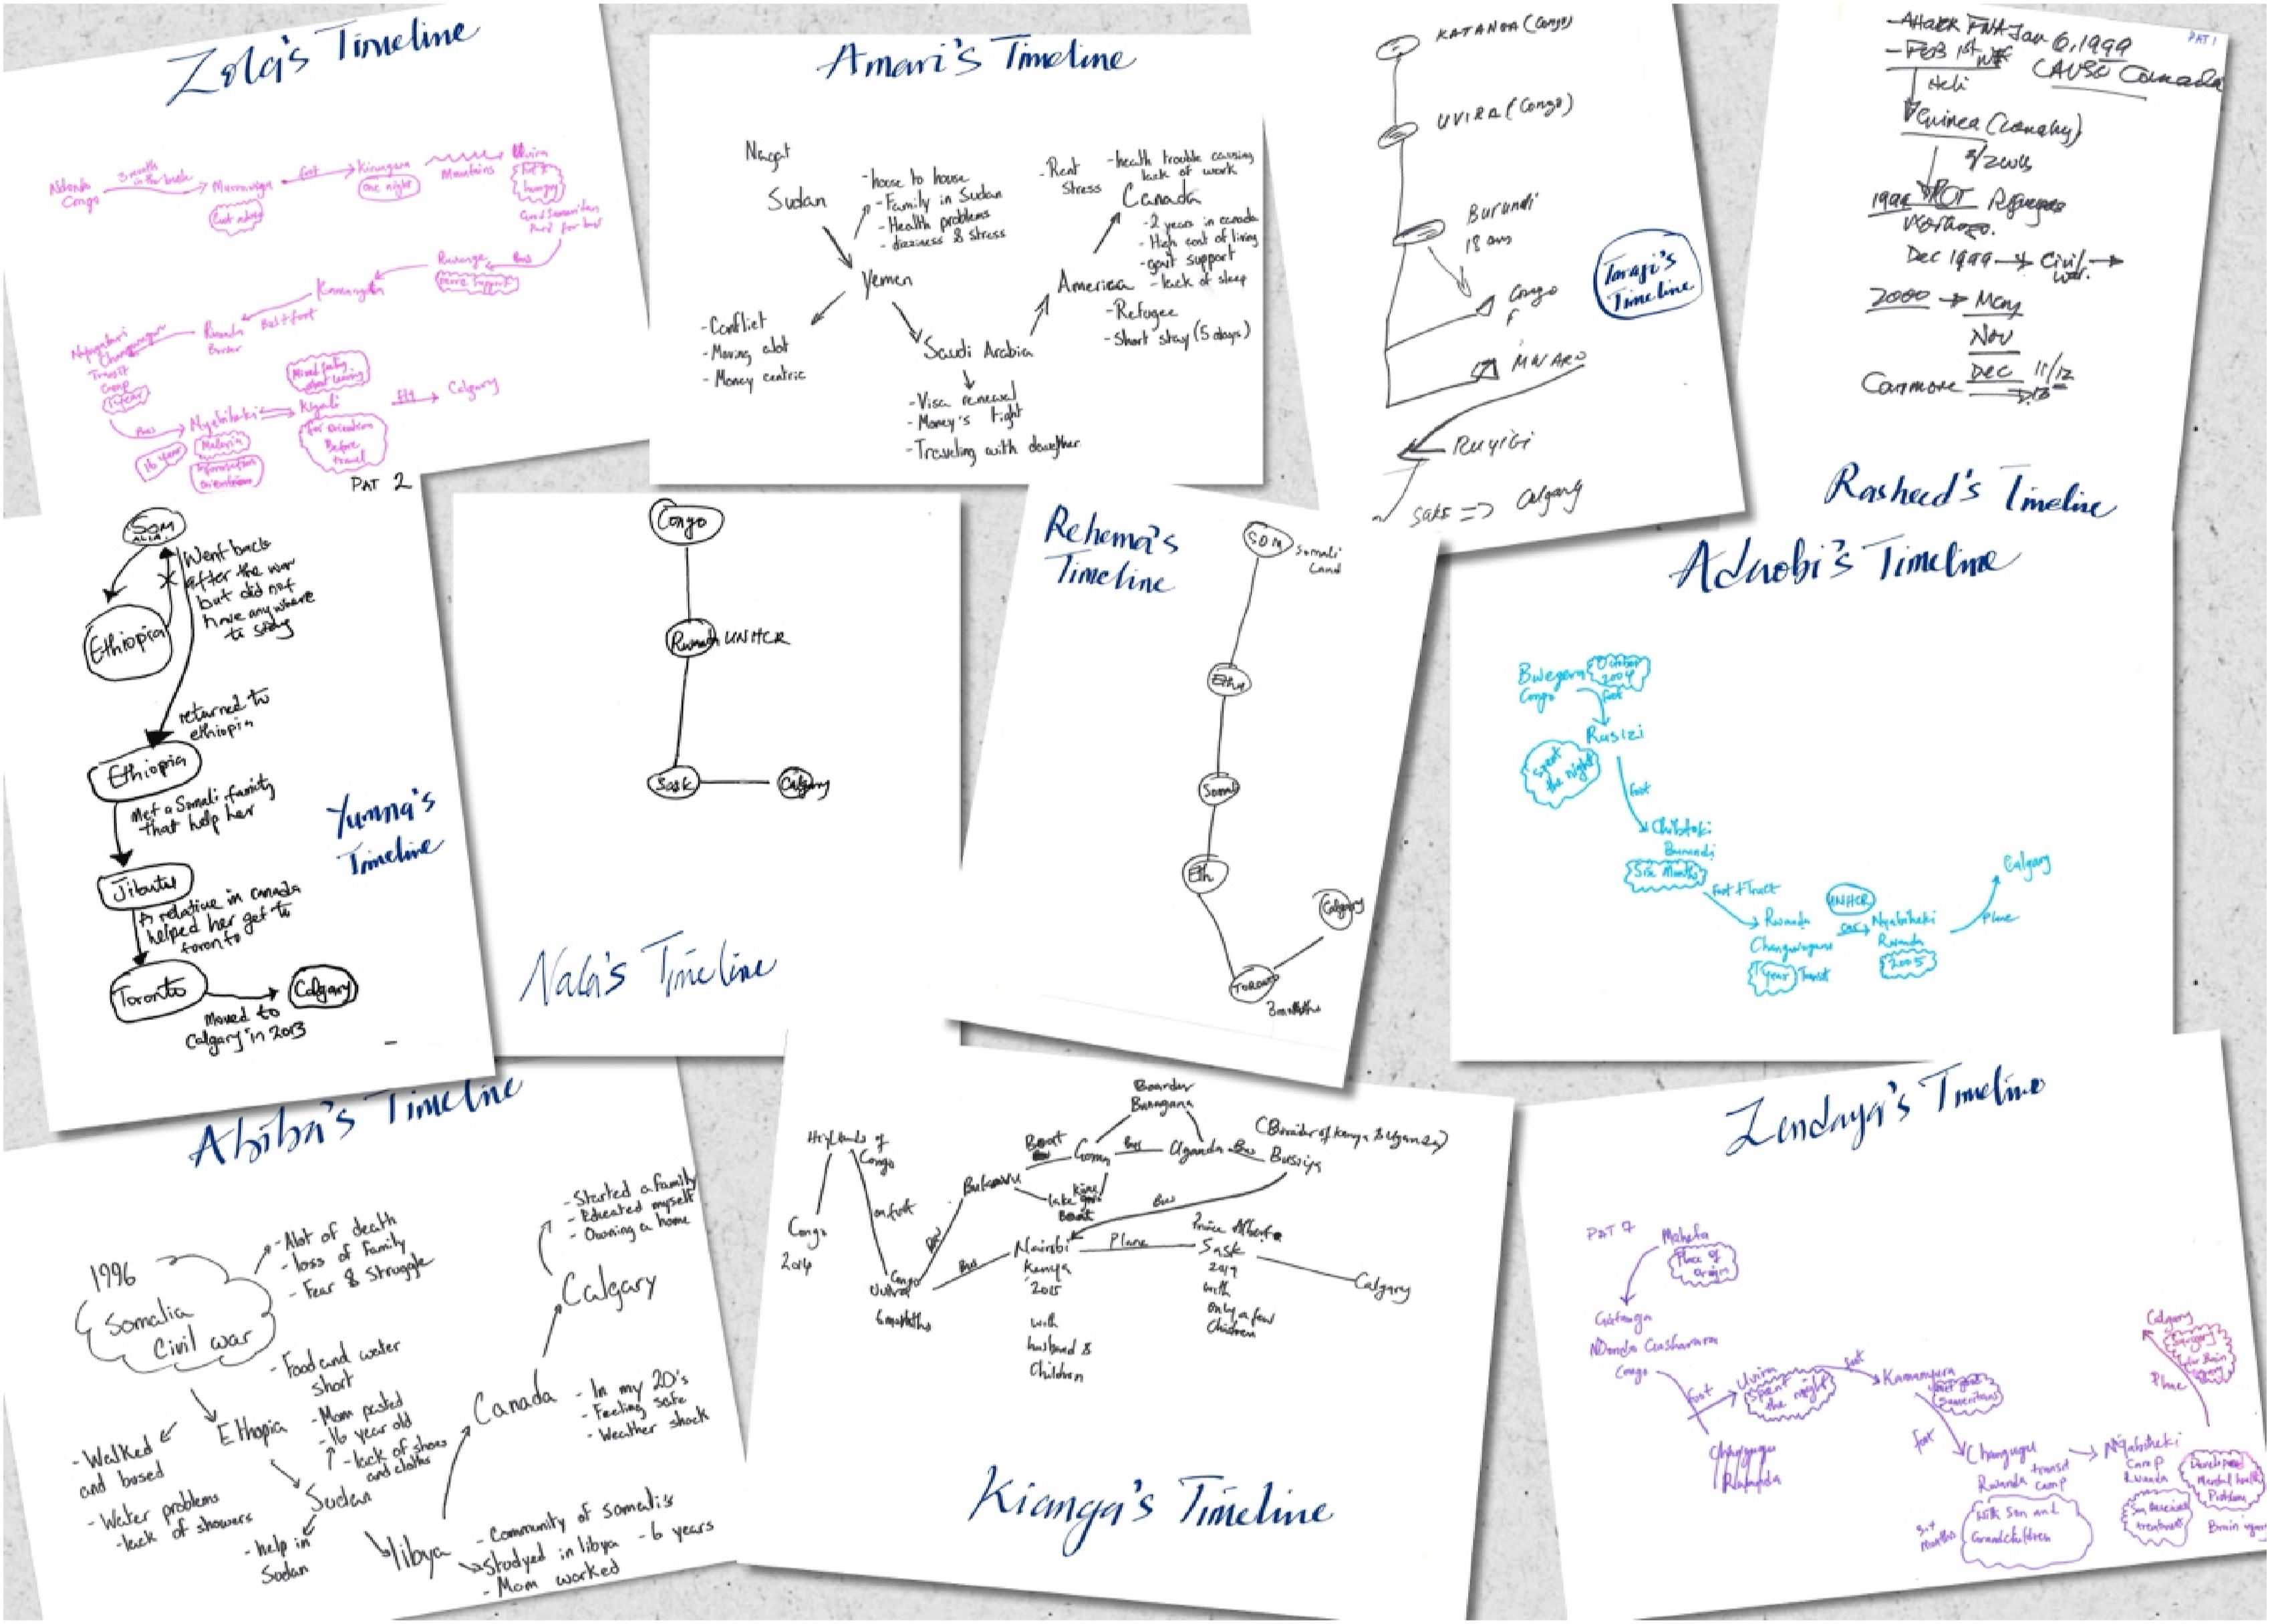
Other significant outcomes of the diagrams and stories include four co-researchers (Abiba, Amari, Zendaya, and Zola) documenting their experiences related to health, nutrition, fear, and losses during their journey on their respective timelines. Five co-researchers (Abiba, Adaobi, Yumna, Zendaya, Zola) narrated and indicated the social support they received on their timelines. Only two co-researchers’ timelines detailed their experiences after arriving in Calgary; however, all co-researchers shared oral stories of their experiences settling in Calgary. Additional details were provided by one co-researcher, who mentioned that starting a family, pursuing education, and buying a home were part of her journey. Another co-researcher provided details related to challenges in her journey, including those related to health, the high cost of living, and sleep deprivation.
Depicting Older African Refugees’ Social Network and Support Using Ecomaps and Timelines
In the second phase of data collection, co-researchers shared their experiences with social networks and support after migration. They used ecomaps, supported by stories, to illustrate both the number and closeness of these networks as well as the nature of the support they received and provided. In drawing their ecomaps, they showcased their creativity in representing their social connections by employing various line colours and patterns to indicate different types of social support. Typically, co-researchers positioned themselves at the centre of the ecomaps, surrounding themselves with different social networks, thereby revealing the proximity or distance of these connections. Some co-researchers also utilised diverse line shades and shapes to depict the dynamics of their relationships. For example, Yumna drew a bold line to signify the strong relationships she discussed, using a dotted line to represent weaker connections and, finally, a red line to illustrate distant relationships accessed through digital technology.
As they narrated their experiences of social support, the co-researchers continued to use distinct line colours and shapes to convey the nature of the support they offered and received. Taraji, for instance, used straight lines to indicate the support she received and swirling lines to denote the support she provided. She chose light green to symbolise material support and light blue for intangible support. Thus, a swirling light blue line connecting her to her social networks reflects her role in offering non-material support, such as advice and encouragement.
Some ecomaps were more intricate, others less so. The number of social networks ranged from five to 15, with an average of nine. Family members were the most salient network of support in their ecomaps. Co-researchers also highlighted the significance of faith-based organisations, governments, and, to a lesser extent, ethnic associations and a healthcare clinic, as noted by only one co-researcher. The narratives and ecomaps show that most social connections were maintained in person, while a minority, those back home, were maintained virtually.
All co-researchers demonstrate reciprocal exchanges of intangible support. In addition, a minority received material support from family and friends, as well as from the government, and the majority of co-researchers noted providing material support to their social networks. This positions older African refugees as a significant source of social support, as depicted in Figure 3. Collage of co-researchers ecomaps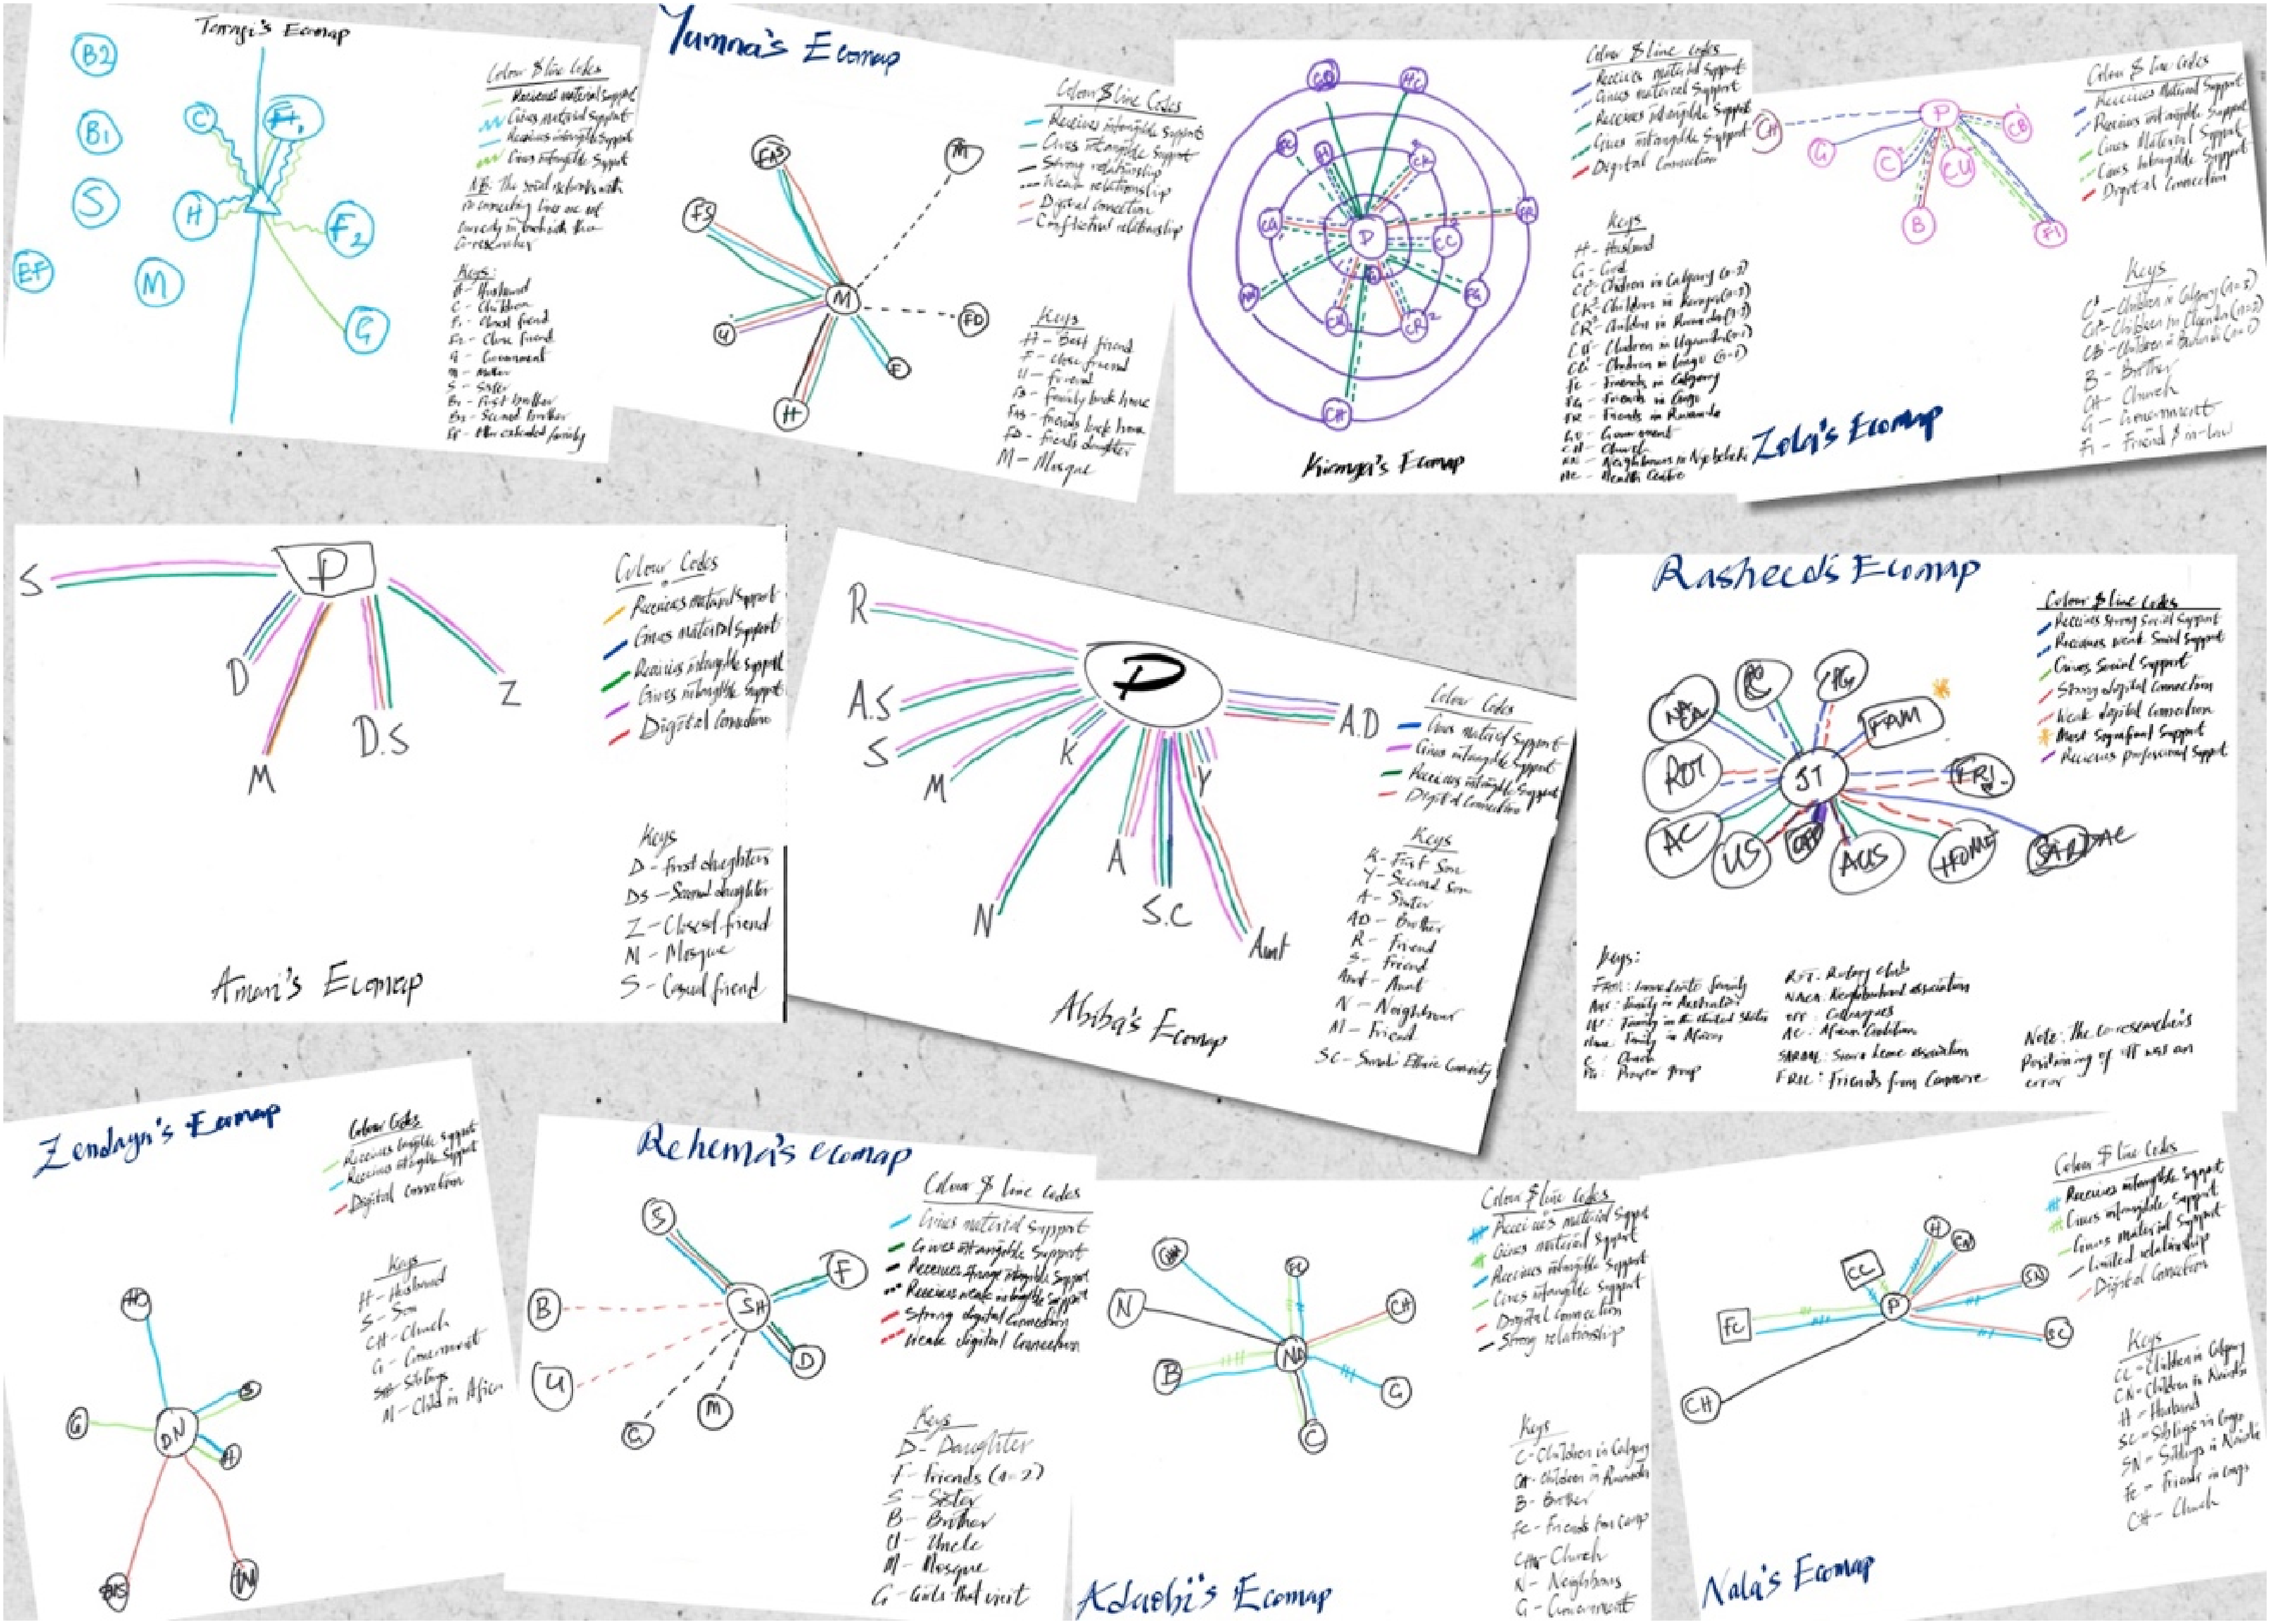
Researchers’ Reflections on Using Storytelling and Diagramming
Our use of storytelling and diagramming emerged not merely as data collection techniques but as relational and reflexive encounters that shaped both the co-researchers’ and the researchers’ understanding of displacement, ageing, and belonging. As a Black African gerontological social worker and a White settler scholar trained in participatory methods, we approached this work from distinct, yet complementary social locations and experiences. These positionalities influenced our engagement with co-researchers and our interpretation of their stories. Notably, the complementarities and differences reinforced the need for ongoing reflexivity and humility throughout the research process.
Diagramming and storytelling became shared spaces of meaning-making rather than instruments of data extraction. The co-researchers actively co-created visual maps of their social worlds—family, community, and faith networks—that allowed them to narrate experiences of loss and reconstruction with agency and coherence. For us as researchers, these diagrams functioned as ethnographic texts, revealing how memory, emotion, and identity intersected within the broader structural realities of forced migration. They invited us to listen differently—to see the narrative as both verbal and visual, embodied and spatial.
Drawing on narrative and participatory traditions (Chilisa, 2012; Riessman, 2005), this process required a suspension of researcher authority. The act of co-creating diagrams blurred the line between observer and co-researchers, fostering a dialogical relationship in which interpretation became iterative and shared. Our ethnographic stance thus shifted from co-researchers to interpreting with co-researchers, aligning with Africentric and decolonial methodologies that privilege collective knowledge and relational accountability.
At a personal level, these encounters demanded ongoing reflexivity. For the first author, who shares a diasporic and displacement history with many co-researchers, the process evoked both resonance and responsibility—to hold their stories with care and ensure cultural authenticity in representation and attention to avoid a monolithic African representation. For the second author, it required attunement to how whiteness and academic authority shape participation and interpretation. Together, these positionalities offered a more ethically grounded and trustworthy process of analysis. In reflecting on this experience, we recognise that the integration of storytelling and diagramming deepened the participatory and emotional dimensions of the research, as well as offering complementary ways of conveying stories and meaning. Beyond their analytic utility, these creative methods became vehicles for empathy, healing, and connection—transforming the research space into one of co-reflection and mutual learning.
Additionally, through regular reflexive meetings, we critically examined how their social locations, cultural backgrounds, and epistemic standpoints shaped data interpretation and knowledge production. The first author, drawing on an emic perspective as an African scholar, closely attended to the culturally embedded meanings, values, and lived experiences articulated by the co-researchers and how they shaped their engagement with our research methods (storytelling and diagramming), thereby safeguarding the integrity of co-researchers’ subjective realities. The second author contributed an etic, cross-cultural analytic lens, supporting the translation of these culturally situated interpretations for broader scholarly audiences. This dialogic reflexive process enhanced analytic rigour and interpretive balance by integrating insider knowledge with cross-cultural methodological sensitivity (Fetterman, 2008).
Coresearchers’ Views on Using Diagramming and Storytelling
In the last phase of the study, co-researchers were invited to give feedback on the study and share their reflections on diagramming and storytelling as part of the research inquiry. The overall sentiment surrounding these methods was largely favourable; many co-researchers emphasised how accessible and user-friendly the diagramming process was. They appreciated the flexibility of these techniques, which allowed for creative expression and adaptation to their unique experiences. Additionally, many remarked on how effectively these methods facilitated a clearer visualisation of their thoughts and insights, enriching their perception of their experiences. Yumna narrated: Drawing the timelines and ecomaps made it easy for me to remember things. Although I did not draw the images myself, the way my son presented them was very clear. I recall the places I visited and the experiences I had there. Thank you for allowing us to create the diagram how we want and go through several iterations.
The emphasis on the content of the diagrams, rather than their aesthetics, was appreciated by the co-researchers, who indicated that they found it easy to draw. For instance, Taraji said: “It’s easy to draw. Easy to draw. Yes, it is helping me remember things”. They also remarked that even with this simplicity, the diagrams helped them organise their thoughts and present them succinctly with the story and images. Abiba added: You know, going from place to place and not really sure where you are going anyway, it's crazy to think about. I was worried about clothes, survival, shoes, and the number of family and friends lost in my life, which was an arduous struggle.
Yumna described how the timelines would have helped them narrate their experiences during the UNHCR interview and application for asylum: This brings our experiences to life. It shows what we have been through for people to better understand us. Maybe something like that would have been helpful when we narrated our stories to the UNHCR. It will make them better understand our journey.
Many co-researchers expressed genuine gratitude for the collaboratively created diagrams, which helped them craft a more detailed narrative while navigating their memories. They found these diagrams particularly meaningful as they evoked reflections on the resilience they displayed throughout their migration journey. As Kianga noted, “This long journey, this map, even this storytelling reminds me of our extensive experiences. Perhaps it can serve as a benefit for us, illustrating just how strong we have been.” Abiba added: So, I really am a strong person to be alive now. So, it makes me appreciate the things I have despite the fact that I have been through so much. I don't complain a lot, but you know, going through all of this just makes me appreciate the things I have as well.
Additionally, co-researchers reflected on their current support systems, as displayed by the ecomaps, with appreciation. For instance, Nala remarked on how the ecomap helped her recognise and articulate the love surrounding her, making her feel cherished as she stood at the centre of her social networks. It's [the ecomaps] good. It’s good that I am at the centre, and it shows the people around me and how important it is to my life. The different roles they play. This one is helping me to remember many things. This can be very helpful to people. For example, some people may be thinking about life and all its problems without recognising how blessed they are.
Similarly, Zola revealed that being at the centre of her ecomap made her feel “special”. She added that the stories and diagrams would help people who have experienced forced migration have a better view of their experiences: I was happy because I saw myself surrounded by my closest people…It helped me to remember the steps I used to take one by one. I think that having this mapped out would help people who haven't experienced my journey gain a better understanding of what I went through. It can help anyone to know how somebody faces problems, where they have gone, and so on.
Rasheed, the sole male co-researcher, added: You can see (referring to the ecomap) that I have been blessed. You can see that I have my family and friends both in Calgary and Canmore [a nearby town]. I am a member of my ethnic organisation, the Rotaract club, and I have a strong relationship with my pastor and the entire church.
Co-researchers revealed that engaging in the exercise was cathartic. Although used as a research method, co-researchers demonstrated an appreciation for the therapeutic nature of storytelling. They indicated that storytelling helped them process their experiences and gain a deeper understanding of what these experiences meant to them. Adaobi provided this feedback: I appreciated your taking the time to talk with me, and I enjoyed our conversation. When I have someone to share my story with and discuss my experiences, I process what happened better. It helps me heal. For example, when I was speaking, I could recall my experiences and how they have shaped me into who I am today.
In sum, the diagrams helped co-researchers organise thoughts, enhance memory, and express personal stories of resilience during migration. Many found the process therapeutic, fostering gratitude and reflection on their strength and current support systems. Additionally, the collaborative storytelling and diagramming helped co-researchers process experiences, recognise personal growth, and share their journeys with others for greater understanding.
Drawbacks and Concerns of Using These Methods
Our reflections include some considerations and potential drawbacks of utilising storytelling and diagramming, particularly in research involving older refugees. In this section, we will examine these considerations for future researchers interested in employing these or similar methods. We will begin by addressing the concerns related to the diagrams, followed by a discussion on storytelling.
Drawbacks and Concerns of Using Diagramming
The study’s findings reveal a significant diversity in the complexity of the diagrams. As indicated above, some diagrams were rich in detail, providing profound insights into the migration patterns, social networks, and support experiences of older African refugees. In contrast, other diagrams appeared quite simplistic, conveying minimal information and lacking depth. Hence, it was complemented with storytelling, suggesting the insufficiency of diagrams as a sole research method with this population. The differing approaches may also reflect the unique perspectives and investment of the co-researchers in the process, ultimately influencing the richness of the captured data. This variation not only highlights the varying levels of engagement and perhaps creativity among co-researchers in constructing these diagrams but may also indicate a lack of interest in this technique or a lack of belief in their ability to draw.
Important distinctions may also be overlooked if co-researchers struggle to translate their experiences into visual forms, which can hinder the diagrams from fully capturing the breadth of their experiences. Furthermore, these diagrams should not be interpreted in isolation from the accompanying narratives, as diagram interpretation can be highly subjective (Prosser & Loxley, 2008). It is also noteworthy that while some co-researchers expressed a desire to guide the creation of the diagrams, it was often family members or interpreters who ended up physically constructing them. Although co-creation is intended to foster the autonomy and choices of co-researchers (Bagnoli, 2009; Manja et al., 2021; Umoquit et al., 2011), it is essential to recognise that the co-constructed diagrams may not accurately represent the co-researchers’ experiences, as some nuances may be lost in the process of directing others on what to draw. Additionally, it is possible that the ecomaps were influenced by biases related to desirability, as some co-researchers hesitated to depict strained relationships within their social networks or to highlight instances of social isolation.
Drawbacks and Concerns of Using Storytelling
The main limitation of utilising storytelling in this study pertains to language barriers and dependence on interpreters for some co-researchers. Although significant efforts were made to maintain cultural and linguistic accuracy, translation can be interruptive and may not fully capture the nuanced expressions of co-researchers, particularly when discussing complex and/or deeply personal topics (Kapborga & Berterö, 2002). The involvement of interpreters often disrupted the narrative flow for co-researchers, and subtle cultural nuances may have been lost during the interpretation process. Furthermore, storytelling requires co-researchers to recount traumatic experiences related to forced displacement, war, and loss, which can evoke distress and impede their capacity to engage fully or continue sharing. Some co-researchers may struggle with accurate recall because these events occurred over time, and many co-researchers experience recollection bias, as memories can fade or become distorted over time, particularly in the context of trauma’s impact on memory.
Discussion
This study contributes to an emerging body of scholarship that underscores the transformative potential of arts-based and participatory methods in gerontological and migration research (Bagnoli, 2009; Abkhezr et al., 2020; Chilisa, 2012; Riessman, 2005). By integrating diagramming with storytelling, we demonstrated how visual and narrative techniques can elicit rich, affective, and reflexive accounts from older African refugees who have experienced profound displacement and loss. In doing so, this research not only generated data but also created a relational and restorative process of meaning-making.
The co-researchers’ engagement with timelines and ecomaps revealed that diagramming can serve as both a cognitive and an emotional scaffold, enhancing recall, coherence, and ownership of one’s life narrative. This resonates with prior research showing that visual tools support co-researchers in organising complex experiences and constructing identities disrupted by migration (Bagnoli, 2009; Umoquit et al., 2011). Importantly, for older refugees—many of whom face linguistic, cognitive, or emotional barriers—diagramming offered an accessible medium through which they could represent experiences of loss and reconstruction without being constrained by linguistic fluency.
Storytelling, when used alongside these visual tools, further deepened the research’s dialogical dimension. For co-researchers who often occupy marginalised positions in both host societies and scholarship, these methods functioned as acts of epistemic justice—granting visibility, dignity, and agency in the representation of their own realities. Methodologically, combining visual and African storytelling approaches aligns with participatory and decolonial research paradigms that seek to redress hierarchical power relations in knowledge production (Chilisa, 2012). The participatory ethos of this study enabled co-researchers to influence the pacing, structure, and content of the sessions, thus redistributing power and validating experiential knowledge. These collaborative dynamics are particularly crucial when working with older refugees, whose voices are often overshadowed by dominant, deficit-oriented representations in both policy and academia.
Nevertheless, the study also highlights several methodological and ethical considerations. The collaborative nature of visual storytelling means co-researchers may invite others—such as relatives, interpreters, or researchers—to join the co-creation process. While this may enrich the data, it also complicates questions of authorship, agency, and confidentiality, as demonstrated in the scoping review by Umoquit et al. (2011), which reviewed studies that have adopted visuals in their methodologies. Furthermore, as Bagnoli (2009) found, interpretation of visual materials remains inherently subjective; hence, researchers must triangulate visual materials with oral narratives and field reflections to strengthen analytic validity. The use of interpreters, though necessary for inclusion, can disrupt narrative flow and attenuate emotional nuance—challenges noted widely in participatory refugee research (Temple & Edwards, 2002). Conversely, limiting participation to English-fluent individuals risks reproducing linguistic privilege and excluding the very populations most affected by marginalisation.
It is vital to note that, while the sample size is consistent with comparable qualitative studies (Umoquit et al., 2011) and aligns with established methodological guidance on qualitative sample adequacy (Hennink & Kaiser, 2022; Wutich et al., 2024), we cannot make generalizable inferences from the results of 11 co-researchers in a single city. Instead, the study offers rich, contextualised insights that may inform and sensitise researchers seeking to apply similar visual and participatory methods with comparable populations. Notably, the findings underscore the need for methodological flexibility when employing diagramming techniques with older African refugees and similar groups, including openness to multiple modes of participation such as co-created diagrams and researcher-facilitated or researcher-led diagramming. Storytelling emerged as a particularly effective complementary strategy, enabling co-researchers to articulate complex experiences and relationships despite linguistic constraints and the use of interpreters. On this basis, we recommend diagramming, in conjunction with narrative methods, as a valuable and culturally responsive approach for research with older African refugees and similarly situated populations.
Ultimately, this study affirms the importance of methodological pluralism and reflexivity when engaging with displaced older adults. Combining visual and narrative methods provides pathways to elicit multi-layered understandings of memory, resilience, and belonging. It also underscores the ethical imperative of care in participatory work—recognising that story-sharing may surface unprocessed trauma and that researchers must hold space with sensitivity and provide follow-up supports. For practitioners in social work and gerontology, the findings offer valuable insights into how storytelling and visual reflection can be integrated into therapeutic, community, and policy settings. Facilitating older refugees’ opportunities to narrate and visualise their life histories may foster emotional healing, strengthen identity continuity, and build intergenerational connections within resettled communities.
Conclusion
Ultimately, this study underscores that storytelling and diagramming are not merely methodological choices but acts of relational engagement that can transform the research encounter into a site of empowerment and care. Future research should continue experimenting with arts-based participatory methods to examine their capacity to bridge linguistic, generational, and cultural divides. In doing so, scholars and practitioners alike can advance a more inclusive and humane approach to understanding the ageing refugee experience—one that honours older adults not as subjects of study, but as co-creators of knowledge and community.
Footnotes
Funding
The authors received no financial support for the research, authorship, and/or publication of this article.
Declaration of Conflicting Interests
The authors declared no potential conflicts of interest with respect to the research, authorship, and/or publication of this article.