
Abstract
This study presents an innovative analytical approach to ethnographic data on food provision in a nursing home, focusing on the interplay of formal structures and informal social dynamics between professional groups through an analysis of reasons to communicate. Data were collected over ten months through participant observation, semi-structured individual and group interviews in a municipal nursing home in Vienna (Austria). These qualitative data were visualized through social network analysis using Neo4j software, which contained 52 entities and 242 relationships in 30 communication reasons. The analysis highlighted the complexity of communication structures required to accomplish food-related tasks, with certain communication reasons, such as ‘recurring food orders’, revealing distinct patterns of interaction between departments and occupational groups. These insights revealed how professional groups collaborate within and between departments to deal with the daily tasks that underpin meal provision. This methodological approach provides new insights into institutional interactions, taking into account the importance of tacit knowledge and informal practices in shaping the food supply alongside formal processes. By using social network analysis as an innovative research tool, this study advances our understanding of organisational dynamics in healthcare, particularly in German-speaking countries.
Introduction
The organisation of food in nursing homes is closely entangled with the institutional framework that governs the provision of care. As part of the broader institutional framework of comprehensive care, food is managed in a way that reflects both efficiency and structure, influencing how individual and social needs are addressed.
Nursing homes operate as formal institutions. These institutions are guided by rules, regulations, and expectations that guide behaviour (Scott, 2014) and ensure both the wellbeing of residents and the effective use of resources. Within this formal setting, food provision is not just a practical task but a regulated and symbolic practice (Stöhr et al., 2022). To better understand how food provision is structured in the nursing home, this article draws on the perspective of symbolic interactionism. This theoretical lens focuses on how individuals create, interpret and negotiate rules and norms through everyday interaction and communication (Ritzer, 2015). Over time, these interpretations can reshape how institutions function (Giddens & Griffiths, 2006).
Mealtimes in nursing homes are often crucial moments for social interaction, emotional bonding, and community building among residents and with the nursing staff. The practices surrounding food thus emerge from everyday interactions between nursing staff and residents, but also from a complex co-operation among diverse occupational groups. In our previous study (Stöhr et al., 2022), describing everyday eating routines in nursing homes, we found that residents develop elaborate strategies to deal with rules and institutional constraints through interaction with various occupational groups and individual staff members. However, the success of these interactions depends heavily on the ability of nursing staff to work together as a team. In their ethnographic study, Faraday et al. (2020) identified teamwork and collaboration as one of five critical issues in nursing care during mealtimes, alongside creating a positive atmosphere, building meaningful relationships with residents, promoting residents’ autonomy and independence, and balancing empathy and persistence. These findings underscore the importance of fostering effective team dynamics among caregivers to create a supportive and inclusive environment for residents during mealtimes. However, food provision in healthcare organisations not only involves the nursing care team in the narrower sense, but a complex set of other teams and occupational groups. Our current study builds on this and visualizes the interactions that take place over the course of the necessary collaboration involved in meal service.
In their ethnographic study on nursing home care, Fjær and Vabø (2013) discuss the importance of staff manipulating social situations to promote person-centred care. While they do not explicitly state that employees shape cultural norms, their work suggests that employees can influence the social environment through their actions. Also McCormack et al. (2011) emphasize the importance of staff involvement in implementing person-centred care.
This paper investigates how food is organised and provided in a nursing home by focusing on the actors involved in the process. To provide food, a complex process of interactions is carried out by various occupational groups (care, attendance, cooks and service, technical facility management, laundry room, cleaning, reception) from different departments (inpatient and outpatient care, therapeutic staff, care support, kitchen, facility management, administration) involved in food provision. Their problem-solving skills in a sophisticated interplay evolving around the structural and procedural organisation of food provision will be examined and illustrated here.
To analyse these processes, we used a methodological approach that we present here to shed light on informal structures, such as food culture and unwritten norms, which emerge within the formal framework of the institution. This approach also has the potential to allow for a better understanding of the role of tacit knowledge (cf. Polanyi, 1985) in managing this complex task, highlighting the implicit rules that regulate social practices and guide food provision.
To visualize and examine these dynamics which to our knowledge have not been displayed in published research on nursing homes before, an ethnographic approach in combination with the methodology of social network analysis (SNA) was used. The ethnographic approach enables an in-depth understanding of real-world practices by capturing the experiences and interactions of people within the institution. The researcher´s presence in the field allows for the observation of how formal structures are enacted – and often adapted – in daily routines. SNA complements the ethnographic approach to examine interconnections between actors and patterns that emerge from their relationships (Wasserman & Faust, 1994). Originally developed by ethnographers like Barnes (1969) and Mitchell (1974), this method has proven valuable for identifying patterns of connectivity and influence within the institution predominantly in qualitative studies (Froehlich et al., 2019). Furthermore, visualisations of networks and network dynamics represent an alternative approach to data organisation and display, and offer a supplementary form of evaluation and analysis (Schönhuth et al., 2013).
Thus, in this article, we intend to outline how the first author, by drawing on the above-mentioned authors and their use of SNA, developed a pathway/process of moving from ethnographic data to a structured set of network data, which was then be purposefully analysed and visualised. The procedure developed by the first author in the frame of her PhD research on food provision and eating in nursing homes will be presented in a systematic way in order to contribute to the methods discourse and to make comprehensible how network displays can be used as an analytical tool.
In doing so, we want to show how, based on observational and qualitative interview data, a comprehensive network dataset can be generated to understand the institutional structure based on interactions surrounding food provision and the informal structure that emerges from it. The focus of analysis in the specific example presented here is on the dynamics between occupational groups operating within a nursing home. It is shown how observation and interview data provide valuable opportunities to collect behavioural data on the network of relations between the actors in linking different communication occasions.
Method
In the study presented here, an observational approach was employed to survey the visible social networks that are reflected in the lived patterns of interaction and communication in the nursing home. In addition, the perspectives and perceptions of actors representing the different occupational groups involved in food-related processes were documented through interviews over a period of 10 months in a municipal nursing home in Vienna (Austria).
As part of the study, a solution had to be found for the handling of the complex and multi-faceted ethnographic data set. An analytical strategy derived from network analysis was employed for this purpose. The data obtained from observations and interviews, recorded in the form of field notes, constituted the basis for this approach. The data were then converted into ‘graphs’ to systematise them and identify patterns.
With this social network analysis approach, it was possible to describe patterns of social practice based on observational and interview data. Using network methods allowed to elaborate relational patterns and how they contribute to institutional structures and the accomplishment of complex food-related organisational tasks. This approach allowed for the comprehensive mapping of interaction patterns from the actors’ perspectives, including the conditions under which these interactions become relevant, meaningful, and significant. The extensive ethnographic fieldnote data based on a long presence of the researcher on site strengthened this approach to drawing a detailed picture of the organization of food in a nursing home.
After data collection, the qualitative data (observational fieldnotes and interviews) were subsequently transferred to a self-developed standardised network system with the objective of recording the complex interrelationships in a differentiated yet comprehensive manner, and of depicting them in a coherent and intelligible way. This somewhat unconventional approach was chosen as a means to tackle the complex nature of the data.
The following section delineates the processes of collecting the ethnographic data and of processing them into a systematic network dataset, with the aim of illustrating how the data were utilised in this specific context.
Design and Data Collection
For the collection of the data, an ethnographic approach was employed with the aim of gaining insight into the practices associated with food provision in nursing homes. In formal institutions such as nursing homes, social patterns are constituted and emerge as a consequence of attitudes, values, norms and rules held by the people who interact in them – the residents and the staff. Organisational ethnography is a well-established method for studying social patterns and their effects (Dellwing & Prus, 2012; Dupuis et al., 2005). In our use of it, the organisational ethnographic approach proved to be an appropriate methodology for investigating food provision and related practices in care homes. It can integrate a range of research methods, including individual or group interviews, document analysis and participant observation, whereas the latter represents the principal tool for the collection of ethnographic data (Breidenstein et al., 2020; Dupuis et al., 2005; Emerson et al., 2011; Lincoln & Guba, 1986; Soom Ammann & van Holten, 2017).
For our study, in order to gain an understanding of the institutional structure of food provision in a nursing home and the roles and responsibilities of the various actors involved, participant observation and semi-structured interviews were used, including two group interviews. Data were collected by the first author over a period of 10 months (October 2017 to August 2018, approximately 200 hours of data collection) in a nursing home situated in an urban area in Austria. Field notes were taken while staying at the nursing home. When conducting interviews these were taken during and after.
Data collection through observation and employee interviews was agreed to in principle by the nursing home management. Employees were informed verbally and were free to participate during working hours. At the time of first contact they were given a leaflet about the research project by the first author. During the interview, participants were given detailed information and provided their consent by signing an informed consent form.
Participant observation is suitable for capturing data in an institution like a nursing home. The first author was permitted to collect the data and, over time, became part of the team and thus was in a position to gain insight into the practices and processes in the respective organisation. During fieldwork, all observations were conducted concurrently with the interviews and noted in a field diary, usually immediately after a field stay. The observation data were used to phrase questions about observed extraordinary communication incidents around the organization of food provision. These questions were then asked in the interviews to gain further insights into why communication had happened.
In the context of this study, interactions were defined as those actions which are required to overcome obstacles. The emphasis here is on the need for communication. The interviews were conducted with the aim of ascertaining the respective communication reasons. Throughout the interviews, however, it became evident that the communication reasons extracted from the observations alone were insufficient to account for the full range of communication reasons between employees in occupational groups involved in food provision.
After reviewing the organisational chart and consulting with the director, it became clear that it would not be possible for economic and practical reasons to survey the entire network of professionals involved in food provision by interviewing all employees of the nursing home. Nevertheless, in order to gain an impression of the processes and structures, a pragmatic approach was chosen and only one person from each occupational group involved in the organisation of food provision was interviewed. The focus of the interview was on the individual as a representative of an occupational group and their role within the institutional structure. This had the advantage that data on the views and expertise of the various occupational groups and the associated areas of responsibility could be collected.
The interviews were conducted in the nursing home and lasted between 20 and 80 minutes. There were 30 individual interviews and two group interviews, one with 4 persons from the laundry room and one with the sous-chef and a cook; the group interviews were spontaneous. The group interview with all the people working in the laundry room in particular showed how valuable this interview situation is in terms of generating data. It meant that information could be provided in a more comprehensive and detailed manner. The interviews were conducted in a separate room that was available at the time.
The interviewees were selected upon availability. They were either contacted by e-mail and an appointment was arranged, or further interviews were conducted with other occupational groups before or after a previous interview spontaneously. Despite being a time-consuming data collection approach, it was of importance to allow all groups to have their say.
As the interviews were not recorded due to concerns expressed by the management, the first author had to sketch the interactions described and the contextual information by hand during the interviews. During data collection, a dialogical approach was used, allowing participants to immediately feed back during the interview situation to ensure mutual understanding. The notes were shown to the participants, and they were given the opportunity to comment, suggest corrections or make additions. This approach allowed to interact with the participants in real time while at the same time validate the understanding of the researcher. At the beginning of data collection, interviews were semi-structured. As the interviews continued, they became more open. Immediately after each interview, memos were written.
All relevant occupational groups were included directly except the doctor and the departmental assistants because they were unfortunately not available for an interview due to their working hours and workload. 1 Based on the information from the other interviewees, it was nevertheless possible to map their interactions with those two occupational groups.
Data Processing and Analysis
In the first step, the handwritten interview data were transferred into a Word document and imported into MaxQDA (version 18.1.1), a software tool developed for analysing qualitative data. Subsequently, network maps of each interview were drawn by hand. Due to the various reasons for communication and the diversity of participants, these network maps were difficult to compare with each other and thus also difficult to analyse. Nevertheless, MaxQDA has proven very useful in summarising all of the reasons to communicate mentioned during interviews into 30 types of communication reasons 2 .
As a next step, the goal was to integrate the information from the interviewees and aggregated communication reasons into a graph software tool (Neo4j) that offered functionalities for both creating flexible graph data models and asking questions about the data. Graph databases match these requirements and provide the distinct advantage of semantic queries. These allow searching for and analysing associative and contextual patterns within the database.
Neo4j, as a graph database application, in particular offers an entire suite of tools to accompany the end-to-end workflow of importing, modelling, querying and interactive visualization of data points and their relation to each other. The software Neo4j offers a free licence for academic and non-commercial use with only a slightly reduced range of functions compared to the company licence. In addition to the actual graph database, the Neo4j (version 4.2.3) desktop environment also offers a browser and, with Bloom, a visual query tool. The declarative query language ‘Cypher’ on which Neo4j is based can be learnt quickly and is nevertheless powerful.
The data of this study have been integrated in a Neo4j database so that participants are represented as nodes that are connected by so-called edges, which indicate the type of relationship. Nodes and edges are the only datatypes available in a graph database and it is up to the user to choose what is represented as a node or an edge.
In the first step, we defined nodes (employee, occupational group, department, non-staff) with added attributes (job title, working hours/week, years in current position). Subsequently, the various entities were allocated to the nodes and distinct relation types were defined. For example, nodes of the type ‘Employee’ are connected (‘WORKS_IN’) to nodes of the type ‘Occupational Group’ by relationships of type ‘MEMBER_OF’. To give a specific example (see Figure 1), the employee ’21, Cook’ works in the department ‘Kitchen’ and is member of the occupational group ‘Cooks’ which belongs (‘PART_OF’) to the department ‘Kitchen’. Finally, we added the relationship ‘COMMUNIATE’, which connected all nodes to capture all the different communication reasons within the nursing home. Example Nodes and Relationship Types
To begin with, the database schema to be created was worked out manually over several iterations. Cypher scripts were then created on the basis of this schema, after which all entities, all nodes and relationship types were created in the database. In Figure 2 below, the Cypher query ‘CALL db.labels’ was used to display all 4 created node types. Cypher Query Showing all Node Types
By running another query, the database shows all relationship types (see Figure 3). Cypher Query Showing all Relationship Types
These types can be thought of as empty templates which need to be known to the database before being used to create concrete data artifacts. To give an example, the three queries below were executed to generate the department ‘Kitchen’, the occupational group ‘Cooks’ and the relationship ‘PART_OF’, which declares that ‘Cooks’ are part of ‘Kitchen’ as modelled by the first author.
With the three preceding examples, it is important to stress that ‘query’ is meant in the technical sense as something the database interprets and executes.
By far the most queries were needed to insert all the different communication relationships. The two queries below exemplify this for the communication reason ‘distribution of tasks’. The domiciliary nurse
3
was assigned the employee number 13 and 24 corresponds to the kitchen help. The reason they communicate with the ‘Cooks’ is to align on how tasks are distributed. An example with nodes and the communication reason ‘distribution of tasks’ is shown in Figure 4. Example Nodes and Communication ‘Distribution of Tasks’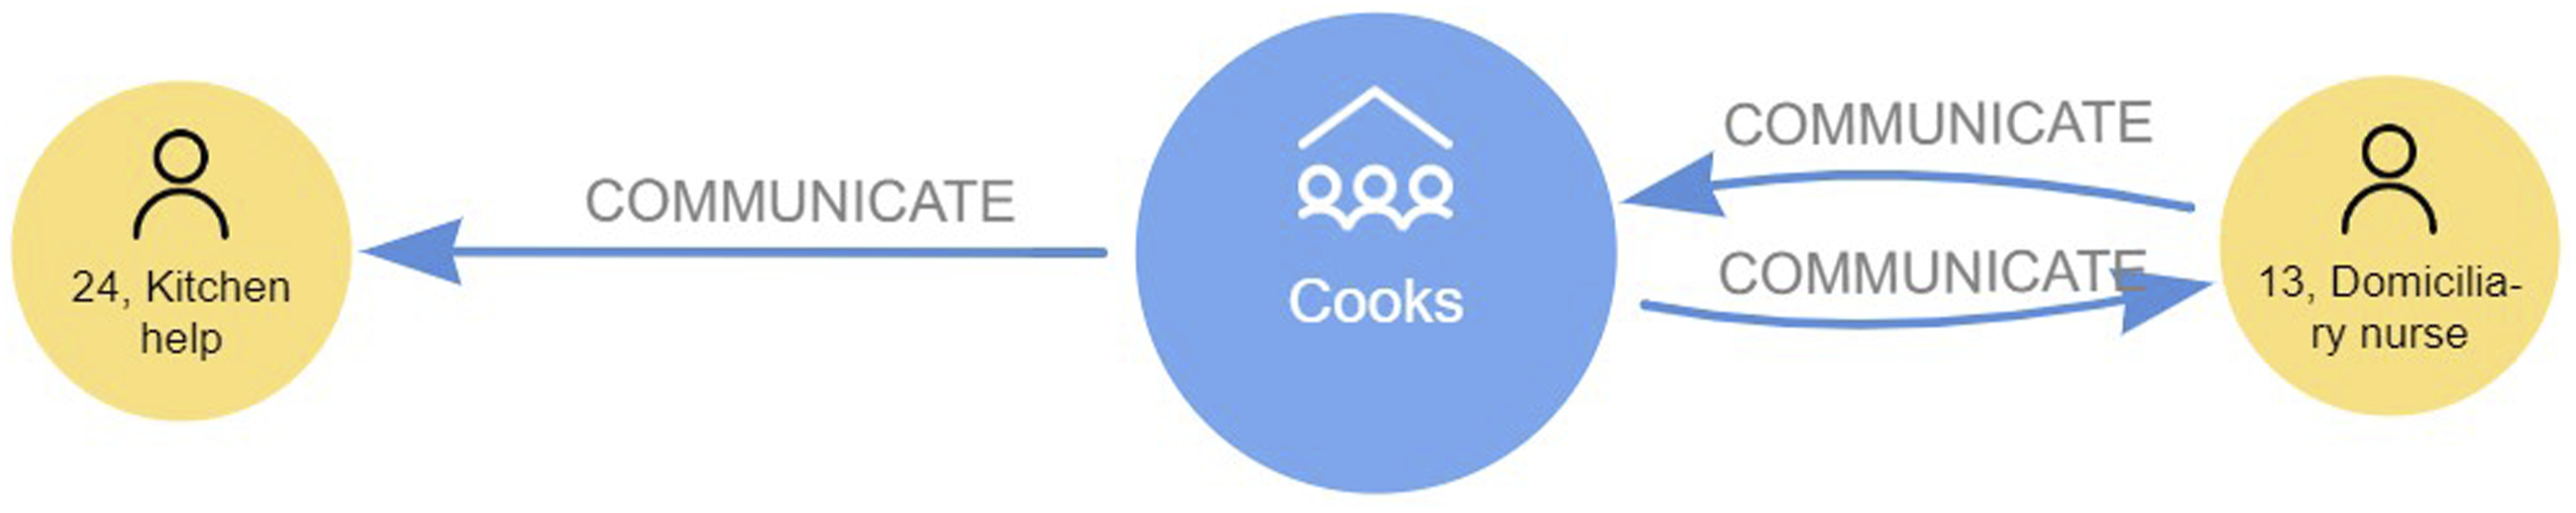
Results
To demonstrate the potential applications of this type of processing and visualisation of qualitative data and to provide an overview of the query options, the following example is used: A communication network is presented to visualise the context of the communication reason ‘Recurring food orders.’, Figure 5 illustrates the query ‘Communication with reason’ ‘Recurring food orders.’ The result of this query comprises two communication structures that are not linked to each other. In the left structure, the Department communicates with the Lead Administration, which in turn communicates with the Occupational Group ‘Cooks.’ The other communication structure illustrates communication from the Lead Outpatient Care to the Chef. Query ‘Communication With Reason: Recurring Food Orders’
When the ‘MEMBER_OF’ condition is selected in the database additionally to ascertain which individual belongs to which occupational group, the separate communication structures shown in Figure 5 will be combined. It is the Occupational Group of ‘Cooks’ that is being addressed. In contrast to the ‘Chef’, who is addressed as a person with his role allocation by the ‘Lead outpatient care’, it becomes evident with this visualisation that communication is focused on the ‘Cooks’ (Figure 6). Query ‘Communication With Reason Recurring Food Orders’ and ‘MEMBER_OF’
The addition of the condition ‘PART_OF’ allows for the clear delineation of the occupational group’s affiliation with the department. This delineation serves to elucidate the employee’s position within the institutional structure. The addition of the relationship ‘WORKS_IN’ reveals the affiliation of the employee to the department.
From an institutional perspective, it is possible to ascertain the department in which an employee works as well as the occupational group affiliation. Furthermore, it demonstrates that certain occupational groups may be affiliated to more than one department.
In Figure 7, the Occupational Group ‘Care’ is part of both the ‘Outpatient care’ and ‘Inpatient care’ departments. Query ‘Communication With Reason Recurring Food Orders’ ‘MEMBER_OF’, ‘WORKS_IN’ and ‘PART_OF’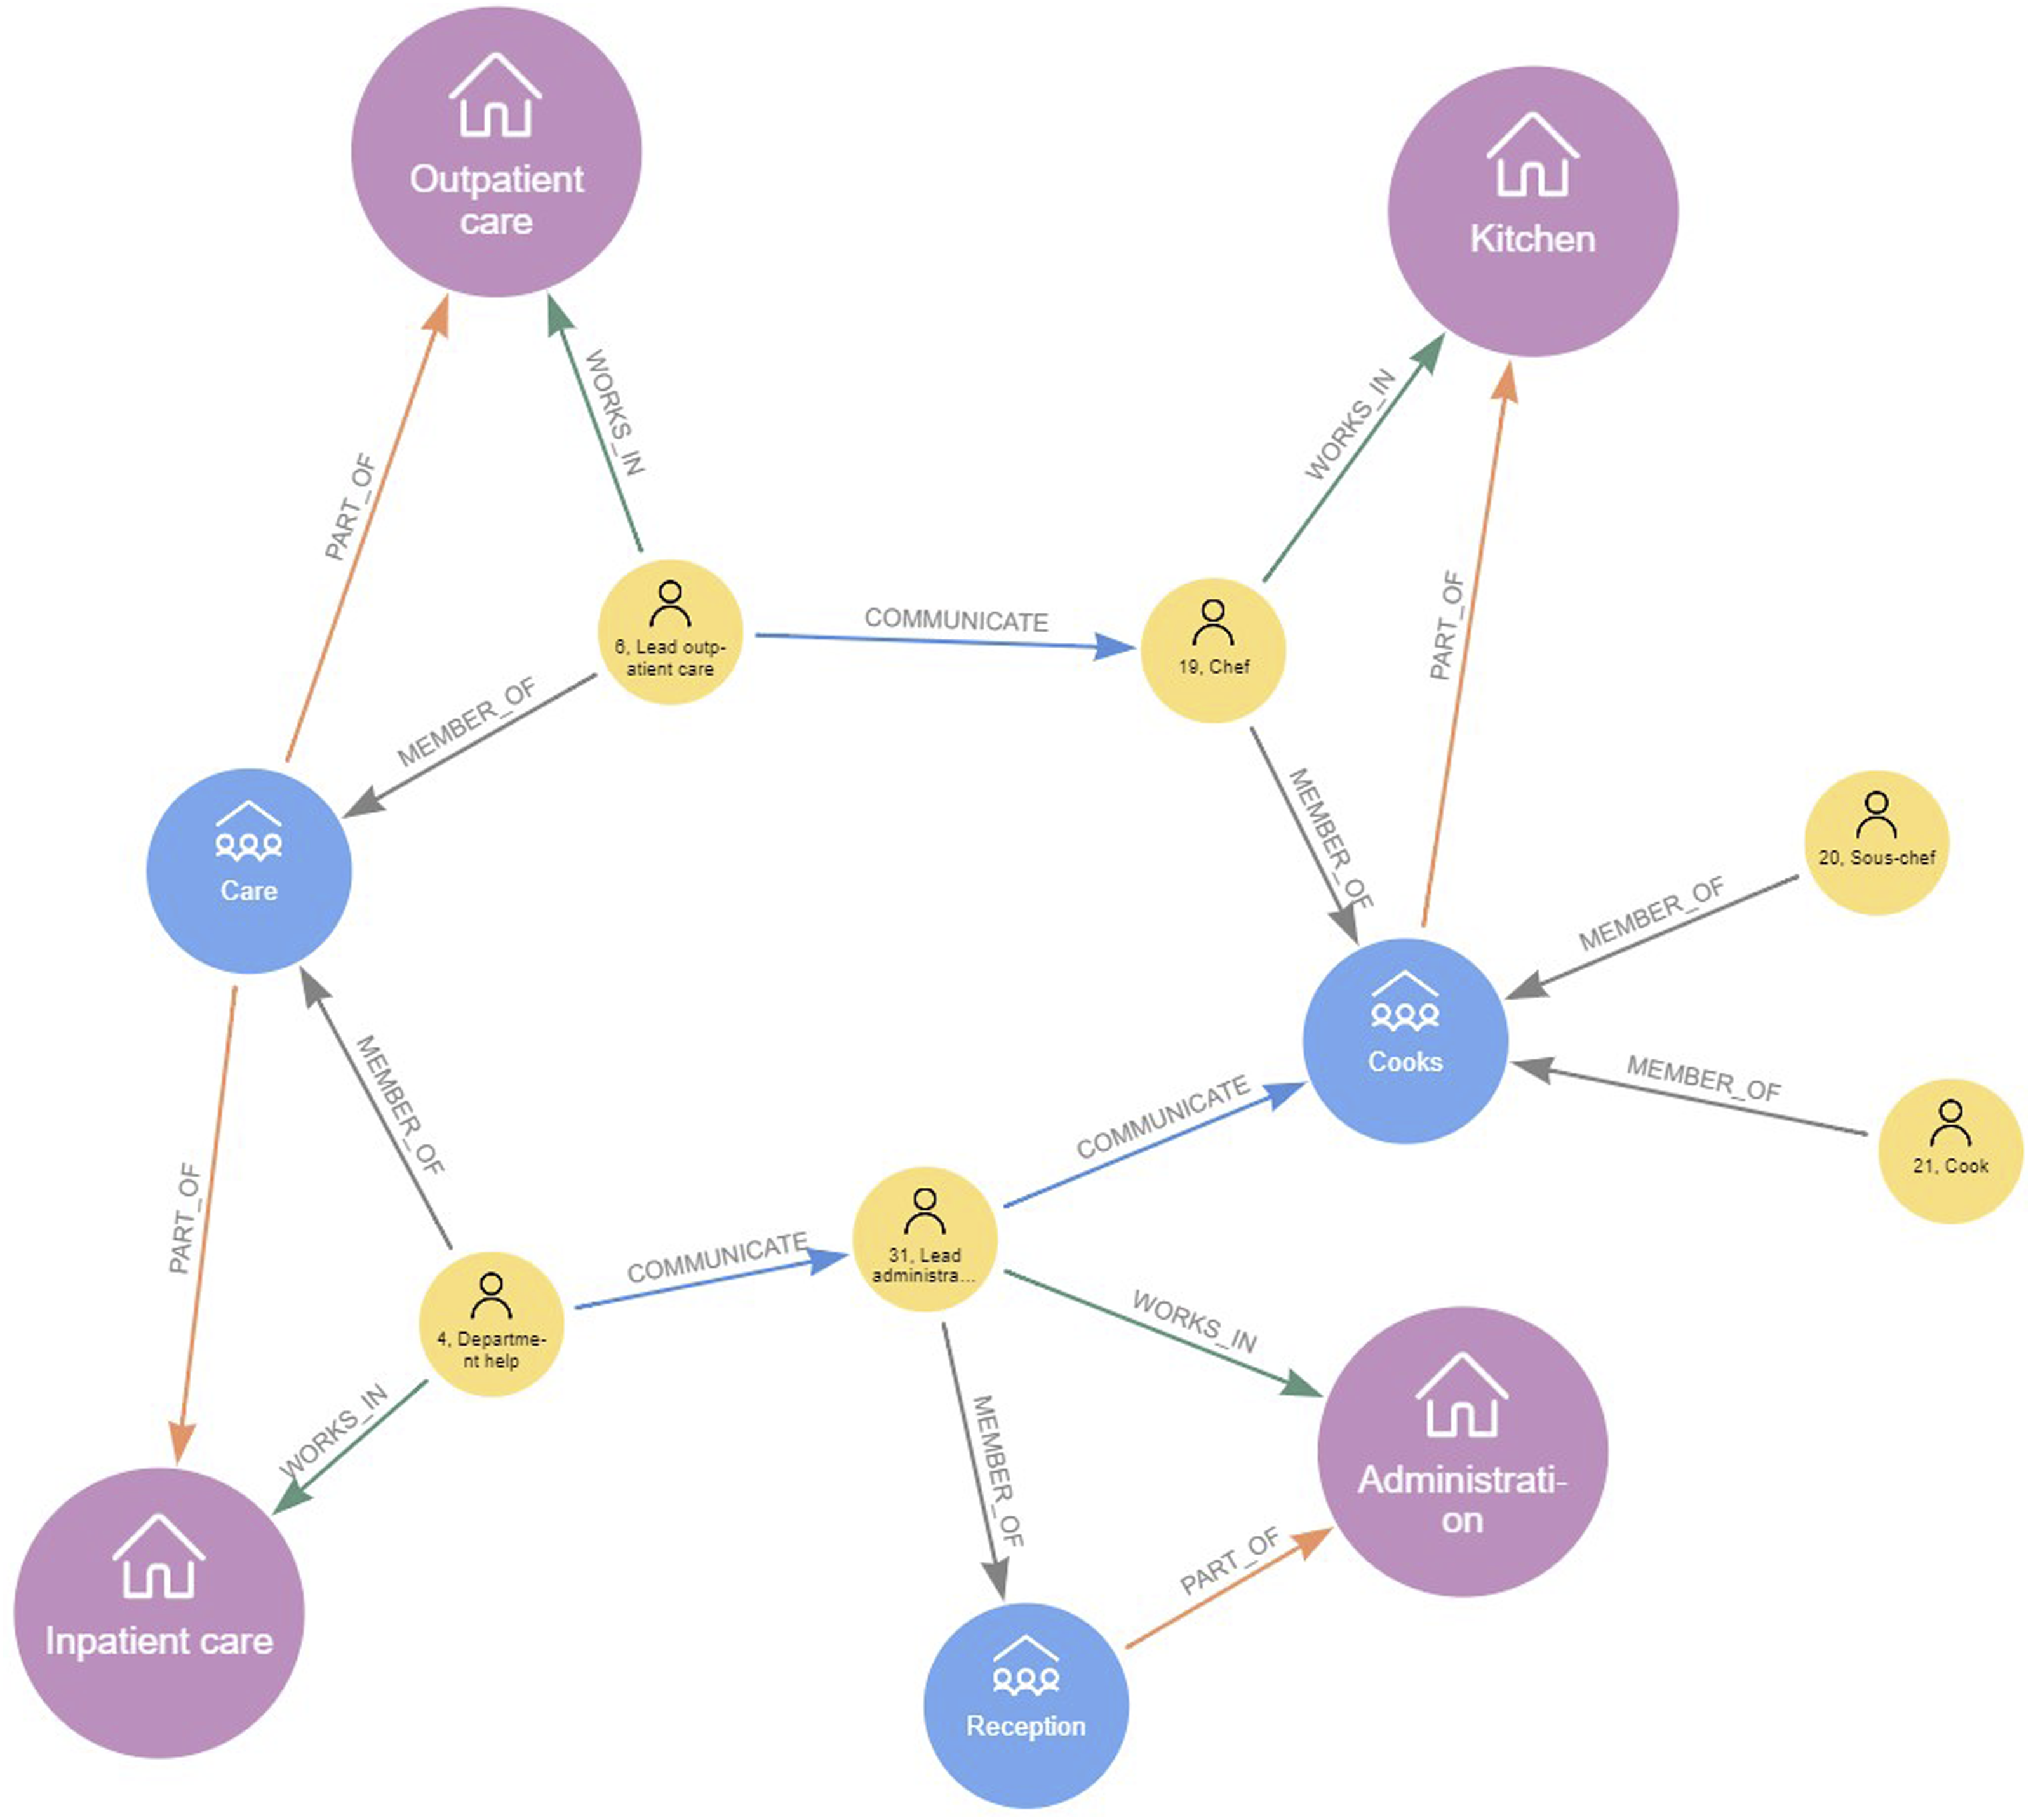
The whole network, as compiled by the first author, consists of 52 nodes, which include seven departments, eight occupational groups, 34 employees, and two non-staff members. There are a total of 242 relationships and 30 distinct reasons for communication.
Traditionally, SNA has constrained itself to analyse and visualise homogenous nodes connected through a single relationship (edge) type for various reasons. Possibly the foremost being that coherently modelling a graph with heterogenous node and relationship types is a non-trivial endeavour. This traditional SNA perspective can be seen in Figure 8 where only employee nodes and their communication relationships were selected. Although this already allows for a wide range of interpretations (hubs, satellites, etc.) and venues for further investigation (why are some nodes not connected to the graph at all?), it only conveys part of the picture. An immediate improvement would be to include a property on the communication relationship in order to distinguish between different communication reasons. While this already expands the space of possible queries substantially, the inclusion of different node types drastically tilts the usefulness of the graph towards gaining a holistic view of the interactions at work. SNA-Perspective - Employee-Employee
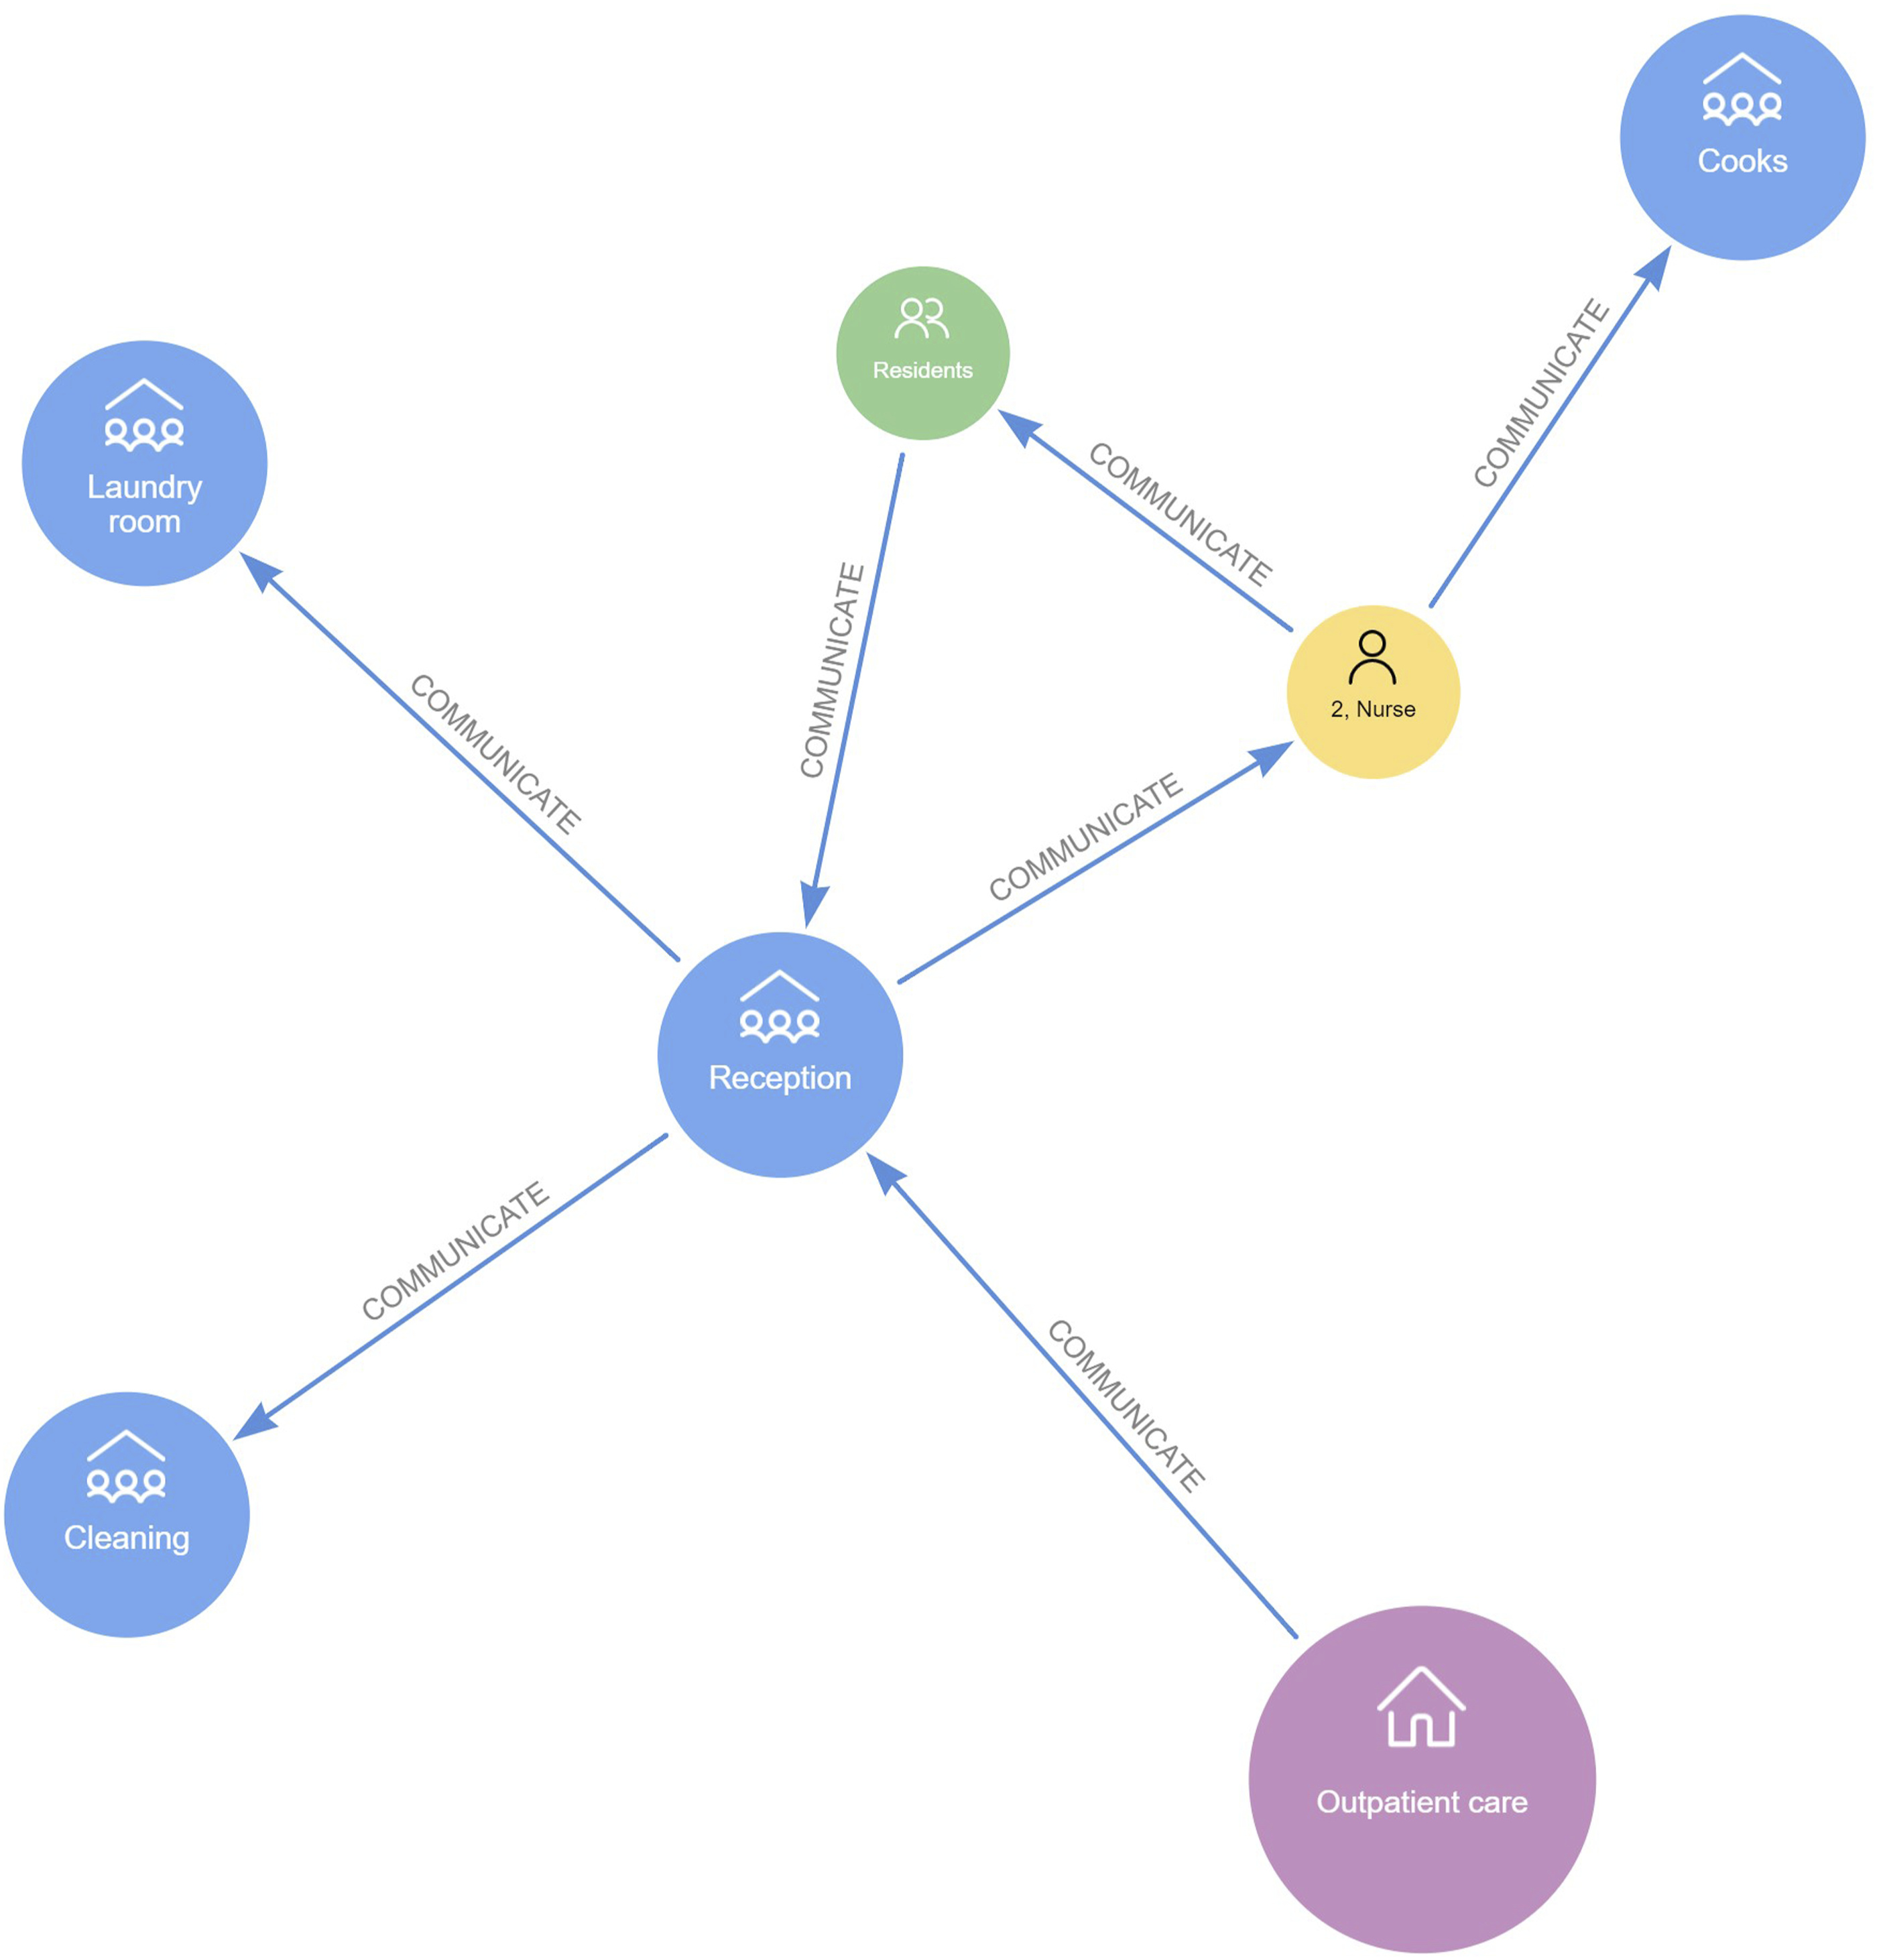
This can be seen in Figure 9, which shows that communication not only happens between employees but also between non-staff groups, departments and occupational groups. These additional node types had to be modelled to have the field data represented accurately, because in many instances individual employees would refer to their communication partners as a collective group, e.g. relatives (non-staff), instead of a single individual. The same argument applies to communication between occupational groups and departments – there are clearly communication flows happening, however individuals would often see themselves as part of a group communicating with another group on topics where the individuals involved would switch arbitrarily. All Nodes which Have a Relationship Labelled ‘COMMUNICATE’
The field data clearly showed that interactions happen on and between different (institutional) aggregation levels, meaning reality is much messier than traditional SNA would like to have it. Where analysis is often constrained to a two-dimensional view where either on both axes entities of the same aggregation (e.g. employees on x and y) are used, or one axis represents a homogenous aggregation, e.g. employees on x and departments on y. Using a property graph, however, allows not only for heterogenous node types (Figure 9), but also almost effortlessly the inclusion of different relationship types. This is displayed in Figure 10: Here, in addition to nodes of different aggregation levels, all available relationship types were selected as well. The result is a holistic view which, in addition to the communication patterns, also includes institutional and hierarchical patterns. These structural relationships reveal how the different aggregation levels are connected. Sub-graph With all Available Node- and Relationship Types
With a tailormade property graph grounded in the available field data, it is time to introduce fine-granular queries. In Figure 11, for example, a single communication reason, ‘Abnormalities regarding eating’, was chosen with the goal of presenting all involved nodes in order to extract communicational patterns. As one can tell from the graphical representation alone, there clearly is a great deal of communication with numerous actors involved going on. This stands in stark contrast to another communication reason, ’Diarrhoea of resident’ (see Figure 12). There we have a much different pattern with far less communication relationships in general. The communication flow, seemingly, is happening on a higher organisational level which is indicated by the many occupational groups involved. One should be cautious to draw the conclusion that less communication is happening, it might be that the process of diarrhoea of resident is better institutionalized with all members of each occupational group knowing what needs to be done and what communicated to whom. A general trend which can be elaborated from analysing the field data is that communicational and organisational patterns are very diverse from one reason to the next and that a lot can already be derived from the graphical representation alone. Reason for Communication – ‘Abnormalities Regarding Eating’ Reason for Communication – ‘Diarrhoea of Resident’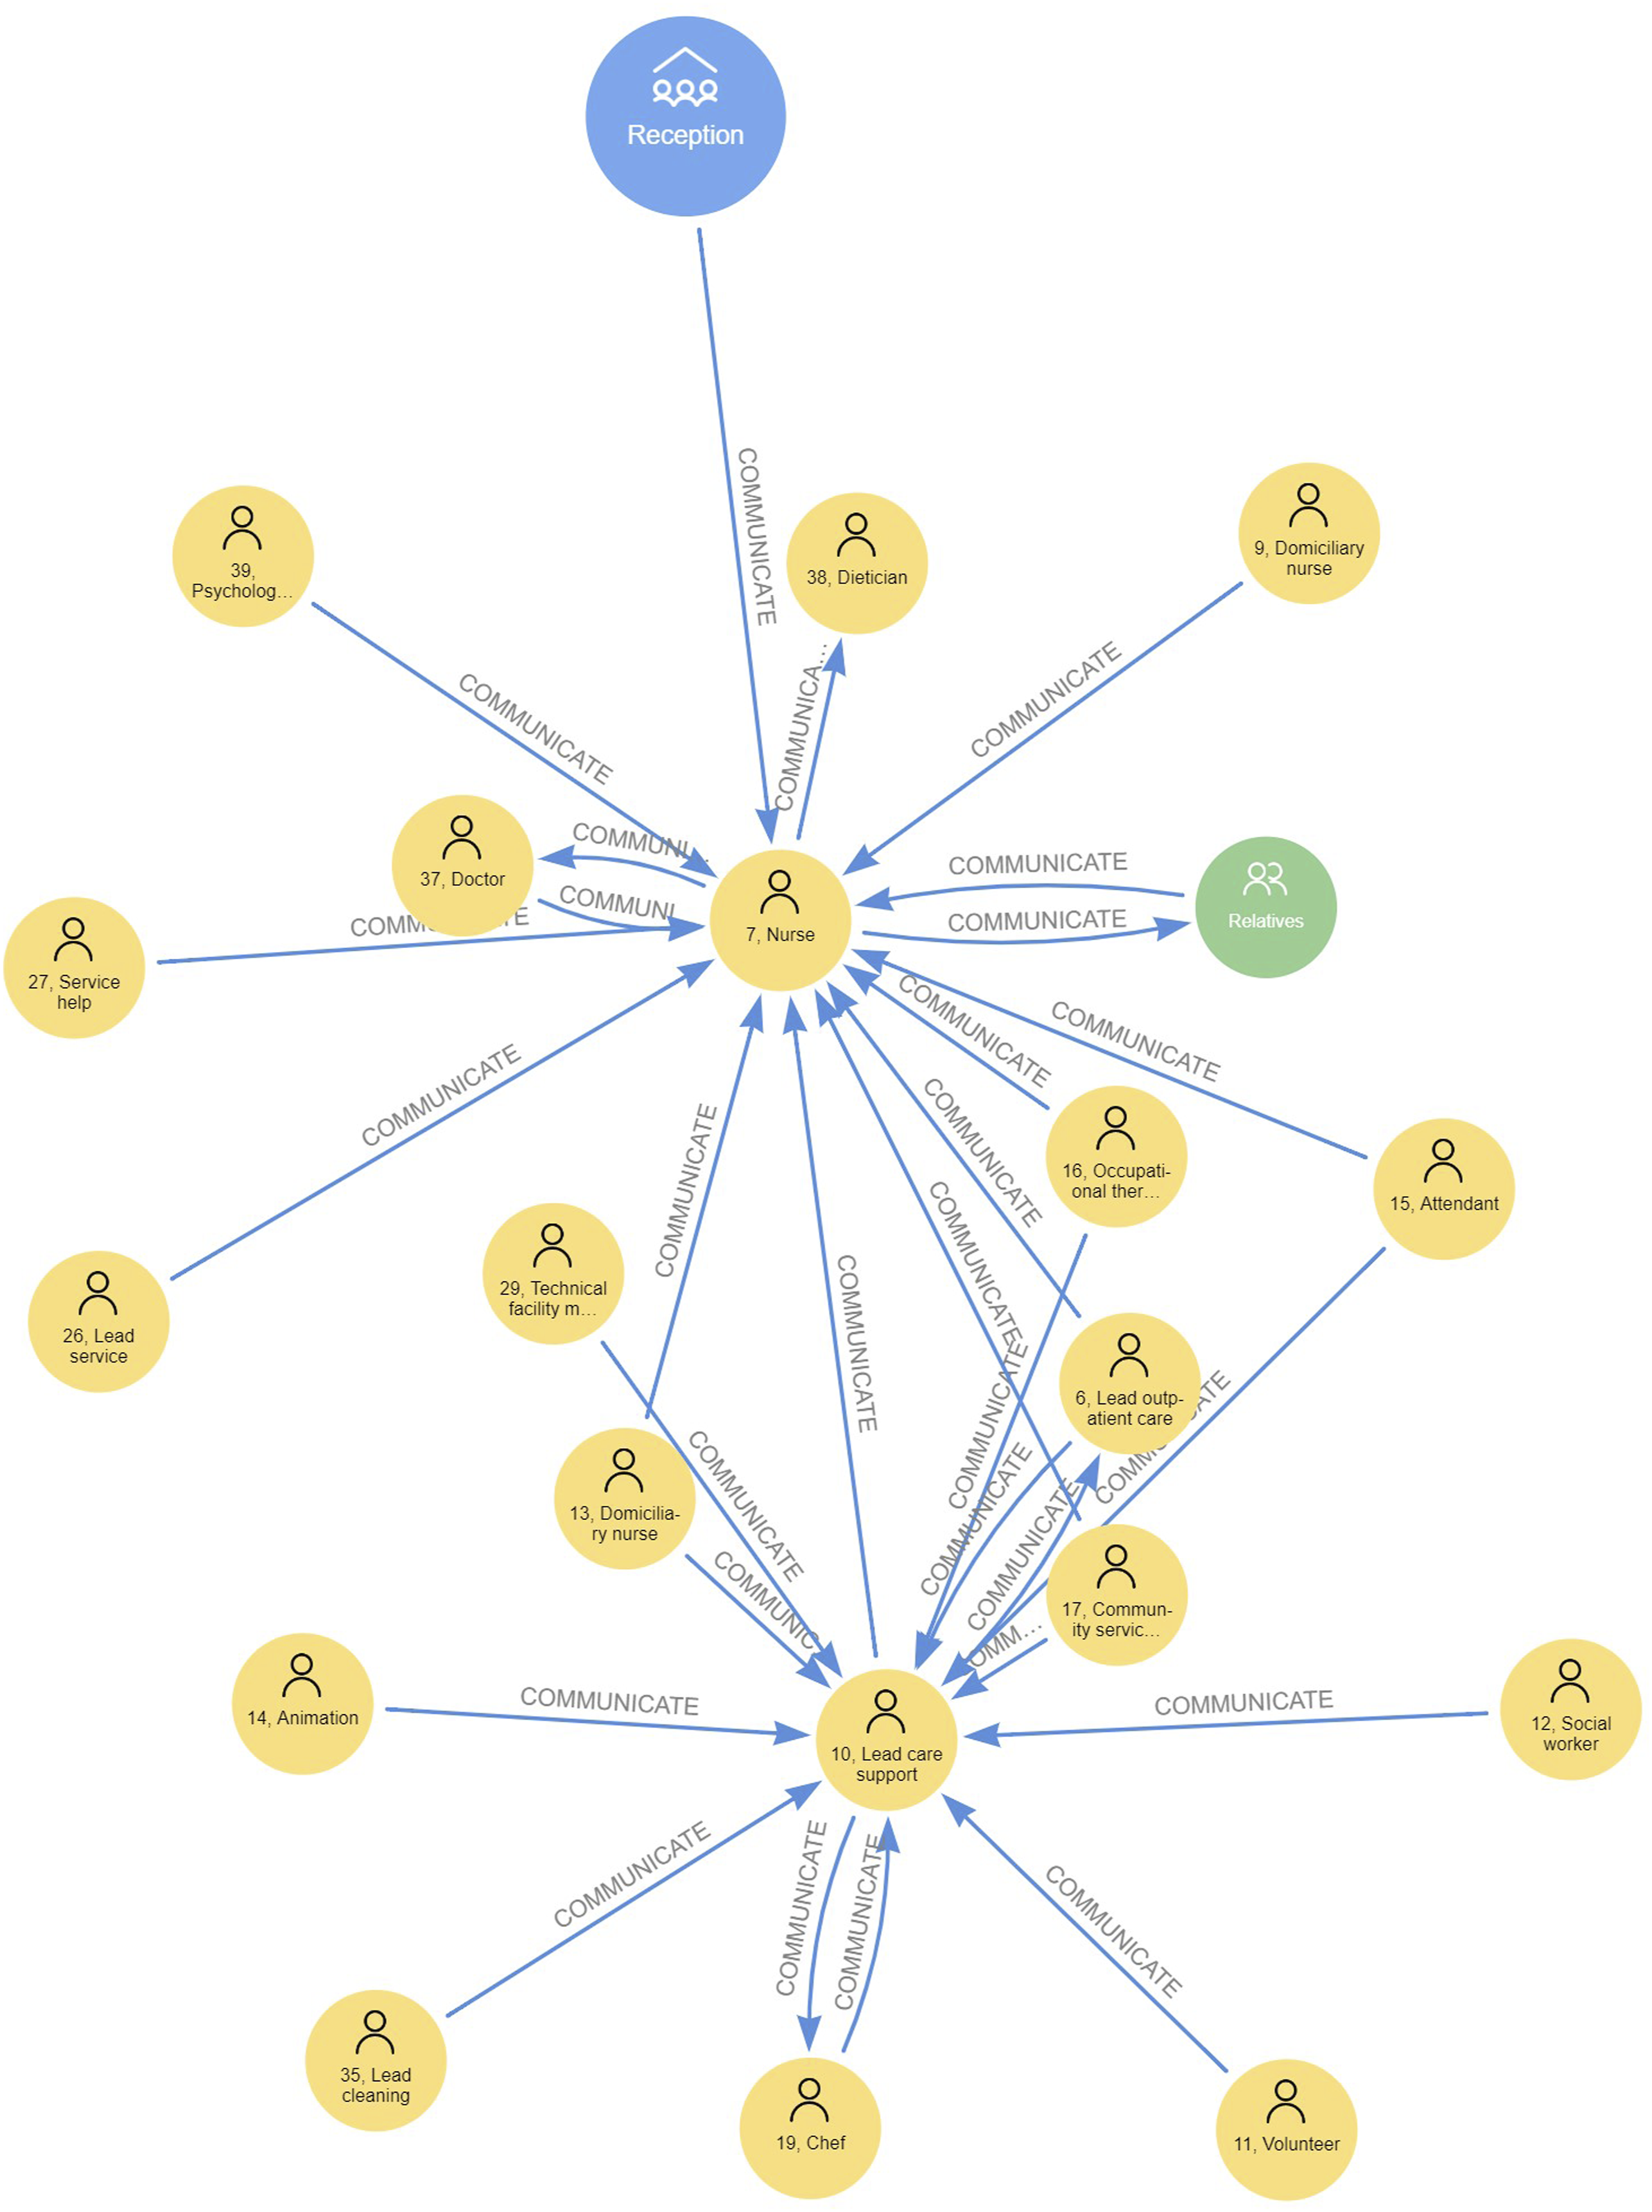
The ethnographic data, i.e. the interviews and observations, provided the foundation for developing the network structures using SNA. On-site observations showed that certain professional groups prefer certain communication channels due to factors such as workload, time pressure, or hierarchical relationships within the institution.
It became evident that communication channels are shaped by informal norms, professional roles and power relations. It strongly suggests that certain professional groups prefer certain communication channels due to factors such as workload, time pressure, or hierarchical relationships within the institution. Moreover, nursing staff who occupy a central position in the communication network tend to have been in the profession longer and have built closer relationships with their colleagues, including those in other professional groups.
Through displaying these relationships in graphs, we gain a more nuanced understanding of how social structures and power relations shape communication patterns within the nursing home by integrating ethnographic and network analysis perspectives.
Discussion
We have presented an alternative approach to deal with ethnographic network data, which allows complex data to be visualised and analysed using graph theory and network analysis (Pokorny et al., 2018). This method allows for flexibility in exploring and defining the network, enabling to capture its complex and dynamic characteristics. Moreover, it encompasses the context and nuances of relationships, making it possible to incorporate subjective perspectives and actor characteristics (Baumgarten & Lahusen, 2006; Hollstein, 2006).
This approach enables the visualisation and description of the discrepancy between the observed norms established in an organisation and informal actions on the one hand and expected ones on the other hand. This can provide valuable insights into underlying reasons for divergences (Pfaff-Rüdiger & Löblich, 2018). By applying various analytical techniques on ethnographic data, we can zoom in on individual interactions and then zoom out again to recognise patterns.
The use of SNA in the social sciences is well established, but less prevalent in nursing science and healthcare research. Furthermore, this research method has yet to gain widespread acceptance in German-speaking countries. In the US, SNA is indeed used in the healthcare setting in the area of quality assurance and intervention research (Chambers et al., 2012). The potential to effect change in practices, guidelines and behaviours is being discussed, with the possibility of influencing both patients and the quality of service provision (Saatchi et al., 2023).
To utilise graph databases for the purpose of SNA, the network schema was defined with the types and attributes of the nodes and edges. The data was then prepared for loading into the graph database; Neo4j Bloom was used to explore and communicate the network structures. Understanding stories of people involved and possibilities for action in the respective context is essential to construct the emergence of networks or dynamic change of networks (Schweizer, 1997; Schweizer et al., 1998; White et al., 2005). Our approach focused on the central tenets of networks, namely their significance, context, and dynamics. These were contextualised within the framework of actor-structure dynamics (Schimank, 2016). Thus, as we intended to show in this paper describing our procedure to understand networks of organising food in a nursing home, SNA provides a systematic way to examine specific interactions and relationships that exist within the complex communication between (healthcare) professionals at work, adding a useful new dimension (Creswick & Westbrook, 2010).
By systematically reconstructing and visualising the communication dynamics surrounding food provision, this approach not only contributes to methodological discourse but also offers practical insights into how institutional processes can be improved. Understanding how informal and formal interactions shape the food provision process allows institutions to identify inefficiencies, communication gaps, or redundant pathways that may hinder the seamless coordination between occupational groups.
Such insights can be used to optimize workflows, improve interdisciplinary cooperation, and enhance the responsiveness of institutions to residents’ needs. Moreover, making relational structures visible supports reflective management practices, where care staff and administrators can jointly reflect on their interaction patterns and co-develop improvements. In this sense, network visualisations are not only analytical instruments but also tools for organisational development.
Network analysis has the potential to facilitate the identification of key personnel who possess a high degree of interconnectivity within the organisational structure, such as, in our study, nurse managers and department heads. By analysing communication networks, researchers may be able to identify latent patterns of communication that influence decision-making, information sharing, and ultimately resident care. Network analysis thus has the potential to elucidate the manner in which organisational structures (e.g., hierarchical relationships) or communication channels may impede person-centred care.
Network analysis can shed light on various aspects of nursing science, including networks of institutional care. Examining these networks can provide a deeper understanding of their structure and dynamics, ultimately leading to improvements in care quality. Furthermore, network analysis can identify key positions within nursing networks that are vital for providing crucial information or resources for delivering high-quality care. This knowledge can help optimise the distribution of resources within care teams and improve the efficiency of care delivery overall. Additionally, analysing communication patterns in nursing networks can provide valuable insights into how nurses and patients interact. Understanding these interactions can help us develop strategies to promote more effective communication within care teams, which is essential for providing person-centred care in formal care settings. Moreover, network analysis can help us to identify factors influencing the quality of care, such as the type and frequency of communication between caregivers and patients. This information can then be used to develop targeted interventions aimed at improving care quality and reducing errors. Applying network analysis techniques to nursing science enables us to gain a more nuanced understanding of the complex relationships within care teams and identify new opportunities to improve care quality. Ultimately, this approach could transform our understanding of nursing science and significantly improve patient outcomes.
Conclusion
One of the main advantages of using graph databases for SNA lies in their ability to handle the complexity and diversity of social network data without over-simplifying them. Graph databases can also handle the dynamic and evolving nature of social network data as nodes and edges can be easily added, updated or deleted. As social networks constantly evolve and become more complex, graph databases provide a solid foundation to unlock the hidden patterns, connections, and opportunities in these networks. The SNA can be employed to demonstrate the intricacy of a given process, as well as to facilitate comparisons between processes of varying degrees of complexity. This approach allows for the identification of processes that are more strongly institutionalised, as well as those that are less so.
In nursing homes, healthcare professionals play a crucial role in shaping the dynamics of relationships related to food service. Building good working relationships with colleagues from other professional groups is essential for improving communication and collaboration. In addition, it is important to be aware of dynamics and their potential impact on decision-making processes. Studies such as these can help to analyse this, identify patterns, and thus also intervene.
For nursing home managers, promoting interprofessional collaboration between the professional groups involved in food service is essential to ensuring adequate and consistent care for residents in this complex system. This includes not only establishing processes, but also promoting open communication.
To deepen our understanding of relationships with food in nursing homes, future research should focus on longitudinal studies that examine changes over time. Analyzing complex patterns is also critical to gaining insights into the challenges faced by healthcare professionals and identifying effective strategies for improvement.
Strengths and Limitations
The strength of this study lies in the fact that with social network analysis, an innovative approach was used to analyse the interactions of almost all actors involved in the organisation of food provision in a nursing home, which were collected using qualitative ethnographic methods. The high level of complexity inherent in the ethnographic data necessitated the development of an analytical tool to facilitate the processing of this data and the identification of patterns. This made it possible to visualise structures for the first time, allowing a deeper understanding of the complex nature of social networks at hand.
However, it should be noted that, in using this method of data processing, the temporal order of the communication steps cannot be mapped, as there is no sequence. But an analysis based on the concept described here can provide indications as to which aspects should be the subject of further investigation. For example, data could be collected with a focus on the temporal progression.
Additionally, not all occupational groups could be included in an interview, which would have enriched the data generated and would have provided a more detailed picture. In general, the results may also reflect the individual perspective of the interviewees, who are employed in a specific profession and therefore perform specific tasks in the distribution of food. If another person from the same occupational group had been interviewed, the reported interactions might have varied.
The data presented in this study are limited to the information provided by the participants during data collection and supplemented by participant observation conducted in everyday life within the nursing home setting. Studies conducted at other times could lead to different results. It is also worth noting that the comparability of the study results with those of similar studies is limited, given that social network analysis is a relatively new approach. Moreover, to date, only studies employing SNA to examine advice seeking behaviour among healthcare professionals with social network analysis have been conducted within the healthcare setting (Brewer et al., 2018; Kantek et al., 2023; Sabot et al., 2020).
The use of data from multiple sources, including observations and interviews, may be limited by the availability and quality of such data. Furthermore, integrating data from different sources can be difficult and require significant resources.
The visualization of complex networks using graph theory and visualization tools may be subject to limitations in terms of scalability and interpretability. This can make it difficult to accurately represent the complexity of communication relationships within the organization, which can lead to oversimplification or misinterpretation of the results.
The calculation and interpretation of centrality metrics such as degree centrality, closeness centrality, and betweenness centrality is not appropriate for this study, as it is not a total network analysis. This means that the accurate identification of influential employees cannot be quantitatively proven.
Nevertheless, the analyses based on context-rich data permit the derivation of certain statements regarding the patterns. Social patterns are defined by the fact that, although they are unique in situational and personal terms, they occur simultaneously in conjunction with one another. The patterns that lead to similarities being identified despite the independence of the interactions and communication situations are of particular interest. Simple or simply institutionalised processes can be depicted well using corresponding patterns. Conversely, complex or ‘messy’ patterns could indicate a lack of institutionalisation or unclear process guidelines.
Footnotes
Ethical Approval
An ethic approval was deemed unnecessary according to national regulations on research ethics in Austria. An ethics approval must only be obtained for: clinical trials of medicinal products (§§ 40 ff Medicinal Products Act - AMG, BGBl. No. 185/1983 in the version BGBl. I No. 35/2004); medical devices (§§ 57 ff Medical Devices Act - MPG, Federal Law Gazette No. 657/1996 as amended by Federal Law Gazette I No. 119/2003); the use of new medical methods and non-interventional studies (NIS) (§ 48 AMG in the version BGBl. II No. 180/2010 or § 66 MPG); applied medical research; nursing research projects (experimental or nursing intervention studies), new nursing and treatment concepts and new care and treatment methods (§ 15a Wr. KAG, LGBl. für Wien Nr. 23/1987, KAKuG, BGBl. Nr. 1/1957). Since the present study is not one of the above mentioned study types, an ethical approval was not required, and thus the project was not reviewed by an ethics committee.
Consent to Participant
All participating nursing home staff were informed verbally and by a handout at initial contact. In case of participant observation, consent was repeatedly obtained inter actively in the situation (ongoing consent). In case of scheduled interviews, written consent was obtained.
Funding
The author(s) received no financial support for the research, authorship, and/or publication of this article.
Declaration of Conflicting Interests
The author(s) declared no potential conflicts of interest with respect to the research, authorship, and/or publication of this article.
Data Availability Statement
Ethnographic data are not publicly available as they contain information that could compromise research participant privacy. Network data is planned to be made publicly available as soon as the attempted PhD Degree is reached. As this article is part of a cumulative dissertation.