
Abstract
Mixed methods researchers need tools for planning and demonstrating integration. Mixed methods joint displays have a growing presence in the literature for representing mixed methods findings, and for use as an analytic tool as in the case of joint display analysis. However, the joint display of integrated data collection represents a lesser-known application for use by mixed methods researchers. A joint display for integrated data collection links the qualitative and the quantitative data collection questions, scales, and/or items. Here we demonstrate how joint displays of integrated data collection can be used as a planning, implementation, and presentation tool to illustrate integration of the data collection process. We examine variations in joint displays of integrated data collection based on three core mixed methods designs, a convergent design, and two sequential mixed methods designs, and provide examples of each from the literature. We recommend the joint display of integrated mixed data collection as a highly effective tool for mixed methods researchers to use for planning, implementing, and representing integrated data collection in their mixed methods projects.
Introduction
Mixed methods (MM) research continues to grow in popularity, yet many challenges remain for researchers who wish to optimize integration in their empirical studies. In one of the earliest empirical studies about integration, the late Alan Bryman (Brannen, 2018) found that many MM researchers did not achieve their stated intent of integration in their MM studies (Bryman, 2006). O’Cathain et al. (2008) identified this as a problem of quality in health sciences research studies. One advance in the field has been recognition of the opportunities for integration. Fetters et al. (2013) emphasized three levels for integration in MM studies through the design, the methods, and representation and reporting. Fetters and Molina-Azorin (2017) expanded the view about integration in the MM integration trilogy where they identified 15 dimensions for integration. The recent release of a virtual special issue on integration from the Journal of Mixed Methods Research further illustrates the breadth of approaches to integration (Guetterman et al., 2021).
Despite this expanded understanding of dimensions for integration, multiple systematic reviews or prevalence studies persistently have shown lack of integration, undeveloped integration, lack of clarity of integration, and minimal integration among many published empirical MM studies (McManammy et al., 2015; Bressan et al., 2017; Steinmetz-Wood et al., 2019; Younas et al., 2019; Fabregues et al., 2020; Granikov et al., 2020; Irvine et al., 2019). Thus, while scholars in published methodological research have discussed the potential for integration conceptually, the practicality of integrating lingers as a substantive challenge MM researchers face.
One way to help overcome this challenge involves advanced thought about how to integrate data during the planning stage to facilitate preparation for facile merging of qualitative and quantitative data during the analysis stage of the research project. But doing so requires researchers to represent how the data collection procedures were integrated between the qualitative and quantitative strands. Several integration strategies have been identified. The use of the integration strategy of matching (Fetters, 2020, p. 126) involves collecting qualitative and quantitative data intentionally about common constructs. The use of matching during the design phase denotes a procedure that facilitates integration of the qualitative and quantitative strands during the analysis. The integration strategy of building reflects using the findings of one strand to construct items or questions for the other strand (Fetters et al., 2013). The use of the integration strategy of connecting denotes how participants from one strand of the study are used to identify participants for the other strand of the study (Fetters et al., 2013).
Methodologists have shown the utility of joint displays for depicting integration outcomes in MM studies (Guetterman, Fetters, & Creswell, 2015; Guetterman et al., 2021). Unfortunately, systematic reviews have noted the relative lack of joint displays, and specifically called out the potential for their greater use (Bartholomew & Lockard, 2017; Younas et al., 2019; Fabregues et al., 2020; Fabregues et al., 2022). In a specific systematic review of visual joint displays, (Guetterman, Fetters, & Creswell, 2015) examined the prevalence of joint display use and described advances and innovations found in published studies. Among the papers featuring visual joint displays, a convergent MM design was found to be the most common (Guetterman et al., 2021), a trend seen also in an earlier paper about joint displays (Guetterman, Fetters, & Creswell, 2015). This finding is not surprising since researchers using a convergent design will be able to present readily both types of results after merging into a joint display of findings.
In our view, a key challenge to achieving integration in many MM empirical projects has been the lack of clear articulation during the design and planning stage about how collected qualitative and quantitative data will be matched, linked, and integrated. Taking such steps during the design phase provides a clear rationale and formulation of how integration will occur during the methods. Moreover, the forethought invested in the details of mixed data collection planning can reap efficiency for the merging of the mixed data.
A joint display of integrated MM data collection provides a tool to fill this need. (Fetters, 2020) describes a joint display of MM data collection as a “…table or matrix depicting how both qualitative and quantitative data collection procedures have been matched to ensure collected data will address related study constructs, or for sequential designs, how the constructs of one type of data collection procedure were used to inform the constructs addressed in the subsequent, other type of data collection.” (p. 194)
However, an important gap in the literature remains as research focused just on the joint display of integrated MM data collection has been lacking.
To summarize, the existing literature demonstrates integration has long been and continues to be a challenge for MM researchers, and that applications of joint displays remain underutilized even though increasingly recognized as a tool to facilitate and represent integration by MM researchers. Despite the recent methodological reviews of MM design features including joint displays, there are no known articles focused exclusively on explicating the features and the use of joint displays of integrated data collection.
In this article, our purpose is to delineate the features and function of the joint display of integrated data collection as a practical methodological tool for MM inquiry. To provide context for this focused examination on joint displays of integrated data collection, our approach involves distinguishing how they compare with two other types of joint displays, namely, joint displays representing mixed data findings and joint displays of mixed data analysis. With an understanding of its unique place in MM research, we then characterize three applications of joint displays of integrated data collection that is followed by comparing variations in joint displays of integrated data collection according to the three core designs typology as popularized by Creswell and Plano Clark (2018). We also provide three examples of published joint displays of integrated data collection for each core design to represent how authors achieved integration when planning and conducting MM studies using the three core designs. We finish with a discussion of limitations of this analysis and future steps.
Three Variations in the Use of Joint Displays
Joint Display for Representing Mixed Methods Findings.

MM = mixed methods, Qual = qualitative, Quan = quantitative.
Joint Displays of Mixed Methods Findings
Joint displays of MM findings command attention as a powerful mechanism for representing integrated or merged MM data findings (Table 1). A joint display of MM findings is a visual representation using a variety of structures for juxtaposing presentation of the qualitative and quantitative findings (Fetters, 2020, p. 273). A joint display framework to integrate and represent MM integrated analysis can consist of tables, matrices, and figures (Guetterman, Fetters, & Creswell, 2015). The juxtaposing of quantitative results and qualitative findings side-by-side facilitates researchers drawing meta-inferences to gain new insights about the topic of a MM investigation (Guetterman, Fetters, & Creswell, 2015; Plano Clark & Sanders, 2015).
MM researchers have created innovative uses of joint displays to represent findings. The earliest examples were largely restricted to the juxtaposition of numerical findings and text (Wittink et al., 2006) while subsequent versions came to include the “fit” (Fetters et al., 2013) between the qualitative and quantitative findings (Lee & Greene, 2007). Guetterman, Fetters, & Creswell, 2015 reviewed a variety of published joint displays from the health sciences and organized these according to four designs. While several variations were identified, two formats, side-by-side joint displays, and statistics-by-themes joint displays, were most common for reporting MMR findings. In their systematic review of joint displays published 6 years later Guetterman et al. (2021) also found that the format of a table or matrix to present mixed data findings was most common, but also noted an increase in the use of other types of visual joint display representations.
One of the early visual enhancements to the joint display beyond numerical findings, was the use of box plots to represent quantitative data and link with qualitative data (Fetters et al., 2013; Legocki et al., 2015; Beck et al., 2016; Fetters & Guetterman, 2021). Legocki et al. (2015) demonstrated in a series of six joint displays with box plots the potential to examine not only a single construct in one joint display, but also the utility of looking across multiple joint displays to draw more comprehensive findings. Another iteration has been the use of histograms (Bradt et al., 2014; Haynes-Brown & Fetters, 2021). In a more basic form of integration as seen in Bradt et al.’s (2014) work, qualitative themes were embedded into the bars of the histograms to illustrate how two groups compared quantitatively on a measure, and qualitatively be themes. Haynes-Brown and Fetters (2021), further illustrated the use of coloring and other conventions for making comparisons among teaching cases.
Another variation has included the use of photos (Peroff et al., 2020; NeMoyer et al., 2020). Others have moved away from a matrix or table style into other creative formats, e.g., as circular joint display (Bustamante, 2019), mapping (Teixeira, 2016; Kieber-Emmons et al., 2022), figures (Takeuchi et al., 2021), and Venn diagrams (Ling & Pang, 2021). Tajima and Fetters (2021) developed a variation for comparing two groups in an interventional study that featured in their joint displays pre- and post-intervention quantitative, qualitative, and MM interpretations as meta-inferences. In another innovative format, Kamei et al. (2021) demonstrated the process of identifying “global meta-inferences” drawn at the end of fully longitudinal MM study where meta-inferences made across both types of data at five specific timepoints were then examined across the entire study. A recent unique twist has been the extension of the work of Legocki et al. (2015) to look for meaning across multiple joint displays. Peters et al. (2021) used a single joint display to consolidate the findings of multiple joint displays.
The methodological literature has provided several resources for building a joint display (Johnson et al., 2019; Guetterman, Creswell, & Kuckartz, 2015; Fetters, 2020). Johnson et al. (2019) described the pillar integration process for building a joint display by aligning the qualitative and quantitative findings in outside columns and identifying MM linkages in between. Guetterman, Creswell et al. (2015) illustrated approaches for creating joint displays using software. Fetters created a MM joint display linkage exercise for identifying commonality between the qualitative and quantitative findings involving six steps (2020, pp. 201-205). As shown in the following, researchers have also gone a step further to characterize how the building process represents analysis (Fetters & Guetterman, 2021).
Joint Display Analysis
Joint display analysis is a second variation on the use of joint displays (Table 1). Joint display analysis has been defined as, “the process of discovering linkages between the qualitative and quantitative constructs, organizing, and reorganizing the findings into a matrix or figure to optimize the presentation as a finalized joint display (Fetters, 2020, p. 194).” Joint display analysis debuted as a specific mechanism for not just presenting mixed data but recognizing that the process of creating a joint display represents a sophisticated approach for analyzing mixed data and developing meta-inferences about the fit of the mixed data. Joint display analysis indicates that the process of creating an effective joint display involves selecting the specific qualitative and quantitative data to use, the specific format for each type of data, adjusting the organization of the two types of data, and using creative ways such as color or formatting which provides a mechanism to obtain a deeper understanding and meaning of the mixed data findings.
Recognition of joint display analysis is a development that can be traced in the literature to the late 2010’s as MM methodologists began recognizing that there was more to the use of MM joint displays than just representing integrated findings. While somewhat implicit in their discussion of the pillar integration process (Johnson et al., 2019), the methodological description focused primarily on the building process without explicitly characterizing the process as analysis. In an explicit description of joint display analysis, Guetterman, Creswell, & Kuckartz, 2015 illustrated how to create a joint display using software. Fetters and Guetterman (2021) and Guetterman and Fetters (2022) explicitly introduced steps of joint display analysis. Fetters and Guetterman (2021) illustrated the process conceptually based on a published example (Fetters et al., 2013; Legocki et al., 2015). They illustrated seven steps taken to create a joint display with box plots for publication, how they gained insight with each iteration, and how the process contributed to their analysis and drawing of meta-inferences (Fetters & Guetterman, 2021). Haynes-Brown and Fetters (2021) illustrated joint display analysis in study examining teacher’s use of technology in the classroom. They explained how their team developed multiple joint displays using histograms to make sense of the MM data, and again illustrated how additional insights were obtained with each iteration of their figures and have provided guidance as well.
Joint displays increasingly include assessments about the fit of mixed data findings. The fit of the mixed data refers to how the mixed data reflect both qualitative and quantitative findings about constructs common to both types of data (Fetters et al., 2013). Fetters et al. (2013) described fit as expressing the level of “coherence of the quantitative and qualitative findings.” A full description of fit in MM studies is beyond the scope of the current article, but the assessment of fit has been a noteworthy advance in MM analysis in the context of making interpretations across both the qualitative and quantitative data, and making meta-inferences relative to overall MM findings as part of the MM analysis.
Joint Displays of Integrated Mixed Methods Data Collection
A third use of joint displays involves representing integrated MM data collection (Table 1). While a recognized variation on the use of the joint display (Fetters, 2020, pp. 195-197), the literature contains relatively few published examples of joint displays of data collection. In describing variations according to the MM designs, (Fetters, 2020, p. 194) distinguished between applications prior to the onset of data collection and analysis where the intent is planning, and after completion of data collection where the purpose is representing how the MM data collection was integrated during data collection. Accordingly, we now focus on joint displays of integrated data collection in greater detail by examining three applications, and then describing how they vary according to three core MM designs.
Three Applications of Joint Displays of Integrated Data Collection
Applications of joint displays of integrated MM data collection vary based on timing during the study relative to planning, implementing, or disseminating information regarding the integrated data collection procedures.
Planning Application
During the planning stage of a MM study, researchers can create a joint display of integrated MM data collection. In developing a joint display at this time, researchers can make a detailed plan for data collection before the onset of data collection. Doing so ensures matching, that is, taking steps to intentionally address concepts or constructs that are being investigated within both the quantitative and qualitative strands when designing a study (Fetters, 2020, p. 126). By doing so, MM researchers are prepared to merge both qualitative and quantitative findings across constructs addressed by both types of results. Such a joint display can be used in a proposal to a dissertation committee duly noting that the joint display may evolve in response to feedback. This type of joint display can also be found in research proposal applications to illustrate to grant reviewers and funders the careful thought that went into planning of an integrated MM study. Saint Arnault and Fetters (2011) and Wu et al. (2018) used joint display of integrated data collection planning in research applications for funding that they subsequently published to illustrate their planned data collection.
Implementing Application
While implementing a MM study, researchers may adapt their data collection strategies by adding study instruments or new interview questions based on emerging findings. In our experience on studies and when consulting on other projects, this most commonly occurs in sequential designs because after the first phase of data collection and analysis, it is common for studies to produce results that were unexpected or could not be anticipated. Hence, the researcher wants or needs to address related data collection in the second phase of the sequential design. In this circumstance, a researcher can “update” joint displays of integrated MM data collection. Not only is this possible, adapting under such circumstances arguably is preferable since a common intent of a MM approach is to develop a holistic understanding of the phenomenon of interest. For example, in a study collecting qualitative data initially, the resulting themes, sub-themes, and quotes can be used to create scales, questions and responses, respectively. Alternatively, in a study collecting quantitative data initially, the resulting findings may generate specific questions for asking in a subsequent qualitative interview phase.
Disseminating Application
Researchers often want to represent for dissemination of their studies how data collection procedures were integrated after the mixed data collection is complete. Such displays may also be found in dissertations in the methods section, or during oral presentations at scientific meetings. Joint displays of integrated MM data collection can be found in the literature where MM researchers choose this format to indicate how the MM data collection was integrated (Moseholm et al., 2017; McCrudden & McTigue, 2019; Howell Smith et al., 2020). Reviewers and consumers of published MM studies need to be convinced that researchers conducted their MM studies rigorously. A published joint display provides a clear means to show the rigor of the integrated MM data collection.
Having established these three applications of joint displays of integrated data collection, we now compare the variations in integrated MM data collection according to three core MM designs.
Variations in Joint Displays for Integrated Data Collection among Three Core Mixed Methods Designs.

Qual = qualitative, Quan = quantitative.
Joint Display for Integrated Data Collection Representation in Three Core Mixed Methods Designs
Creswell and Plano Clark (2018) provide a popular and widely used typology of three core MM designs that provides a framework for considering joint displays of integrated data collection (Table 2). This typology includes a convergent design, explanatory sequential MM design, and an exploratory sequential MM research design. While many methodologists will be familiar with the three core designs and how these core designs are building blocks for other more advanced MM designs, we review these to eliminate any possible confusion relative to how variations in joint displays of mixed data collection occur based on key features of these designs. Table 2 illustrates the three core MM designs, the integration intent, the timing, and process and function. With the description of the variations according to each design, we provide published examples of joint displays of MM data collection for each of the three core MM designs. Variations in function of joint displays of integrated MM data collection occur based on the timing during the study relative to planning, implementing, or representing after data collection the integrated data collection procedures used in the MM study.
Convergent Mixed Methods Design
A convergent design involves data collection and analysis of both the qualitative and quantitative strands before merging the findings (Creswell & Plano Clark, 2018). Also called a concurrent design by Tashakkori and Teddlie (2009) and Tashakkori et al. (2021), the design is characterized by the data collection and analysis of both qualitative and quantitative data at approximately the same time. Doing so ensures that once the data have been collected, there will be findings from both the qualitative and quantitative strands that can be linked according to the constructs in common in the data collection approaches. The language of “approximately” implies that the data collection and analysis within each strand, the qualitative and the quantitative, are typically, but not always complete, if there is iterative analysis before beginning to integrate the findings by merging.
Example of a Joint Display of Integrated Data Collection for Planning in a Study using a Convergent Mixed Methods Research Design by Wu et al. (2018).

Notes. Provider Survey (
Source. Wu et al. (2018, Supplement). With permission.
Sequential Designs
The other two core designs are both sequential designs, where the data collection and analysis of one strand typically is completed and then used to inform the subsequent data collection and analysis of the other strand. Teddlie et al. (2021), subsumes both categories as just sequential designs. Other methodologists mostly distinguish between the two variations of sequential, e.g., Creswell & Plano Clark (2018); Fetters, 2020; Plano Clark & Ivankova (2016).
Explanatory Sequential Mixed Methods Design
In the explanatory sequential MMR design (Creswell & Plano Clark, 2018), which has also been called a Quan to Qual sequential design (Plano Clark & Ivankova, 2016), the data collection and analysis of the quantitative strand comes first. The quantitative strand findings are then used to inform subsequent qualitative strand data collection and analysis before a final step of merging the overall findings. In this type of design, MM researchers can use the integration strategies of connecting and building. Connecting indicates the use of a sampling strategy of participants for the qualitative phase based on findings from the initial quantitative phase. Additionally, the strategy of building applies because findings from the initial quantitative findings are used to build the content of the qualitative data collection instruments. In this way, findings from the first phase inform the data collection of the second phase. The use of the joint display of integrated data collection illustrates explicitly how results from the Quan phase are used to inform the data collection of the subsequent Qual phase.
Example of a Joint Display of Integrated Data Collection in a Study Using an Explanatory Sequential Mixed Methods Research Design by McCrudden and McTigue (2019).

Source. McCrudden et al. (2018, Table 2, p. 388). With permission.
Exploratory Sequential Mixed Methods Design
In the exploratory sequential MMR design (Creswell & Plano Clark, 2018), alternatively known as a Qual to Quan sequential design (Plano Clark & Ivankova, 2016), the data collection and analysis of the qualitative strand comes first. The qualitative strand findings are then used to inform subsequent quantitative strand data collection and analysis before a final step of merging. In this type of design, MM researchers can use the integration strategy of building. The integration strategy of building (Fetters et al., 2013) applies because the initial qualitative findings, e.g., themes, codes, and quotes, are used to build the scales, stems, and items of the subsequent quantitative data collection instrument distributed in the second phase of the sequential design. In this way, findings from the first phase inform the data collection of the second phase. The use of the joint display of integrated data collection illustrates explicitly how results from the Qual phase are used to inform the data collection of the subsequent Quan phase.
Example of a Joint Display of Integrated Data Collection in a Study Using an Exploratory Sequential Mixed Methods Research Design by Howell Smith et al. (2020).
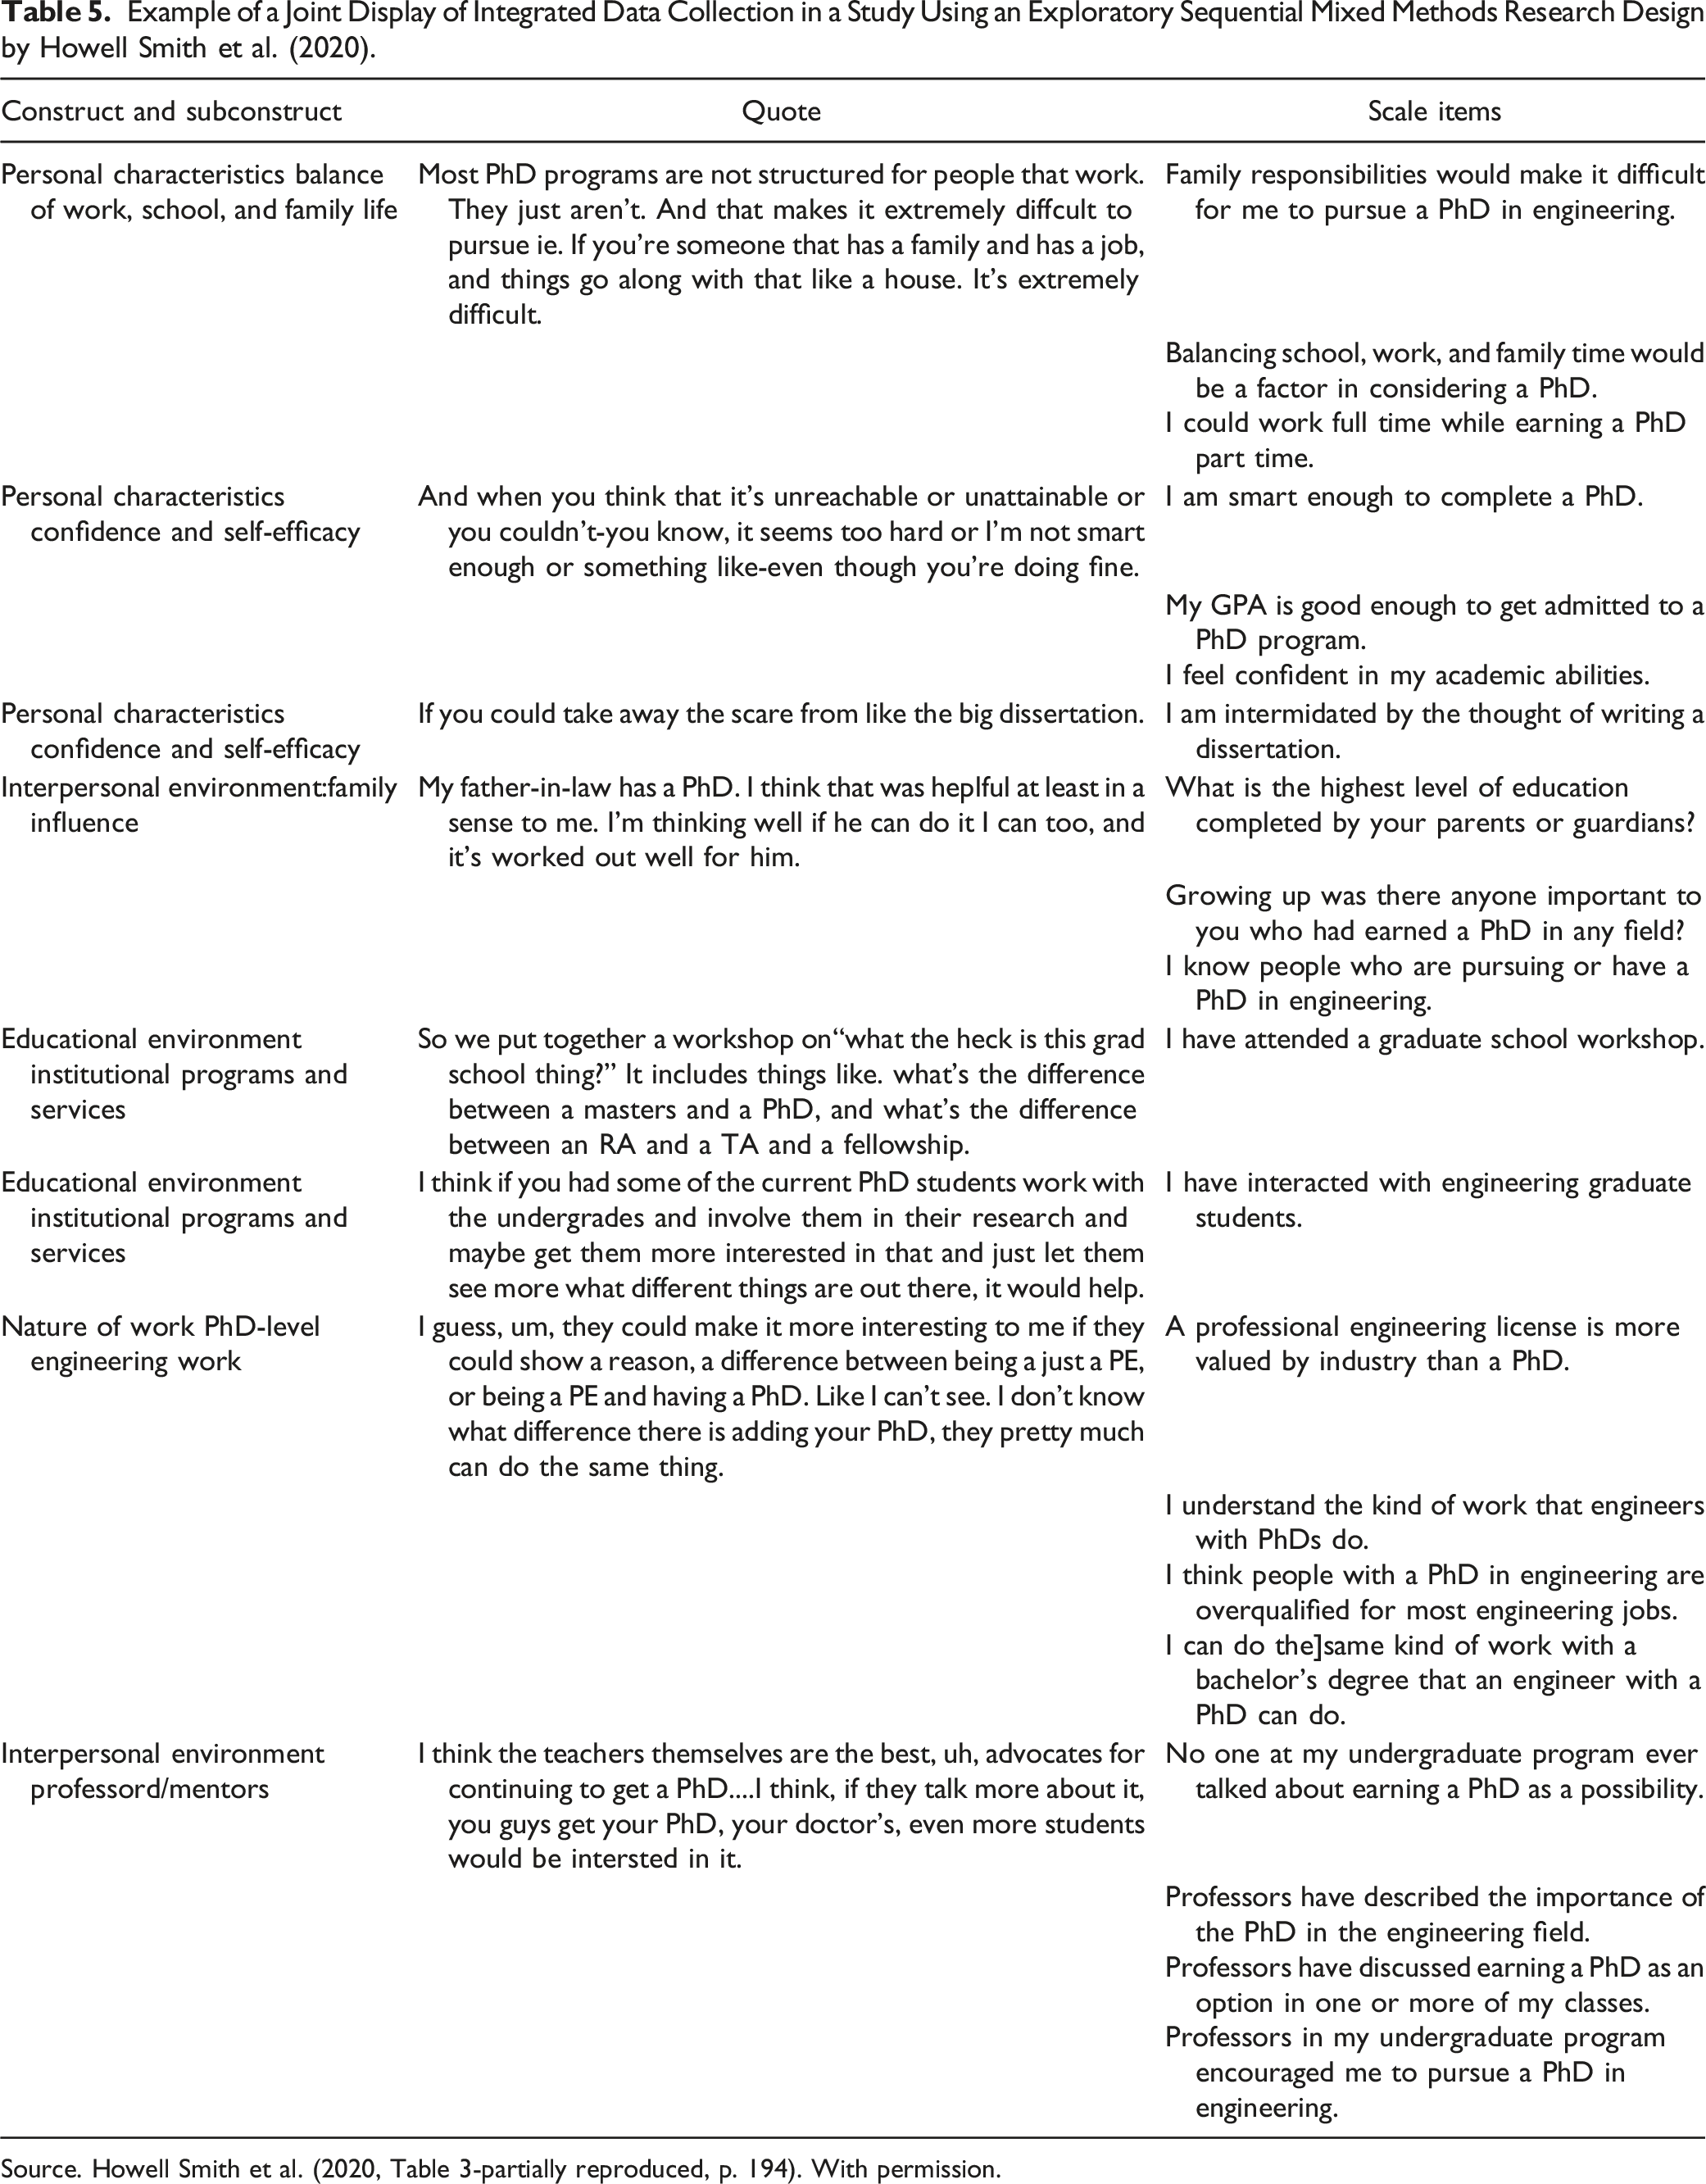
Source. Howell Smith et al. (2020, Table 3-partially reproduced, p. 194). With permission.
Discussion
This paper makes a noteworthy contribution to the MM methodological literature by first differentiating the joint displays of integrated data collection from joint display of mixed methods findings and joint display analysis. Second, the article distinguishes three applications of joint displays of integrated data collection, namely, planning, implementing, and representing integrated mixed data collection. The former two represent a process while the latter is an outcome. Third, the article illustrates variations according to integration approaches in the three core MM designs relative to intent, structure, and content of joint displays.
The featured examples provide a window into other dimensions that researchers are adding into their joint displays. Wu et al. (2018) demonstrated the addition of columns for overarching constructs of inquiry with explicit linking of theory to the data collection, and the addition of item numbers from data collection instruments used in the study. McCrudden and McTigue (2019) added the rationale for data collection items developed for the study (p. 388) and featured a joint display of integrated data collection based on the identification of participants for the study (p. 387). Howell Smith et al. (2020) illustrated the progression from integrated data collection to development of the grounded theory model. The innovations from these exemplars serve as a reminder that methodologists should continue to experiment with additional features that can enhance understanding of integration in MM studies through their joint displays of integrated data collection. As a rapidly evolving approach in MM research methodology, more examples are needed. Future research utilizing systematic reviews could yield more examples and variations.
Distinguishing between Joint Displays of Data Collection and Findings in Sequential Mixed Methods Designs.
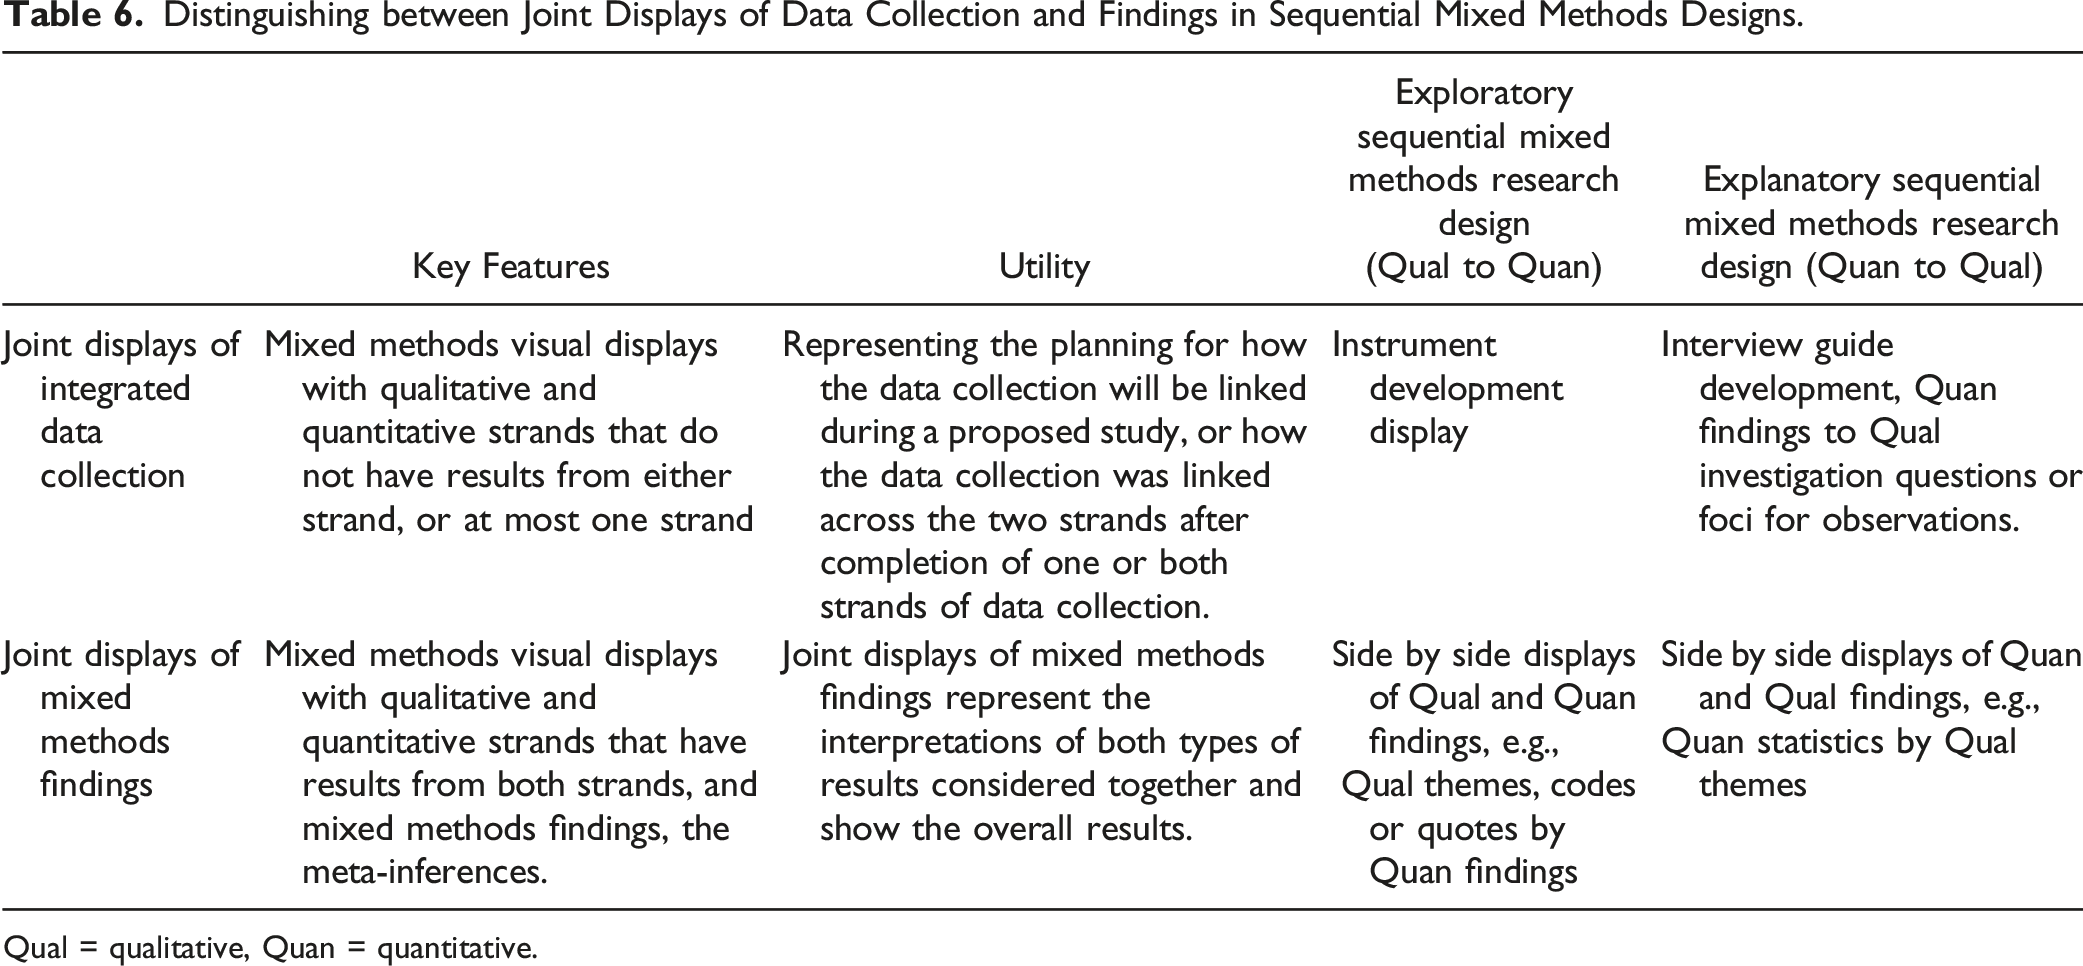
Qual = qualitative, Quan = quantitative.
The joint display of integrated data collection provides a template for integration of mixed data for the analysis and for the presentation of findings. In addition to the three variations of joint displays of integrated MM data collection use, a joint display of integrated data collection further provides a template for joint display analysis and in turn, joint displays of MM findings. In our experience, the joint display of integrated MM data collection planning frequently morphs into multiple joint displays during the analysis phase and in preparation of the final joint display of integrated MM data findings. In the Moseholm et al. (2017) study, they published one joint display of integrated data collection but this led to three joint displays of findings. This is not surprising as during the planning phase of a MM study, researchers will often have “hunches” about what the findings will show. But the details of the actual findings typically exceed that which is foreseen. Consequently, there is often more data, and more MM findings than anticipated. By exceeding expectations, the need for multiple joint displays should come as no surprise at all. Having a template for the expected findings does render conducting the analysis and making the representation of the findings more facile than having no template.
MM researchers may need to consider how to include a joint display of integrated data collection, whether in a paper of findings or a paper more focused on methodology. As noted above, Moseholm et al. (2017) used both a joint display of integrated data collection as well as three examples of joint displays of integrated data collection findings relative to three study constructs. However, authors publishing their studies may not always be able to present both types of joint displays in a single article due to space limitations or table/figure count limitations. In content-focused journals focused on findings where MM is primarily a means for producing study outcomes there may be less interest. However, in methodological articles, there will likely be great interest in having joint displays of integrated data collection as featured in both McCrudden and McTigue (2019) and Howell Smith et al. (2020). Joint displays of integrated data collection can be particularly helpful in protocol papers as illustrated by the Wu et al. (2018) study. Publication of a joint display of integrated MM data collection can be possible also as an online supplement, also as exemplified by Wu et al. (2018).
A critique of a joint display of integrated MM data collection planning could be leveled that using such a tool adds to much structure to a MM project. Arguably, the qualitative component frequently is used explicitly to elucidate that which is not known at the start of the study. In response, we would argue that using a joint display of integrated data collection during the planning phase should not be used to limit scope by researchers. Rather, during this stage, it provides a guide, and a means to systematically consider what data are to be collected, and further, will the data from both studies be linkable. Creating a joint display of integrated data collection can serve as a check on the mixed data collection and used to identify a gap in planning relative to the items in both data collection procedures. MM researchers should not be compelled to create parallel data collection items if not necessary. One could make the argument for a “division of duty” where the qualitative data address one phenomenon, and the quantitative data another. While certainly possible, such an approach begs the question as to why a researcher has chosen to conduct the project as a MM project rather than two monomethod projects. In short, we advocate for use of joint displays to guide but not limit the scope integrated MM data collection planning.
Other than terminology recently proposed by Fetters (2020), the name of “joint displays of integrated MM data collection” is an emerging methodological concept without naming conventions that can be readily identified in a literature search. Hence, our approach followed a “proof of concept” strategy since the purpose was not to systematically evaluate the prevalence of variations. Rather, our intent was to illustrate the potential for using joint displays of integrated data collection planning with empirical MM research examples and how these vary according to the three core designs as described by Creswell and Plano Clark (2018).
A potential limitation of this treatise has been our comparison only of differences in joint displays of integrated data collection according to three core designs even though there are many MM research designs. That said, core designs can be used together, with philosophical frameworks, or with other methodologies. Creswell and Plano Clark (2018) refer to these as complex designs. Others prefer being more specific where stringing two or more core designs together can be referred to as multistage MM designs (Fetters et al., 2013).
To the core designs, MM researchers may also scaffold (Fetters, 2020) or intersect (Plano Clark & Ivankova, 2016) with the core design a philosophical agenda as occurs in a transformative MM research study (Mertens et al., 2010). MM researchers may also scaffold or intersect the core designs with other methodologies, e.g., case study (Guetterman & Fetters, 2018), grounded theory (Howell Smith et al., 2020), narrative inquiry (Waller et al., 2021), or with experimental or quasi-experimental designs (O’Cathain et al., 2013; Creamer et al., 2021). A recent special issue in the American Behavioral Scientist identified six innovative designs. As the lead co-editors of the special issue, Creamer and Schoonenboom (2018) refer to this process as “inter-method mixing”. A full review of the steps for mixing (Schoonenboom, 2018) and possible combinations of known strategies is well beyond the scope of this paper. Suffice it to say that the three core designs serve as building blocks for virtually all MM designs, and provide a familiar and useful framework for considering three iterations of joint displays of integrated data collection.
Conclusion
We encourage researchers to use joint displays of integrated MM data collection to plan for fully linkable qualitative and quantitative findings, to guide the implementation of their studies, and to represent to others how integration has been achieved across key study constructs of qualitative and quantitative data. Given the complexity of MM studies, the joint display of integrated MM findings can contribute a valuable visual that may enhance review and publication of study findings. Onwuegbuzie and Hwang (2020) from the editors’ perspectives reviewed manuscripts submitted for consideration of publication. They examined the outcomes of manuscripts with and without visual displays, such as tables and figures. They found that more visuals were included in quantitative and MM manuscripts compared to qualitative study manuscripts. Further, manuscripts with more visual displays were statistically more likely to get accepted or have an initial decision of revise-and re-submit decision than manuscripts that were rejected.
We recommend MM researchers should make much greater use of joint displays for integrated MM data collection in their studies. Both highly effective but underutilized, MM researchers can use such structuring for organizing, planning, and representing integrated data collection in their MM projects. In doing so, MM researchers do need to be cognizant about how these joint displays vary according to the MM design as illustrated here. In organizing MM studies, authors can achieve the integration goal of matching of constructs across both types of data. A fully developed joint display of integrated MM data collection planning provides the benefit of serving as a template for the MM joint display analysis and joint display of integrated MM findings for dissemination.
Footnotes
Acknowledgments
The authors acknowledge Rania Ajilat for providing administrative support in preparing this manuscript for submission.
Declaration of conflicting interests
The author(s) declared no potential conflicts of interest with respect to the research, authorship, and/or publication of this article.
Funding
The author(s) disclosed receipt of the following financial support for the research, authorship, and/or publication of this article: This study was supported by Dr. Fetters’ participation was made possible through funding of the University of Michigan Mixed Methods Program. Dr. Tajima’s participation was made possible through funding support from the Long Term Foreign Residency Research Fund from Gakushuin Women’s College.