
Abstract
While the use of visual methods in qualitative research is gaining recognition, there has been less attention to timelines. This paper addresses this gap and contributes to the overall literature on qualitative research design and analysis. In a randomized trial of extended release naltrexone for youth with opioid use disorder timelines were used as a part of the semi-structured interview process. Timelines were constructed in a participatory manner in which both youth and their caregivers were separately asked to recount significant events related to substance use, treatment, and criminal justice involvement that took place between interview time points. This paper suggests that using timelines in qualitative, substance use research offers two main advantages: 1) improving the data collection process, and 2) advancing understandings of temporally contextualized narratives through a visual format. Here, timelines were an integral tool for summarizing and illustrating the complexity of youths’ experiences following residential drug treatment.
Introduction
Qualitative research has long been characterized as privileging language and the interview over other modes of data collection (Bagnoli, 2009). In recent years, however, there has been a shift toward the inclusion of a wider array of methods to elicit participant reflections that might otherwise be omitted (Wheeldon & Faubert, 2009). Among these, visual and participatory methods have emerged as particularly promising (Bagnoli, 2009; Bravington & King, 2018; Mannay, 2016; Mignone et al., 2019; Umoquit et al., 2011).
Visual data has long been a part of qualitative research, and have primarily consisted of photographs, personal objects, films, and drawings (Prosser, 2005). In early sociology and anthropology, photography and film were used to capture images of the subject/other being studied (Asch et al., 1973; Bateson & Mead, 1942). These images became the data from which other cultures and societies were portrayed to Western audiences, with the expectation that they had fixed meanings and were directly knowable. Over time, however, the images of the field were no longer considered self-evident, as the notion of the objective researcher and the unmediated photograph fell by the wayside (Barthes, 1981; Collier & Collier, 1986). These shifts coalesced and led to visual data being understood to require analysis in order for patterns and meanings to emerge (Collier & Collier, 1986; Johnson & Reavey, 2017; Wagner, 1979). This propulsion away from images conferring unmediated meaning had rippling effects across visual methods research, which expanded its borders to include a spectrum of approaches from the creative to structured charting.
Arts-based methods across the research process (i.e. data collection, analysis, dissemination; Given, 2008) gained traction in the 1980s and increased in use during the 2000s (Eisner, 1981; Fraser & Sayah, 2011; Heras & Tábara, 2014; Liamputtong & Rumbold, 2008). This incorporation of the arts can take a wide range of forms (e.g. dancing, drawing, music, painting, sculpting), but shares the characteristic of accessing the social through representations and meaning-making devices (Barone and Eisner, 2012; Foster, 2016). One limitation of arts-based methods is the potential for participant resistance if they are not confident in their ability to create the artistic form (e.g., drawing, photography) as requested (Scherer, 2016). Arts-based research is emblematic of the participatory methods that marked another shift in qualitative visual research. Arts-based research rose alongside the acceptance of art therapies, however; they remain a small subset of visual methods used in the social sciences (Banks, 2001; McNiff, 2008).
When graphs and charts started to be used, they were largely relegated to the analysis phase of research. The routine use of charts and graphs as a part of data collection is far more recent. Some examples of this include Klingemann and Klingemann’s (2016) free-life course drawings, Hanks and Carr’s (2007) lifeline drawings, Linder et al.’s (2018) draw-and-tell interviews, and Umoquit et al.’s (2008) participatory diagramming and graphic elicitation. These publications point to a fraction of the participatory visual methodologies that have begun to be used in qualitative data collection.
Diagrams differ from other visual methods in a number of ways. First, they are comparatively structured, thereby eliciting particular types of data and contextual features. Diagrams, as a subtype of visual methods, operate from structuring heuristics that have both concrete and abstract associations (Nickerson et al., 2013). These associations allow for an ordering of experiences and ideas that are made spatial so they can be communicated and iteratively adjusted. As Nickerson et al. (2013) note, diagrams make it possible to represent abstract or experiential information in a way that opens them to spatial reasoning. This makes meaning through the proximities and trajectories of concepts represented as well as their location on the page. For instance, on timelines, the left side indicates earlier events while those on the right are more recent (Boroditsky, 2000). This is not to suggest that they are without ambiguities and/ or overlaps, but rather that the general spatial relationship is widely understood, which makes them approachable, and therefore participatory (Blackbeard & Lindegger, 2015; Jackson, 2012; Martsin, 2017; Patterson et al., 2012).
As diagrams serve as both thinking and organizing tools, this study used timelines during both data collection and analysis. In accordance with grounded theory, this was not a predetermined data collection tool, but rather a pragmatic solution in order to draw out and structure youth responses. While this was an element of pragmatic qualitative research, the overarching paradigm used was grounded theory as it sought to answer broader clinical questions. In using the familiar visual form of the timeline, researchers in this study were able to give instructions that participants easily understood (Bagnoli, 2009; Sheridan et al., 2011). While time is experienced diversely, even within the same individual, the timeline served as an important communication device in this study to better inform qualitative researchers through the self-reported experience of substance use and treatment events for youth participants. Further, by including descriptive details for timeline entries, this study was able to circumnavigate the limitations previously described in the literature. It is also important to acknowledge the unidirectional temporal linearity that structures biomedical time, making this data meaningful to those completing the quantitative analysis of this study.
Additionally, the openness of this form is critical for maintaining fidelity to grounded theory, which seeks to avoid predetermined categories (Belgrave & Seide, 2019). The intention of using the timeline was not to triangulate information and dates for external validity, but rather to understand participant experiences. Aspects of the postpositivist and constructivist paradigms were brought to bear in this study as objectivist claims to a wholly external, unitary, and knowable truth were eschewed (Charmaz and Henwood, 2008). Instead, the researchers acknowledged their own positionalities and the impact of their training, societal understandings, and terminologies. While the postpositivist paradigm was primary, interpretive elements were included as it was acknowledged that the researchers are part of the evidence construction process, which gives rise to complex multiplicities (Bryant, 2017; Charmaz & Belgrave, 2012).
The Cartesian coordinate system, with its simple x- and y-axis, is a visual method central to quantitative research, facilitating the plotting of time periods, population information, and individual changes (Wainer & Velleman, 2000). It is the form that houses the bell curve, which lies at the core of Western knowledge production (Gould, 1981). Across time, the charts and graphs became a way for quantitative findings to be presented in concise snapshots well-suited to academic publications. This points to the expectation of just such an organizing mechanism in the context of health care and related fields. Continuing to use timelines in health research serves to advance this form in the epistemologies associated with substance use disorders, a fact that is worth ongoing consideration and weighing.
Timelines are linear representations of time that place events in chronological order. Because timelines place conditions and health behaviors in the context of a person’s life history, they are sometimes used in drug treatment programs and have been found to be therapeutic for patients and informative for health care professionals (Boyd et al., 1998; Bryant-Jeffries, 2001; Gramling & Carr, 2004; Woodhouse, 1992). The intention for using timelines in this study was not therapeutic, but rather to gather information that might guide future treatment approaches (Ancona et al., 2001; Hinterhuber, 2002). Given this objective of the study participants were not asked specifically to reflect upon the use of timelines themselves, but rather the researchers organically identified this format when checking for their own understanding and completeness of information.
The use of timelines in this study built on Berends’s (2011; Berends & Savic, 2017) incorporation of timelines in substance use and treatment research. Berends and colleagues found that while the timeline was a helpful qualitative research tool, it tended to flatten the data, thereby losing nuance, ambiguity, and detail. This project responded to that deficit by pairing the use of the timeline with an interview that allowed for descriptive details to be incorporated into each timeline entry.
Method
The parent study (Health Services Research: Extended Release Naltrexone for Opioid-Dependent Youth) sought to test the effectiveness of extended-release naltrexone (XR-NTX) against treatment-as-usual (TAU) for youth, aged 15 to 21 years, with opioid use disorder (OUD). This study recruited participants from a residential treatment setting and followed them into the community over 6 months. The qualitative component of this study was intended to solicit participant experiences regarding treatment, satisfaction with their OUD medication, dosing and other medical treatment, counseling, current drug use, issues related to treatment retention (i.e. housing, transportation, social support, family, legal problems), establishment of and advancement toward goals, and outlook for the future. The qualitative portion of this study was developed to better understand the factors, experiences, and contexts that contributed to treatment maintenance, treatment re-entry, and/or relapse for youth leaving an inpatient substance use treatment facility. Prior to data collection, institutional review board approval was received from the Friends Research Institute IRB, which also monitored the study. Particular attention was paid to ethical issues across this study due to the vulnerabilities of this young population experiencing substance use disorders, especially given that some also had other mental and physical health conditions.
The qualitative component of this study purposively selected 35 youth/caregiver dyads from the broader 288 study participants recruited from a residential substance use treatment program in Baltimore, Maryland. Approximately one-third of the participants received XR-NTX and the remainder received TAU (e.g., no medication or daily doses of Suboxone), at discharge. Youth, who had already been recruited into the parent study, were approached during their continued residential treatment episode and asked if they would be interested in participating in a qualitative interview. Interested participants were asked if they had a caregiver who could participate in three audio recorded qualitative interviews over the 6-month follow-up period. Minor youth (aged 15-17) were required to have a parent complete a consent form in order to be enrolled in the parent study. These youth were also asked to complete an assent form in order to independently agree to research participation. Youth participants were not asked to complete an additional consent form to participant in the qualitative portion of the study. However, parents were required to complete an additional consent form in order to participate in the qualitative interviews since the interviews would require their direct participation in research. Older youth (aged 18-21) were able to consent to participate in the research study on their own without parental consent. In order for the youth and caregiver to both be eligible for the qualitative portion of the study, the caregiver was asked to verbally agree to participate before the baseline interview with the youth could be completed. After the informed consent process was completed by phone, caregivers were asked to mail or email the signed consent forms to the researchers. Upon receiving the consent forms, the researchers were able to schedule baseline interviews with the caregivers.
Youth and their caregiver were interviewed at baseline, 3 and 6 months following the youth’s residential treatment discharge. Since the main study follow-up assessments were conducted during the same intervals, researchers largely completed the follow-up qualitative interviews during the same visit. Participants were interviewed in-person at their outpatient treatment programs, at the research center, over the phone, or at a jail facility. Similar interview guides were used for youth and caregivers with aspects tailored to best capture each group’s perspective. In true grounded theory fashion, interview guides evolved over the course of the interviews as new concepts and themes emerged. The in-depth, semi-structured interview guide used during each interview was honed to probe for participants’ recollection of events and details related to treatment, recovery, and drug use.
Results
Of the 35 participant dyads, 30 qualitative interviews were completed by both youth and their caregivers at baseline, 3-month follow-up, and 6-month follow-up. Three of the youth participants identified as African American, one identified as Mixed race, and thirty-one identified as Non-Hispanic White. Of these youth, thirteen identified as male and twenty-two identified as female. Twenty-nine of the caregivers identified as female and three as male. Further, three of the caregivers identified as African American and one identified as Native American, with the remaining twenty-seven identifying as Non-Hispanic White.
Incorporating timelines as a data collection tool was not part of the pre-established study design, but rather arose organically from the youth interview process. Timelines arose as a way to organize post-treatment events and decision points to ensure that the interview had covered what they considered to be most salient. For instance, during the first interview, it became clear that post-inpatient OUD treatment was a time of great transition that was not recalled in a linear manner. This made the incorporation of timelines during follow-up interviews vital to eliciting sensitive information (Marshall, 2019). At each 3- and 6-month interview, youth and caregivers collaborated with the interviewers to create a timeline of key treatment, social, and familial events that occurred since the previous interview. Types of key events included changes in treatment, medication adherence, relapse, overdose, family changes, social events, substance use behaviors, and criminal justice involvement. A researcher-led diagrammatic elicitation approach was used as timelines were drawn by the researcher using pen and paper during the youth in-person qualitative interviews, which allowed them to review the sequence of dates and events (Umoquit et al., 2013). Timeline items were strictly from participants’ self-reports.
The interviews were conducted by two experienced qualitative researchers. The role of the interviewer is not an invisible one without implications, however. In this study, the two interviewers prompted participants and guided the completion of the timeline. Acknowledging their role in the process is intended to increase transparency and practical understanding of the participatory nature of timeline development. The researchers engaged in practices of reflexivity during this study, in which they acknowledge their own roles in the generation of data and the power and social dynamics woven into the research process itself (Nicholls, 2009). In this way, the researchers did not attempt to hide their positionalities, but rather to draw them out and understand the ways they influenced data collection and analysis. For instance, one researcher found that the age difference between herself and the youth served as a barrier to developing trust. In response, the younger researcher conducted all remaining youth interviews in an effort to strengthen rapport.
This approach facilitated participant-centered data collection and informed interpretations. Timelines not only made data visible in a new way to both researchers and participants, but also shaped the iterative research process. The following exchange between a qualitative researcher and a 20 year old female participant during the creation of the timeline highlight the reflective nature, and collaborative approach underlying the timeline methodology.
Do you remember what your dose was by any chance? It was a while ago.
I was on eight milligrams for the first 2 months and then at that 2-month mark I started weaning myself off very slowly and then I weaned all the way down to nothing in that 90 days. I guess it was a little bit short of 90 days and then got out of the program and was clean for another week and then relapsed though.
Okay so you got out of the program in October, and then in a week you relapsed?
Yeah and then I relapsed and was using for about a month. And then in the middle of October I started a new Suboxone program.
Got it, okay, perfect. I just wanted to anchor the beginning of that timeline. I had everything written down but I wasn’t sure how much time had passed between each event.
In this excerpt, the participant is narrating the events of her life during the previous months, while the qualitative researcher is listening and recording these self-reported events related to substance use, treatment, medication dosing, and periods of sobriety. Although the qualitative researcher probes with questions to clarify timing to ensure the timeline accurately reflects the lived experience described by the participant, there is no effort to challenge the participant with an external validation of the accuracy or precision of events. A similar exchange is also presented below between the interviewer and a 19 year old female participant:
Okay, complicated, alright. So I’m putting that just for my general timeline here, right around the time you started relapsing?
Mm-Mm (negative).
What happened first?
I went back to my mother’s.
Back to mom, okay. And then how long after…like the hour you moved into your mom’s house did you relapse, was it like a day or two later or was it?
Yeah a day or two later.
This grounded approach meant that the timelines facilitated an ongoing reflection and fine tuning. For instance, the first ten timelines completed by youth informed key changes in the interview guides that were edited accordingly. Grounded theory (Charmaz & Henwood, 2008) helped to develop deeper and more nuanced understandings (Bryant & Charmaz, 2019). Engaging in continual analysis ensured that participants had a voice in how the data and analysis were conducted.
Given that the researchers met the youth in the residential treatment facility, they had to clearly and repeatedly identify themselves as being separate from the treatment center and assure youth that the information they shared would not be made available to courts, caregivers, probation officers, or schools. This was essential to ensuring that youth felt comfortable to honestly sharing personal and sensitive information with qualitative researchers. Frequent reminders of these distinctions may be particularly important when researching criminalized behaviors in confined settings.
Caregivers were interviewed separately, but were completed as close to the time of the youth’s interview as possible. Since many caregivers did not live within the city of Baltimore, most were interviewed over the phone for their convenience, as well as to ensure compliance to the follow-up schedule. This resulted in nearly all caregivers being told about the timeline, but unable to see it as it was being fleshed out. In order to parallel the youth, caregiver timelines addressed events in the youth’s life during the previous 3 months from their perspectives. The youth and caregiver timelines were compared, which revealed consistencies and inconsistencies.
The date of the baseline interview was used as the timeline start date and the follow-up interview date (3-month follow-up date at Month 3, and the 6-month follow-up date at Month 6) was used as the end date. New events were added to the timelines across the interview. The goal was to generate a snapshot of the youth’s life from the time of discharge from the residential treatment program, with the 3-month and 6-month interview dates serving as anchors.
The qualitative researchers took additional notes during the interview that offered explanations of and details surrounding key events. For instance, each dose of Vivitrol was marked on the timeline. This single point was fleshed out with youth responses to questions about their treatment expectations, experiences and satisfaction with the medication (including social stigma and any side-effects experienced), views concerning dosing and other aspects of medical treatment, other support services they were using at the time, and any issues related to treatment retention. This made it possible to contextualize the treatment, while incorporating experiential detail.
When participants spoke about periods of time, as opposed to specific incidents, this was demarcated on the timeline using brackets. For example, when participants described “habits” (e.g., daily use of particular drugs, periods of abstinence), brackets were used to indicate the period of time across which this occurred (See Figure 1). The bracketing of periodicities allowed for a visual representation of youth’s routines. Further, while reflections on the past were limited to 3-month intervals, participants were able to couch these events in terms of the broader struggles they faced that, when appropriate, were demarcated using the bracketing technique (See Figure 1).

Full electronic timeline including time brackets and youth and parent narrative.
Additionally, participants were asked about their future plans and goals. The plans and goals reported at the 3-month follow-up were revisited with youth at the 6-month follow-up. The identification and statement of goals provided insight into the motivations of participants and marked a way for them to gauge their progress. Given that both caregivers and youth were asked about goals, this served as a way to compare expectations, hopes, and motivations.
Incorporating timelines as part of qualitative data collection, participants were asked to reflect upon the past, present, and future. After each interview, researchers used Microsoft Excel to create electronic versions the timeline for each youth/caregiver dyad (See Figure 1). The electronic timelines included the youth’s age, treatment group (Vivitrol or TAU), milestones (indicated on the timeline as milestone and position), goals solicited at the 3-month follow-up to be completed by the 6-month follow-up, and contextualizing interview notes from the three- and 6-month follow-ups located beneath the timeline. This digital timeline served as a way to easily compare youth and parent accounts and visualize trajectories. This can be seen across Figures 2 and 3.
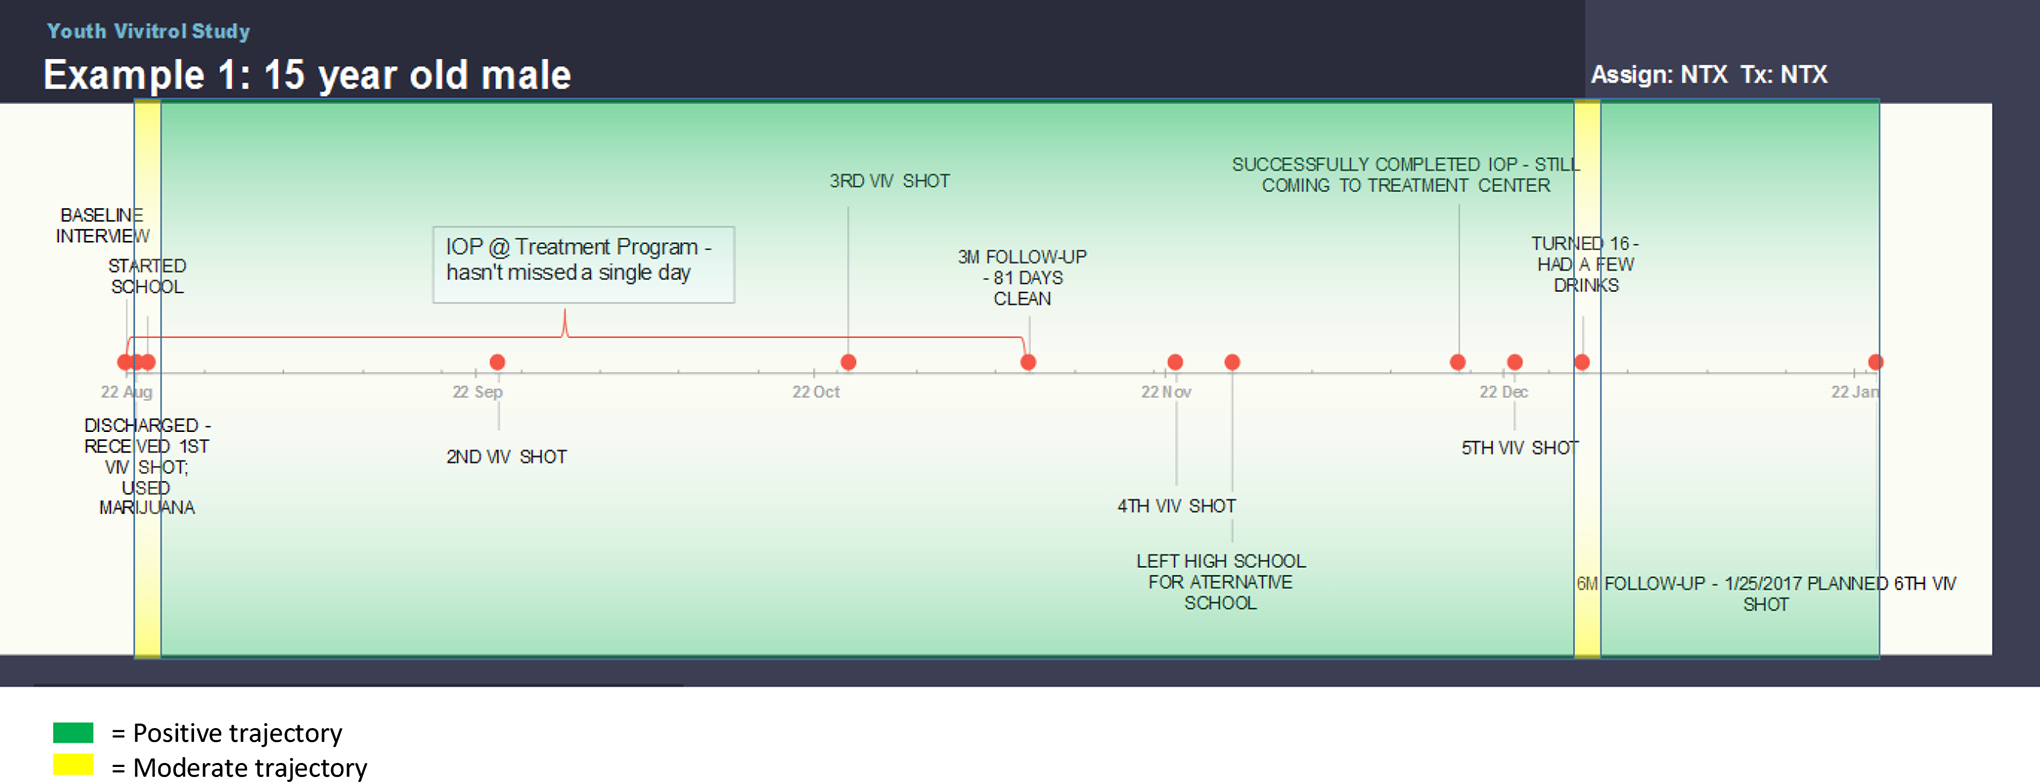
Electronic timeline example for a 15-year-old male.

Electronic timeline example for a 16-year-old female.
Discussion
This paper suggests that using timelines as a component of qualitative substance use research offers two main advantages: 1) improving the data collection process and 2) advancing understandings of temporally contextualized narratives through a single-page, visual format. While it might be expected that this highly structured format might flatten the information and make responses terser, the opposite was found here. This study identified that the use of timelines had a number of surprising implications. First, youth responded well to the visual element of the timeline and the participatory nature of its completion, which increased the validity and reliability of the information shared (Maxwell, 1992). Second, one of the most unanticipated elements was the timeline’s ability to illustrate the density of events that occurred when youth were experiencing relapses, versus the comparative sparsity of events on the timeline when compliant with treatment. In this way, the format of the timeline provided a way for youth to visualize their substance use and its real-world implications.
The first benefit of the timeline was its improvement of the data collection process. To begin, the timelines served to increase dialogue and responsiveness. For instance, youth responses increased in volume and specificity as they worked to make the timeline as complete as possible. The result of this was the uncovering of details and information that otherwise may have remained unstated and therefore inaccessible to researchers (Martsin, 2017). For example, it was common during interviews with the youth for the participant to confidently state a date or relative order of events, only to revise these details once they were placed in chronological order on the timeline. Additionally, placing these events into the timeline also elucidated additional details that the participant was able to recall once they were able to see the events of the previous 3 months on paper in front of them. This may have been due to the specific ways the timeline fostered the development of a collaborative rapport in which the researcher and youth worked together iteratively to make the timeline accurately reflect their experience (Chen, 2018; Crilly et al., 2006; Kolar et al., 2015). It is worth noting that general rapport had already been developed as the researchers previously conducted a baseline interview with youth. Youth also met with other study staff on a monthly basis. Thus, the introduction of the timeline served, in part, as a helpful “warm-up” to the remainder of the follow-up interview. For instance, the researchers might open by saying “Wow, I can’t believe it has been 3 months already! What’s been going on for you since the last time we spoke?” This often elicited accounts of the events participants considered most important, which were placed on the timeline first.
Further, the visual display of information increased accessibility to the data in real-time as youth could see time points and details. Through this visual tool, youth engaged in a process in which temporal inconsistencies were drawn out and resolved. This meant that the timeline and the ordering of events often changed across the interview with the researcher and youth working jointly to resolve discrepancies. This type of interaction marks a shift in the agency of participants and resulted in greater insight into participants’ meaning making (Martsin, 2017).
The timeline also served as a memory aid as events initially missed were recalled and added (Kolar et al., 2015). Further, the timeline facilitated youth reflections on their priorities and demonstrated the conflicted and complex nature of substance use disorders. It has also been suggested that using visual data collection methods assists in the conveyance of abstract ideas and feelings (Copeland & Agosto, 2012). This potential for communicating the abstract suggests that it was not just the volume of data that increased, but also the scope. Timelines were also found to be an efficient way to document and visualize a relatively large amount of data, particularly when compared to other visual methods (Becker, 2007; Berends, 2011; Denzin & Lincoln, 2003).
Additionally, timelines were particularly useful in clarifying the role that certain challenges and limitations played in the experience of youth after their release from a residential treatment setting. Some of the common barriers included: lack of transportation, inadequate health insurance coverage, comorbid health conditions, criminal justice system involvement, unemployment or underemployment, poverty, physical/ psychological substance dependence, occupational history of selling drugs, educational attainment, poor perceptions of maintenance medication(s), medication side effects, lack of providers in close proximity, boredom, a history of trauma, inadequate quality of treatment options, and child care concerns. While such barriers have been identified in a number of other studies, the relationship between these barriers and relapse are made direct and explicit in the visual format of the timeline (Ezzy, 2002).
Timelines, unlike other visual frameworks like matrices (Averill, 2002), do not require information to be shunted into separate domains, thereby allowing connections between and across events. This is useful as it allows both participants and researchers to see the complex relationalities that influence substance use and treatment engagement. These connections are made apparent even when the exact dates were not available, as it was still possible to construct a chronological sequence of events. One example of these connections developed from several participants who reported incidents of criminal justice involvement and spoke about arrests as deterrents to relapse. This, however, was often the opposite of what was reflected in the timelines. Such expectancy violations can be particularly useful for both researchers and participants. Another example arose from the use of timelines in the context of medication trials, which allowed accounts of negative side effects and/or symptoms of withdrawal to be delineated and placed in the broader context of the participant’s life. This can facilitate better understanding of the effects of the medication not just in terms of the sensations experienced, but how these sensations related to actions and events. In both of these instances, the sequencing of events allows for relationships and associative influences to be made explicit. Finally, the use of timelines also highlighted geographic and residential changes as participants moved between homes, treatment programs, recovery houses, shelters, jails, etc. This allows for the relationships between time and space to be better understood. For instance, for participant 1043, going to a recovery house that did not allow him to continue taking his prescribed Suboxone preceded a period of relapse events and a large number of relapse-related events recorded on the timeline.
The spatialities revealed during the creation of the timeline also included interpersonal distances. For instance, caregivers revealed a sense of emotional and informational distance from their paired youth. This was a common theme that was echoed throughout the caregiver interviews as they voiced their uncertainty about sequences of events, which was particularly acute among those with children between the ages of eighteen to twenty-one. Although the interviews were the mechanism through which this interpersonal distance was revealed, the timelines were an illustrative tool that made clear the discordance between youth and caregiver accounts of the previous 3 months. This feeling of alienation and mistrust may serve as a prime site for future research, in the field of substance use and medication assisted treatment.
One of the major critiques of timelines is the way in which they often restrict accounts to simple time linearity and sequences of events. In this study, however, the timelines seemed to draw out other ways that time was experienced by the participants. For instance, the interviews demonstrated that time takes on a central role in opioid use as the threat of recurrent withdrawal symptoms impacts youth decision-making. Additionally, recovery-oriented treatment and support groups often focus on the amount of time that an individual has remained “clean,” and signifies these achievements through medallions representing periods of sobriety (Alcoholics Anonymous, 2019). Youth in this study reported being influenced by this recovery concept of time by wanting to avoid resetting this “recovery clock,” which they could see being illustrated on the timeline during the interview. Timelines offered an alternative way for participants to understand this trajectory as the accumulation of experiences and adversities are made explicit. Future research might explore using timelines in substance use research to resist the tendency to see relapse as a complete loss.
Relatedly, while researchers did not specifically ask participants about their experiences using timelines in the context of this study, this is an important line of investigation for future research. Additionally, identifying mechanisms for participants to take an active role in designing and conducting substance use disorder medication trials is deserving of further examination. In light of the often marginal space allocated to qualitative research in medication studies, more participatory models may face considerable challenges in acceptance and implementation (Liamputtong, 2019).
It is also worth highlighting the potential for timelines to be used in the future as a medium that can integrate qualitative and quantitative data. Although this is a mixed-method study, the collection of quantitative and qualitative data remained largely siloed, consistent with many health services research protocols. However, the visual form of the timeline points to the promise of finding new and innovative ways to bring this data together for richer understandings of youth and caregiver experiences. One initial attempt at this was undertaken by shading the periods of abstinence, episodic drug use, and relapse so as to draw out substance use within specific periodicities (see Figures 2 and 3). This characterization of the timeline data points to the ways in which this visual qualitative data can be interpreted and integrated with the quantitative findings tracking substance use over the course of the study. However, while the quantitative analysis focused narrowly on the relationship between particular treatments and substance use, the timelines contain additional variables that participants deemed important. Looking forward, researchers plan to use timelines in ways that allow for the quantitative and qualitative data to be overlaid for a more nuanced and comprehensive understanding of treatment and relapse trajectories. This would not only offer an innovative way to answer research questions, but also would generate new questions to be explored in future research studies.
In sum, the first benefit of incorporating timelines in this study was the increased reliability and validity of the data. These results support Jackson’s (2012) findings that timelines “help clients reconstruct their past and reorganize their perceptions of self within the context of their environments.” Participatory diagramming allowed for events to be placed on the timeline and thus in relation to other major benchmarks. It was found that when events were placed on the timeline youth were better able to identify important dates. The increased accuracy of the timeline was likely due to the iterative process across which adjustments could be made (Brown et al., 2008). Copeland and Agosto (2012) refer to this as “triangulation” through which data collection approaches improve accuracy.
Despite the aforementioned benefits associated with the use of timelines, there are also a number of potential limitations. One of the previously identified limitations included the challenges faced by participants who do not view their experiences in a linear temporal fashion (Bagnoli, 2009; Jackson, 2012). It has also been suggested that if timelines alone are used without a way to document greater detail, the richness of data may be lost or undervalued. For example, a detailed description of the sensations of withdrawal may be challenging to convey on a timeline. It is for this reason that this study used timelines in conjunction with in-depth interviews.
Additionally, timelines may not draw out conditions and life contexts that remain stable across time. For instance, if a participant has always lived in a rural area with limited access to public or private transportation, this may not be placed on the timeline. Another facet of this is the role of personal characteristics (e.g., race, ethnicity, gender, sexuality) that are not made evident when they are stable, despite the well-documented influences of social structures and their differential violences (Yu et al., 2018). Similarly, timelines may not show the gravity or long-term effects of some life events (e.g., death of a friend or loved one) that linger or periodically reemerge.
There are also some limitations specific to this study. To begin, the timelines included here covered the 6 months after youth left the residential treatment facility, which could make it difficult to capture broader trends and trajectories. Additionally, most caregiver interviews were completed via phone so they were unable to see the timeline as the interviewer created it. Lastly, the future was only asked about in terms of goals, which does not reflect the challenges/barriers youth or caregivers anticipated.
Given the relatively sparse literature on the use of timelines and other visual methodologies, there is a great deal of further research needed in order to guide analysis and interpretation. Further investigation may be required to understand the way that timelines are suited to experiences of trauma or hardship. A number of the timelines included events that the youth found particularly challenging and even dangerous or harmful. For these reasons, qualitative research using pluralistic methods, like this study, can be particularly beneficial (Frost et al., 2010).
Conclusion
It has been noted that there is a dearth of detailed qualitative research design and methods literature, when compared to quantitative methods (Devers & Frankel, 2000). This article is intended to contribute to this growing body of literature. While acknowledging the preference for quantitative studies and increasingly complex statistical analyses in clinical trials, this study suggests that there is immense potential for qualitative and visual methods, such as the timeline, in the production of knowledge about substance use disorders and treatment (Finlay & Ballinger, 2006). Future research should also include probing questions during qualitative interviews to elucidate the attitudes and opinions of research participants toward participating in the development of these visual methodologies. The use of timelines as components of qualitative research offers a way to “engage with issues of power relations, representation, and meaning” (Kolar et al., 2015) in a participatory manor, while also serving as useful format for both data elicitation and summarization.
The ordering of events on the timeline served as a visual mechanism for youth to identify past decision points in the context of their goals and objectives. Given that such visual techniques have primarily been used during the data analysis process (Copeland & Agosto, 2012; Draucker & Martsolf, 2008; Eriksson et al., 2008), the question arises as to whether their use in data collection allows for participants to engage in analytic processes that can enrich understanding for both researchers and participants. In this study, having the timeline represented on paper may have allowed the youth to better visualize their journey since discharge from the residential drug treatment program (Chen, 2018).
Another question that arose during this study surrounded the influence of qualitative software’s visual data analysis capabilities. Over the years, qualitative software (e.g., Atlas.ti, NVivo) has gained the capacity to manage and integrate ever more complex visual and mixed media. There is further exploration needed to better understand the ways in which analytical software, research methodologies, and outcomes may be coproduced.
Similarly, the rise of digital social media has ushered in a renewed use of timelines. For instance, Facebook Timelines creates a format for users to tell particular, temporally situated stories of their lives (Robards & Lincoln, 2017). Increased familiarity with the specific designs of Facebook’s digital timeline may change the way participants engage in the process of generating a timeline during the qualitative interview. Given that Facebook and other social media technologies are forums for digital performances of the self, this may serve as an additional influence, even if not consciously. This points to another site ripe for future study.
This paper has demonstrated the analytic potential of incorporating timelines in the qualitative research methods toolbox. At first, the use of timelines was intended to assist the interviewers in organizing and verifying information during the interviews. However, the use of the timeline as a thinking tool that facilitated iterativity immediately became apparent as participants were eager to engage with it. Further qualitative research might benefit from implementing and evaluating other visual and artistic modes of data collection. Given the sensitivity of substance use research, particularly among youth, such methods might be particularly important in drawing out detailed accounts. Additional research is also needed to explore the use of timelines that cover longer periods (both past and future) as well as those that explore the absences or details unaddressed on timelines.
Further work is also needed in the development of protocols for visual research methods (Crilly et al., 2006; Umoquit et al., 2011; Varga-Atkins & O’Brien, 2009; Wheeldon, 2010) more broadly, and timelines in particular (Bravington & King, 2018). It is also worth exploring how the act of creating a timeline might change participant narratives (Draucker & Martsolf, 2008; Lee et al., 2012; Nickerson et al., 2013). However, it should not be assumed that timelines will be engaged with in the same way across or within groups of people (Kolar et al., 2015). There may be additional benefits to studying how timelines are used and interpreted between different racial, ethnic, gender, or age groups.
Ultimately, using timelines in qualitative data collection is particularly promising as it draws out personal, family, and social experiences. While there has been some concern that timelines might truncate participant responses, this project used them in conjunction with interviews that allowed for a richer and more nuanced understanding of participants’ experiences. These findings add to the literature supporting the utility of combining qualitative modalities to increase data validity and reliability (Frost et al., 2010). Overall, this study has demonstrated the utility of representational forms far beyond the charts and graphs that have been typically used to present data to journal readers (Eisner, 1997).
Footnotes
Declaration of Conflicting Interests
The author(s) declared no potential conflicts of interest with respect to the research, authorship, and/or publication of this article.
Funding
The author(s) disclosed receipt of the following financial support for the research, authorship, and/or publication of this article: The National Institute on Drug Abuse (NIDA) provided support for this manuscript and analysis through grant # R01DA033391.