
Abstract
Narrative interviews are the methodological gold standard for biographical research. To facilitate memory work in interviewees, qualitative researchers increasingly fuse interviewing with visual elicitation strategies. In this article, we advance the integration of methods by introducing a graphic elicitation strategy that allows interviewees to map biographical developments and critical health experiences, in addition to verbalizing them. The biographical mapping approach was originally developed for a research project on adolescents’ health and illness experiences in elite sport but lends itself to qualitative biographical research in general. Using case material, we first demonstrate how the mapping process helps interviewees to recall past episodes and to produce more detailed biographical data. Second, we describe how the depth of focus in the biographical drawing and interview data allows researchers to identify biographical turning points and to analyze interactions between context, life events, and health in a unique way. By visualizing different strands of development, the elicited drawings also hold heuristic value, as they show the nonlinearity and multidimensionality of biographical developments.
Keywords
Introduction
Narrative interviews are the methodological gold standard for biographical research because they allow detailed insight into subjective experiences of critical life events and strands of development (Denzin, 1989; Denzin & Lincoln, 2005; Polkinghorne, 1988; Schütze, 1983). Due to this methodological strength, narrative interviews have been widely used for researching health and illness experiences (Charmaz, 1991; Frank, 1995; Smith, 2013). This is also the case in sport sociology and the study of athlete health (Brock & Kleiber, 1994; McMahon, Penney, & Dinan-Thompson, 2011; Papathomas & Lavallee, 2006; Roderick, Waddington, & Parker, 2000; Smith & Sparkes, 2005, 2009). While the existing narrative research has led to a considerable gain in knowledge, the data collection method also involves challenges, for example, when used with young people and for accessing painful experiences in the course of a person’s life/career.
In this article, we set out by reviewing methodological strengths and challenges of narrative interviews before introducing a graphic elicitation tool, which we found useful to support biographical “memory work”. Integrated in a narrative interview, the tool allows interviewees to narrate and “map” strands of development within their life courses and to express gradual differences in subjective experience. The thereby elicited drawings enable researchers to locate critical life experiences on a timeline and to retrace health trajectories, biographical turning points, and intersections of development strands.
In what follows, we first briefly review the development of the data collection strategy and situate it within the field of participatory visual research. Second, we describe the procedure and the material support (the mapping grid) used for drawing. Third, we show the potential of the method by analyzing exemplary “biographical maps” (Thiel et al., 2011) created by the adolescent athletes in our study. Finally, this leads us to the discussion of methodological strengths and limitations.
Development of the Method
The Research Context and Its Methodological Requirements
Children and adolescents who are socialized into elite sport find themselves in a challenging health situation. Numerous social science researchers have evidenced a deep-seated “culture of risk” (Nixon, 1992) in high performance sport, which encourages athletes to accept high health costs as an inevitable side effect of their profession (e.g., Berg, Migliaccio, & Anzini-Varesio, 2013; Roderick, 2006; Spencer, 2012). Furthermore, athletes have been found to learn risky behaviors, such as competing while injured, ignoring pain, or making weight within high performance sports (e.g., McMahon et al., 2011; Mayer & Thiel, 2011; Papathomas & Lavallee, 2006; Theberge, 2008). Adolescents who strive to become elite athletes are situated in this social context and need to negotiate career transitions and possible health issues within it (Barker-Ruchti & Schubring, 2016; Bruner, Munroe-Chandler, & Spink, 2008; Malcom, 2006; Schnell, Mayer, Diehl, Zipfel, & Thiel, 2014). Additionally, adolescents undergo major physical and psychosocial changes, which young athletes must adjust to and negotiate in the development of an athletic career (Schubring, 2014).
While existing research in the field of athlete health has significantly enhanced our awareness of the complex interdependencies between ill-health experiences, identity, embodiment, and social context, it has mainly drawn on adult or former athletes’ narrations (Mayer, 2010; McMahon et al., 2011; Papathomas & Lavallee, 2006; Sparkes, 1999). In doing so, the critical health experiences of a growing number of youth in sport and physical activity were somewhat left out. Furthermore, the interrelations of a developing elite sport career and changes in athletes’ experiences of health and illness over time have rarely been explored, not least because of methodical difficulties.
The qualitative substudy of the German Young Olympic Athletes’ Lifestyle and Health Management Study project 1 addressed this research gap by investigating how adolescents’ biographies developed through socialization into elite sport. More specifically, our aim was to identify turning points in careers and to understand how health and career-development are intertwined. In order to research these topics, we needed a data collection method that captures career courses and critical health events over time but also facilitated for adolescents sharing sensitive issues, such as bodily changes or disruptive experiences. Based on these methodological requirements, we critically reflected on best use of narrative interviews for data collection.
As outlined earlier, narrative interviews combine several strengths: In contrast to more quantitative methods of investigation, they have proven to reveal “blind spots” and unorthodox stories instead of central tendencies (Josselson, 2007, p. 8). Furthermore, narrative interviews have been compared to “windows into peoples’ lives” (Denzin, 1989, p. 14) that give unique and deep insight into critical life events or “epiphanies” (Frank, 1995). As the act of narration requires experiences to be interpreted, shaped, and ordered, interviews also allow researchers to retrace processes of meaning-making (Chase, 2011; Polkinghorne, 1988; Schütze, 1983). Finally, narrations constitute social products, as narrators draw on socioculturally available knowledge, and ways of storytelling (Douglas & Carless, 2015; Frank, 1995; Sparkes, 1999). Therefore, narratives also give insight into the social, cultural, and historical shaping of biographies (Chase, 2011; Schütze, 1983; Smith & Sparkes, 2009).
While the strengths of narrative (biographical) interviews remain unquestioned, scholars have identified challenges, notably when interviewing children or adolescents (Bagnoli, 2009; Wilson, Cunningham-Burley, Bancroft, Backett-Milburn, & Masters, 2007). Besides other factors (e.g., competence of the researcher, impact of the research context), young people who are less versed in a language or considered “vulnerable” may find it challenging to recall and just orally reflect on their life history (Bagnoli, 2009; Driessnack, 2006; Harvey, Wilkinson, Pressé, Joober, & Grizenko, 2012). Additionally, research subjects of all ages may find it hard to verbalize sensitive topics, such as painful experiences and stigmatizing conditions (Guenette & Marshall, 2009; Prosser, 2011; Sheridan, Chamberlain, & Dupuis, 2011), or to find words for emotions and bodily sensations (Orr & Phoenix, 2015; Tarr & Thomas, 2011). Furthermore, narrations of crises may follow a “chaotic” structure (Frank, 1995), which makes it difficult for the interviewer to keep track of the chronological sequence and timing of critical events to which the narrator refers (Kolar, Ahmad, Chan, & Erickson, 2015).
To meet the outlined challenges and support the adolescents in our study in sharing their biographical history, we came up with the idea to combine biographical interviews with mapping strands of development and critical experiences in a two-dimensional grid and to refer to this integrated data collection strategy as the biographical mapping method.
Participatory Visual Research
Over the last two decades, participatory visual methods have gained increased popularity in qualitative research. Because of this “visual turn,” a variety of visual research strategies have been developed, ranging from photo-elicitation to drawings, videos, or arts-based inquiry (Prosser, 2011; Weber, 2008). To structure the diversified field, Prosser and Loxely (2008) distinguish between “researcher-created” and “respondent-generated” visual data collection methods. While researcher-created visual material subsumes imagery collected or newly created by the researcher, the latter encompasses visual material created or collected by the research subjects. Given the co-constructive nature of qualitative data production (Denzin & Lincoln, 2005), we understand this distinction not as mutually exclusive but as a continuum with two poles. The biographical mapping strategy comprises both dimensions, but the respondent-generated side of data production dominates. Akin to participatory drawing, it constitutes a nonmechanical 2 “visual elicitation method” (Prosser, 2011, p. 484), as the participants’ line drawings and annotations are used as reference points to stimulate responses in the research interview.
Supplementing interviews with task-based activities, such as drawings, has proven to be a promising data collection strategy in youth research (Bagnoli, 2009; Clark, 2011; Harvey et al., 2012; Weber, 2008; Wilson et al., 2007). For example, in a study on physical activity experiences of children with attention-deficit hyperactivity disorders, creating scrapbooks was used as a “memory trigger” to help the children recall rich experiences (Harvey et al., 2012, p. 74). In a study on youth, migration, and identity construction, Bagnoli (2009) argues that drawing a self-portrait, relational map, or timeline allows the young participants to articulate dimensions of their experience without relying on words alone. Wilson, Cunningham-Burley, Bancroft, Backett-Milburn, and Masters (2007), who employed an adapted version of Parry, Thomson, and Fowkes’s (1999) life grid in a study on young people’s experiences with parental substance abuse, underscore that completing the grid positively influenced the relationship between young participants and the researcher. Furthermore, using the life grid enhanced the participants’ control over the interview process.
Positive effects of visual elicitation tools have also been reported for the study of embodiment and (ill)-health experiences: Drawing on their longitudinal research on women’s experiences of fatness and weight loss, Sheridan, Chamberlain, and Dupuis (2011) conclude that creating multitextual timelines may “highlight turning points and epiphanies in people’s lives” (p. 565). Building on this insight (Chen, 2018) found that drawing timelines helped fibromyalgia patients to see the intricate connection between their illness and life events. Tarr and Thomas (2011) employed body mapping (mapping pain zones on three-dimensional body scans) to explore both pain and injury experiences in dancers. They discovered that the mapping process brought forgotten and suppressed pain memories to the foreground and enhanced the dancers’ self-reflexivity in the interviews (Tarr & Thomas, 2011, p. 153). In a similar way, Mayer (2010, p. 379) used “biographical system maps” (a combination of body maps, injury development curves, and mind maps), which allowed overlapping ill-health experiences in professional athletes and the particular role of coaches and doctors in the related decision-making processes to be identified. Studying experiences of embodiment and aging, Orr and Phoenix (2015, p. 470) found that photographs both incited narrations and helped the participants “to ‘grasp’ at their embodied and sensory experiences.”
Taken together, the existing research examples stress the use of ‘intermediary artefacts” (Prosser, 2011, p. 484), both in research with young people and when exploring sensitive issues of embodiment and (ill)-health: Because they do not speak directly about the topic on which they feel vulnerable, but work through a material go-between (e.g., a doll, toy, line drawings, mobile phone, or memorabilia), they are more able to express difficult memories and powerful emotions. (Prosser, 2011, p. 484)
Description and Implementation of the Method
The biographical mapping method can be briefly characterized as the combination of a semistructured drawing activity and a narrative interview. To guide the drawing and recall processes, the interviewee is asked to plot development lines (e.g., a career timeline; a health timeline) in a two-dimensional biographical mapping grid (see Figure 1) and to comment and explain the line drawings. The iterative combination of narrative interview questions with the drawing activities results in the generation of both rich interview data and a biographical map (see Figure 2).

Biographical mapping grid.

Timo’s completed biographical map (color legend: red = performance development; black = health development; green = relevance of health; blue = relevance of nutrition).
The Mapping Grid and the Interview Guide
The biographical mapping grid constitutes a key element in the graphic elicitation process. 3 It functions as a material support for the drawing process and, similar to Parry et al.’s (1999) “life grid,” prestructures the data collection through its layout and features. These features are the two rectangular axes of the grid and the drawing space they create (see Figure 1).
The horizontal line (x-axis) represents a chronological timeline. For easier orientation, we have prestructured the timeline into years by alternating nonshaded and shaded vertical columns. Furthermore, the quarters in each year are separated by horizontal lines. This quarterly segmentation was intended to help the adolescent athletes to identify sports seasons in a year and to locate the recalled events more precisely on the timeline. We expected sports seasons to be orientation points for recollection, given that seasons temporally structure training rhythms, competition schedules, and selection processes in elite sport. The vertical scale (y-axis) of the mapping grid allows participants to rate their subjectively remembered development and to indicate changes and biographical turning points in strands of development. Through the grading process, participants “translate” individual experiences of developmental ups and downs into gradually differentiable units of meaning and by connecting these reconstruct their development “curves” (e.g., the development curve regarding athletic performance or well-being). In order to facilitate rating, we designed the y-axis as a numeric rating scale ranging from 0 (as a perceived subjective minimum) to 10 (as a perceived subjective maximum). In choosing this scale, we drew on studies that found that 11-point numeric scales are not only easy to administrate but also provide reliable information on subjective ill-health experiences, such as pain (Hawker, Mian, Kendzerska, & French, 2011).
For our study with young athletes, we also developed a narrative interview guide that framed the data collection with the mapping grid. The interview guide consisted of five thematic sections: (a) personal background and career development, (b) health and illness experiences, (c) pain management and medication, (d) food management and nutrition experiences, and (e) health support structures. The interview guide also contained instructions for the drawing activities and explanations of the interview progression. In the following, we illustrate the application of the elicitation strategy through examples of adolescent athletes’ biographies. For contextualization, we first outline the sampling and recruitment of young athletes.
Recruiting Youth Athletes as Research Participants
To study health-related biographies in youth elite sport, we purposefully selected adolescent athletes from different Olympic sports (biathlon, handball, gymnastics, and wrestling) into a qualitative multiple case study. Upon informed consent from stakeholders in each sport, the first author contacted potential participants either via local training centers and coaches or personally during observations of training sessions. In keeping with the ethical procedures, 4 each athlete was informed about the aim of the study and that participation was entirely voluntary. The parents of the adolescents also obtained letters of information. For sampling reasons, participants per sport were limited to three girls and three boys, all aged between 14 and 18 years. All participating athletes were members of their sports’ national youth squad 5 (n = 24). Upon individual consent, the first author arranged a time and place that fit with the athletes’ rather tight time schedules. Most of the biographical mapping interviews were thus conducted at the athletes’ training centers, during training camps, or at their boarding schools. Interviews lasted from 50 to 250 min. They were audio recorded and transcribed verbatim.
Data Collection With the Biographical Mapping Method
To allow for youth athletes to establish their own frame of relevance, data elicitation was initiated with an interview sequence in the tradition of biographical narrative interviewing (Schütze, 1983). More specifically, the interviewer posed the following open-ended introductory question to elicit the youth athletes’ narrations: You have been active in [name of the sport discipline] for quite a while now. When you look back on your career so far, can you tell me when your involvement in competitive sport became more serious, and how it has developed since then? What happened then? Have there been other decisive moments? Have there been other changes for you? This map is going to be a sort of memory aid in the interview and I will ask you at different moments to write or draw into it. At the end of the interview, this will be somewhat like a “picture” of your career. Your entries do not have to be neat and will not be “assessed” for drawing skill or alike.
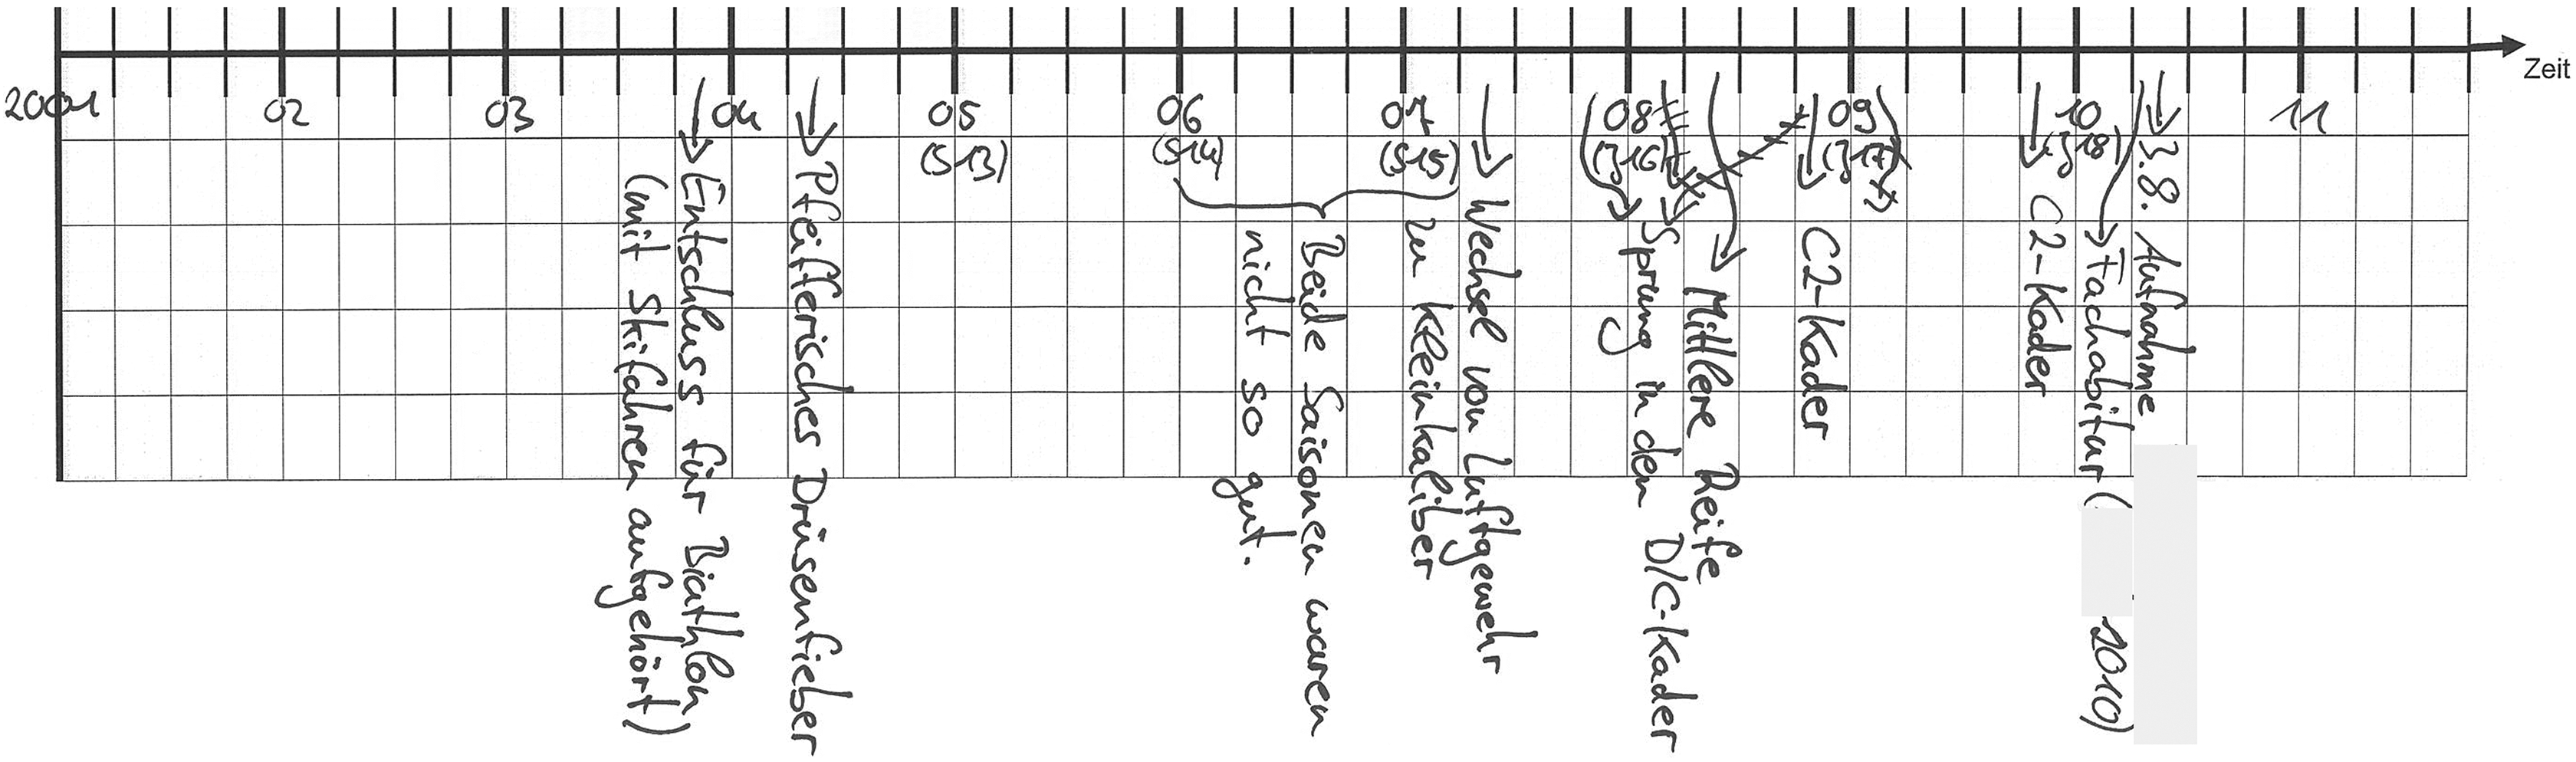
Timo’s timeline.

Mara’s timeline.

Sarah’s timeline.
Variations in timelines between individuals can be seen when comparing Figure 3 with the timelines created by the 16-year-old female handball player Mara (see Figure 4) and the 15-year-old gymnast Sarah (see Figure 5). Mara covered a period of 4 and ½ years in her timeline. The moments she has marked refer uniquely to her athletic career, including her position in the team as substitute (season 2006/2007) or regular player (season 2007/2008), her switching clubs (2008), her selection for the national youth squad (Deutsche Handballbund, DHB) at the age of 14, the move to a boarding school (Internat), and the increase in training intensity (2010).
In contrast to Mara’s relatively short career timeline, Sarah scaled her timeline for a much longer period (10 years). The key events Sarah entered in her timeline mainly refer to sporting success and rankings in national competitions (2006–2010). Sarah also included two non-athletic events, which affected her involvement in gymnastics, namely, moving countries with her family (2001) and her move to an elite sport school (2005). While Sarah acknowledged her difficulty remembering details before her selection into the national squad (Bundeskader) at the age of 10 (2005), Timo’s, Mara’s, and Sarah’s timing of career onset and selection in the national squad differed considerably. This gives a first indication of how age norms, career paths, and transitions vary between Olympic sports (Schubring & Thiel, 2014) and thus contextually shape biographies.
After the individual scaling of the timeline and the mapping of important events within the time span interviewees had selected, the interviewer alternated thematic sequences of open-ended questions and mapping activities. Within this process, four major themes were explored from a longitudinal perspective: (a) the athletes’ performance and athletic career development, (b) their feelings of well-being and their experiences of pain and ill-health, (c) their health behavior and changes in the subjective relevance of health, and (d) their eating behavior and changes in the subjective relevance of nutrition. 8
First, the youth athletes were invited to draw a performance career line that reflected their experienced performance development over time. In order to do so, they were asked to relate to the 11-item rating scale (y-axis). The drawing of their performance career functioned as a springboard for further open-ended questions about experiences of success and defeat and about future aspirations. Frequently, in their narrations about moments of failure or success, the youth athletes themselves brought experiences of ill-health to the foreground. This was used as an affordance by the interviewer to introduce the next drawing activity with the following question: If you think back on the beginning of your career up until today, how did you feel health-wise? Can you try to recall this as precisely as possible and indicate how your health has changed over time? You can move your entries further up or down depending on how well or bad you were feeling at different moments.
To distinguish the four career lines of (a) performance development, (b) health development, (c) relevance of health, and (d) relevance of nutrition, the interviewees were asked to use different colored pencils. The color distinction helped the athletes and the interviewer relate to and reflect on the career lines individually and in relation to each other. Figure 2 pictures the completed biographical map of Timo, the athlete introduced earlier.
So far, the description of the method has focused on technical questions and handling the mapping grid within a narrative interview approach. In the following, we discuss the value of this qualitative method and the data elicited with it.
Research Values
At the outset of this article, we argued that the biographical mapping strategy is particularly suitable for studying health and illness careers over time and in biographical context. To exemplify this, we draw on the case of the 18-year-old athlete Leo who created a map that contains a number of features that were common in the maps of all sampled athletes. At the time of the interview, Leo was one of about 15 boys and girls on the national youth squad in biathlon, aiming to qualify for the junior elite level. He trained 15–20 hr per week and had lived at a boarding school with training center, to which he had moved at 13 years of age. Despite living apart from his family and having his peer group at the boarding school, Leo kept close contact with his family.
For better illustration, we have graphically recreated the original line drawing, translated entries into English, and included clarifying information, which Leo provided during the interview. We have also removed some identifiers for confidentiality reasons. Finally, we have changed the year dates into the athlete’s age to facilitate biographical orientation (see Figure 6).

Leo’s graphically edited biographical map (adopted from Thiel et al., 2011).
Drawing on Leo’s map and interview data, we will highlight two strengths: portraying the interplay between context, career development, and health and visualizing career paths, biographical turning points, and convergences chronologically.
Portraying the interplay between context, career development, and health
The elicited biographical maps visualize the interplay between social context, career development, and individuals’ health and well-being over time. In Leo’s case, this relationship can be seen when relating the life events he indicated on the timeline to the drawn career lines, notably the blue line representing his subjective state of health. The map reveals that Leo’s “well-being” (blue line) changed tremendously over time. The changes in Leo’s subjective state of health are interrelated with living conditions, requirements in sport and school, high athletic demands in the winter season in biathlon, sporting success, and experiences of physical (ill-)health.
For example, the initial very high (9) rating of his health state was connected to the biathlon training at his home club: “I was pretty motivated at that time, because I just always enjoyed it there [local training]. That was really quite good [pauses while drawing] and also the following year.” As Leo continued drawing, he suddenly paused and stated: Well, I have to admit that from when I transferred [to the national training center at age 10] that it already went DOWN a bit, because it was quite stressful. Because it was only then you realized WHAT it actually is all about. Because the FIRST years at home, you thought it was FUN…but then at the training center with a real TRAINING group, it got straight down to the nitty-gritty. That was really a pretty big change [change of school], because you had more hours and also more stress. And then there was the training on top of that, so there were points where you were pretty wiped out. So that was [the blue line] a little further down [pauses while drawing]. I’ll just put it [the blue line] here in the middle [5] over the entire year, yeah?
Mhm.
Where are we? [pauses while drawing] Everything was really pretty stressful [pauses while drawing]. So, with the boarding school, I didn’t really have any problems there. There, I actually had fun because you could do stuff in the evening with the very same people you’d spent the day with. I actually really liked that.
The quote outlines how contexts, demands, and changes in living conditions affected Leo’s well-being at different moments. The citation further illustrates the process of reconstruction of experiences and feelings that Leo voiced aloud while drawing. The passage also shows how the drawing activity became a shared operation between Leo and the interviewer.
With regard to the further development of the blue line (between ages 13 and 18), the synchrony with career progression, rankings, and cup positions stands out. As Leo was able to remember more details of the last 5 years, the line flow fluctuated more strongly. Further, the ups and downs he traced regarding his well-being show a strong correlation with his results in competition (e.g., he indicated a peak 9.5 for ranking first in the national youth cup at age 16). The most obvious exception to this interdependency is a lingering infection in the season prior to the interview. From the subjective perspective of the athlete, this illness experience endangered his career. To express the associated distress, the athlete finished the blue line in a deep drop.
Taken together, the course of Leo’s well-being line visualizes a strong impact of changes in living conditions, requirements in his sport and at school, and not least the degree of athletic success. The progressive narrowing of the athlete’s understanding of health represents a socialization effect of the highly competitive environment, which obliges him to concentrate his daily routine fully on achieving top rankings to save his spot in the national squad.
Visualizing career paths, biographical turning points, and convergences in biographies
Analyzing Leo’s map as a whole, one can easily recognize that the four career lines neither flow steadily nor develop linearly. Instead, alternations of ascents and descents form developmental waves and plateaus. In this sense, the vicissitudes of the career lines represent turning points and transitions in Leo’s biography.
According to the course of the curves, an early turning point in Leo’s career was caused by moving to another training group at age 11. This transition coincided with the enrolment into secondary school, which—as discussed earlier—was challenging and stressful for Leo (see blue line). The next turning point, which Leo accorded a positive effect on his career progression, was the transition from home to living at the boarding school of the training center at age 13. This change improved not only his well-being (blue line) but also led to an increased health consciousness (red line) and attention to his diet (green line).
Between 15 and 16 years of age, Leo experienced another “convergence” of biographical turning points: the selection into the national youth squad and a change in sporting requirements. While Leo had occupied a strong position in his local training group, being selected to the national squad implied increased competition with other high performers (see Schubring & Thiel, 2014). As an effect, “every training session turns into a battle to prove time and time again that you are actually good.” At the same time, the age-related change from shooting with an air gun rifle to shooting with the official small caliber rifle used in elite biathlon demanded Leo to adjust his shooting technique. Together, the convergence of transitions had a destabilizing effect on Leo’s performance (black line) and well-being (blue line).
Closer analysis of the developmental strands reveals biographical turning points were not only related to structural transitions in sport and education. The dropping blue and black lines at the right end of Leo’s drawing visualize an illness experience that had not only a critical impact on Leo’s health and well-being but also on his athletic development. As an effect, the illness (infection), which persisted for several months, reshaped his attitude toward health and hygiene: I have noticed that you can’t just jump in [situations] without looking. That you can’t just always touch everything everywhere. You have to pay a little more attention to your health. Because it was pretty harmless [the initial infection], but then it was an extreme setback. That was really new for me, and something that came with attending the boarding school, because so many people were sick and then you really had to think about what you were doing. Because there was always the danger that you were going to get sick yourself.
The green line, which Leo drew for the subjective relevance he attached to nutritional issues at different points of his career, reflects a similar pattern. Before his selection into the national team at age 15, Leo did not attach much importance to his diet (green line below point 4). Since then, both his wish to race as fast as possible and federation-steered information sessions on nutrition have triggered a change in attitude. Shortly before the interview, for example, Leo started to avoid sweets and white bread, foods he feared would increase his weight and affect his performance negatively. Taken together, Leo’s map offers unique insights into the unfolding of an elite sport career. Furthermore, the chronological visualization provides a condensed overview of critical life events and the implications these have on adolescent athletes’ health and biographies.
In this section, we used exemplary biographical mapping and narrative interview material to delineate methodological and analytical advantages of the described integrated data collection strategy. In summary, we aimed to highlight the following: First, the elicited data have the potential to open “windows” into peoples’ biographies and to provide differentiated insights into individual (ill-)health experiences and health-related processes of meaning-making. Second, the participant-generated biographical maps portray how social structures, cultural norms, and value sets shape careers. The visualizations also reveal the complex interrelation of different development strands by integrating contextual information and career-related developments in different content-related dimensions. Third, biographical mapping opens up new possibilities for qualitative data analysis and knowledge gain and can stimulate self-reflection in participants.
Discussion
The aforementioned insights demonstrate that biographical mapping is a valuable graphic elicitation tool for retrospective health and career analyses. While other forms of timeline drawings (Bagnoli, 2009; Kolar et al., 2015; Sheridan et al., 2011; Wilson et al., 2007) and career mappings (Digel, Thiel, Schreiner, & Waigel, 2010; Mayer, 2010) focus on eliciting one life course or a single thematic career line, the described strategy advances existing drawing techniques through its multidimensionality. 9 As highlighted by Baur (1989), life courses are made up of different thematic careers, such as “educational careers,” “body careers,” or “sporting careers” (in the case of athletes). The biographical mapping method directly addresses the multidimensionality of careers that develop within a life course and gives insights into the ways individuals cope with convergences and asynchronies between the different strands of development. In addition, the drawings indicate that developmental processes are neither straight nor predictable (see also Bloomer & Hodkinson, 2000). Instead, numerous ups and downs, interruptions, transitions, and turning points can be found within participants’ biographical reconstructions. In highlighting the variety and unpredictability of biographies, the completed maps have great analytical potential. Not least, because they capture biographical “reconstructions” (Berger & Luckmann, 1980) created at the time and in the context of the interview situation (Buckley & Waring, 2013; Weber, 2008). Finally, by visualizing the relevance and the handling of health and nutritional issues as dependent on the socialization context, the maps give further empirical evidence of what body sociologists have claimed in their respective theories (Bourdieu, 1984; Frank, 1995; Shilling, 2008).
As a data elicitation tool, the mapping grid had a positive impact both on the participants’ memory work and on the interview dynamic: First, drawing in addition to telling, provided young athletes with an additional modality to access and express the biographical story they had embodied and come to remember. Second, the grid gave the participating adolescents a support for their narrations and allowed them to be more active within the research process. Notably, when explaining their drawings and entries to the researcher, they could take the role of expert and moderate age and role differences between interviewer and interviewee (for similar findings, Clark, 2011; Driessnack, 2006; Guenette & Marshall, 2009; Kolar et al., 2015).
In addition to facilitating recall and participation in the research process, the mapping process triggered self-reflection in the interviewees—as it has been argued for visual methods more generally (Bagnoli, 2009; Prosser & Loxely, 2008; Tarr & Thomas, 2011). Some of the participants shared that they had never really thought about developmental processes in sport in this way and only recognized coherences and interrelations between different events and development strands through the mapping process. Some athletes also spontaneously asked the interviewer for a picture of their maps, reactions that support Buckley and Waring’s (2013) argument for the benefits of visualizations in qualitative research. We thus believe that biographical mapping can be of value for the interviewees themselves and lead to an increased awareness of the dynamics and risks involved in their career development (see also Kolar et al., 2015; Parry, Thomson, & Fowkes, 1999). However, as outlined for other visual elicitation methods (e.g., Kat, Farah, Linda, & Patricia, 2015; Prosser, 2011), the drawing process can also bring up painful memories, which requires thoughtful handling by the interviewer.
In contrast to open forms of line drawings for which participants are intentionally given only a blank paper and few instructions on how to draw (Bagnoli, 2009; Guenette & Marshall, 2009; Wilson et al., 2007), the two-dimensional mapping grid (Figure 1), its time axis, and rating scale provide more orientation for the interviewee. Although prestructuring implies that the drawing options are reduced and that the interviewer is more present in guiding the elicitation process, we also see advantages in this approach: During data collection, the grid encourages temporalization and differentiated evaluation of critical experiences, which facilitates biographical contextualization when interpreting participants’ narrations. Further, the more standardized drawing frame helps to identify common patterns and differences between visualizations. In our study, for example, the line flow and detail that athletes participating in wrestling (a sport in which much attention is given to weight requirements and food intake) choose to map “the relevance of nutrition” (green line) is eye-catching. Considering the biographical maps from a hermeneutic vantage point as part of the “story” told, their distinctness in detail, line pathways, and shape can be considered a starting point for interpretation—be it in an effort of faithful representation or to pay attention “to how the story is construed and how its parts are ordered and juxtaposed, noticing the ‘negative spaces’ of silence and omissions, and focusing on contradictions and inconsistencies” (Josselson, 2004, p. 18).
Conclusion
The biographical mapping approach possesses great potential for qualitative research, the visualization of research results, as well as for practical application. Within the context of elite sport, biographical mapping may help athletes to become aware of factors that are shaping their careers, which can be a first step toward increased “ownership” and agency. With some adaptions, the method can be applied to other process-oriented and biographical research fields. We also see potential for researching conflicting lived experiences in dyadic relationships (e.g., coach-athlete, teacher-student, and parent-child). In terms of practical applications, the tool could be developed further to help patients’ share their illness careers and establish more holistic case histories in doctor–patient dialogues. Finally, biographical mapping may also be used in career counseling and to help clients better prepare for transitions.
Footnotes
Acknowledgment
We are grateful to the study participants who shared their experiences.
Declaration of Conflicting Interests
The author(s) declared no potential conflicts of interest with respect to the research, authorship, and/or publication of this article.
Funding
The author(s) disclosed receipt of the following financial support for the research, authorship, and/or publication of this article: The article reports on a project that has been funded by the Federal Institute of Sport Science (BISp; grant number IIA1-081907/13-14).