
Abstract
This article introduces the new application of Raymond Padilla’s unfolding matrix in setting boundaries for postcollection qualitative data in educational research. It focuses on displaying the sample ways of using Padilla’s technique to solve the common problems of qualitative research when the researcher may have collected unnecessary data or may have missed important data in certain research. Using the sample of a real educational research aims to illustrate how this technique is used and modified to be different from its original versions. This article would call for attention and be helpful to any researchers with qualitative data of similar research contexts and designs.
Keywords
What Is Already Known?
In qualitative research, researchers tend to design and make appropriate estimation for their samples, data, and how the data would be analyzed. The collected data in a research are usually framed before the completion of the collecting process. This protocol is popular and commonly used among the researchers.
What This Paper Adds?
This paper adds a new solution for the case when the data collection turns to be too huge and exceeds the estimation before conducting the research. When the researchers collect a lot of data and the scale of these data exceeding all the possible slots. The researchers should find a way to frame the data so that they will not miss any pieces of information during the analysis process. The new application, described in this paper, would facilitate the process of framing data in the stage of post-collection data. The newbie researchers of qualitative methods would have one more option for their academic practices.
The inquiry of learning about Raymond Padilla’s unfolding matrix arose during the stage of sorting and framing the collection of qualitative data for my doctoral studies. The problem was not estimated in the earlier stages until the collection of data reached over 62,000 words from interviews and feedback. Regardless of the reliability and validity of the tools and assuming that research methods have been used correctly for that process, this huge collection created the needs for an essential way to set boundaries for answering the research questions and analyze these qualitative data.
At the time Padilla’s 1 unfolding matrix was introduced, the challenges seemed to be resolved until mastering the process of self-studying and figured out how the unfolding matrix should be understood and applied to the current set of data. This technique was soon recognized to be good for qualitative acquisition and analyses (Padilla, 1994). However, the unfolding matrix is a technique for pre-data collection as described in Padilla’s book chapter about it.
The new application of the unfolding matrix in this article is especially viable because the research leading to this technique has large qualitative data sets which contain enough data to complete a matrix. The reason is that if the data set is too small, it may not be possible to get a clear picture of the phenomenon under study. According to Padilla, that’s really the principle argument to be made for using the Unfolding Matrix for data collection: One can collect relevant data to saturation (assuming one knows the relevant categories before hand). In the case of using the Unfolding Matrix post data collection, and especially if the data set is small, there is the risk that the data set may not have saturated the relevant concepts sufficiently.
2
Unless a reasonable boundary is established, the research runs a risk of collecting unnecessary date while possibly missing data that are essential to the research question. Padilla (1994, p. 273)
In order to describe how the notion of Padilla’s unfolding matrix was used in my research, this article focuses on the practical application of data analysis with samples for similar inquiries in educational research. Since this writing is not genuinely a research article, but more as a descriptive paper for introducing and sampling how the unfolding matrix differed from its original version, let’s assume that all the data are ready for setting the boundaries and analysis. The content of this article was mainly extracted and modified from the reports of my PhD studies.
Sample Research for Data Analysis
A research sought to problematize significant learning in a university context from the perspectives of the international students on how professors teach and facilitate students’ learning. The research focus was on interpreting the perspectives, learning, and teaching practices in relation to the teachers’ orientations for student learning in accordance with Fink’s six dimensions 3 of significant learning and professional development for both the teachers and pedagogical students.
This study is a mixed-type qualitative research with an empirical study and an action research (Kemmis, 1988, 2009; Kemmis & McTaggart, 1988; Zeni, 1998) using a multiple design which aims to investigate the teachers’ factors in facilitating students’ learning and that from the practicum processes to formulate and problematize significant learning. According to Shank (2006), the concept of mixed methods in qualitative approach was involved in debating on quantitative methods for a long time. In many research contexts, the notion of mixing qualitative and quantitative methods could become controversial because some researchers utilized multiple interrelated methods aiming to cover the problem of one by another involving different types of tools and data (Denzin & Lincoln, 1994). However, the design of this research project was simply a qualitative research with mixed type of approaches in an empirical study and an action research. This design is theoretically supported by Merriam (1998, 2009) that qualitative research is used widely in various ways for conducting a qualitative inquiry. Since the lack of history to support the qualitative methodology in the seventies of the previous century, Howe and Eisenhart (1990) propose a set of standards when the proliferation of qualitative methods in educational research became a considerable controversy for the design and conduct of research.
The research interpreted the collected data from different research tools in two main research projects to problematize significant learning with the teachers’ teaching orientations. The empirical research project investigated the teachers’ orientations as the grounded notion from a prestudy in the data from 102 observing hours, nonstandardized interviews of three teachers, and eight interviewed international students. Different from the first research project, the action research focus was on the process of teaching modification from the teacher’s side to facilitate students’ significant learning through the practicum and the analysis of 45 students’ expectations and 96 reflections about their learning in a specific course of classroom management for pedagogical students of English. The data collected were categorized, coded, and analyzed using Padilla’s unfolding matrix. The explanations for the findings were combined with the existing data, theoretical backgrounds, and grounded theories of the research concepts.
The data in this research were analyzed using the technique of unfolding matrix (Padilla, 1994) for classifying the raw data into the set of boundaries to be relevant to the teachers’ orientations and students’ learning. After having these data in the unfolded matrices from all research tools, the data were synthesized using the deductive methods and then using the traditional method approach to writing the research findings which were separated from the sections for discussions (Burnard, Gill, Stewart, Treasure, & Chadwick, 2008).
In short, the study problematized students’ learning through the study of the teachers with their orientations in the job and how the learning process would be facilitated and students would be emancipated for their significant learning from the applicable notions of the taxonomy of significant learning (Fink, 2002, 2003). The data from this study will be used as the samples for describing the applications of Padilla’s unfolding matrix in the cases of analyzing interviews and reflections.
Sample Application of Using Padilla’s Unfolding Matrix With Data From Interviews
This part describes the ways the patterns were searched within the data for analysis and interprets the data. During the process, the guides of the unfolding matrix were applied to classify the data into different orientations of the teachers who facilitated students’ learning. According to the grounded theory in the prestudy 4 for the definitions of the teachers with six orientations, the data of this study including observations (not introduced in this article), interviews with teachers, and interviews with international students were classified into six orientations. During the process of unfolding matrix, if the patterns were found unrelated to these orientations but important for answering the research question, they would be analyzed in the session beyond the orientations.
Prior to the explanation and description of the whole process, a brief numbered proposed or possible steps in detail can be generalized as follows:
Step 0: Read, learn, and understand how and the reasons why to create the matrix for framing data in qualitative analysis.
Step 1: Design the matrix forms relevant to your types and scales of data.
Step 2: Carefully and systematically code the data so that no information will be missed after the framing process; when a piece of data seems to be irrelevant, it is possible to retrieve the original messages from the whole set of data. Taking notes of all codes and possible explanation during the coding process that would be very important for the clarification in the methods of analysis in any reports later.
Step 3: Read the data from each tool one by one, code each piece of data relevant to the research inquiries into the appropriate folder in the matrix until each relevant data from all tools are quoted and coded in a specific place in the matrix.
Step 4: Read the matrix with coded quotes from the data and analyze and draw out some patterns from different sets of data. The pattern will be about the same type of answers or information that different sources of data give in the research. For example, the answers of different types of participants about their schools. From these patterns, the findings will be available.
Step 5+
: In case the data are still huge after seeing the patterns from the unfolding matrix, a new process of Steps 1 to 4 should be repeated for each pattern to figure out smaller patterns. This step will help the researchers to narrow again the data for analysis as in Figure 1 for the data mining process.
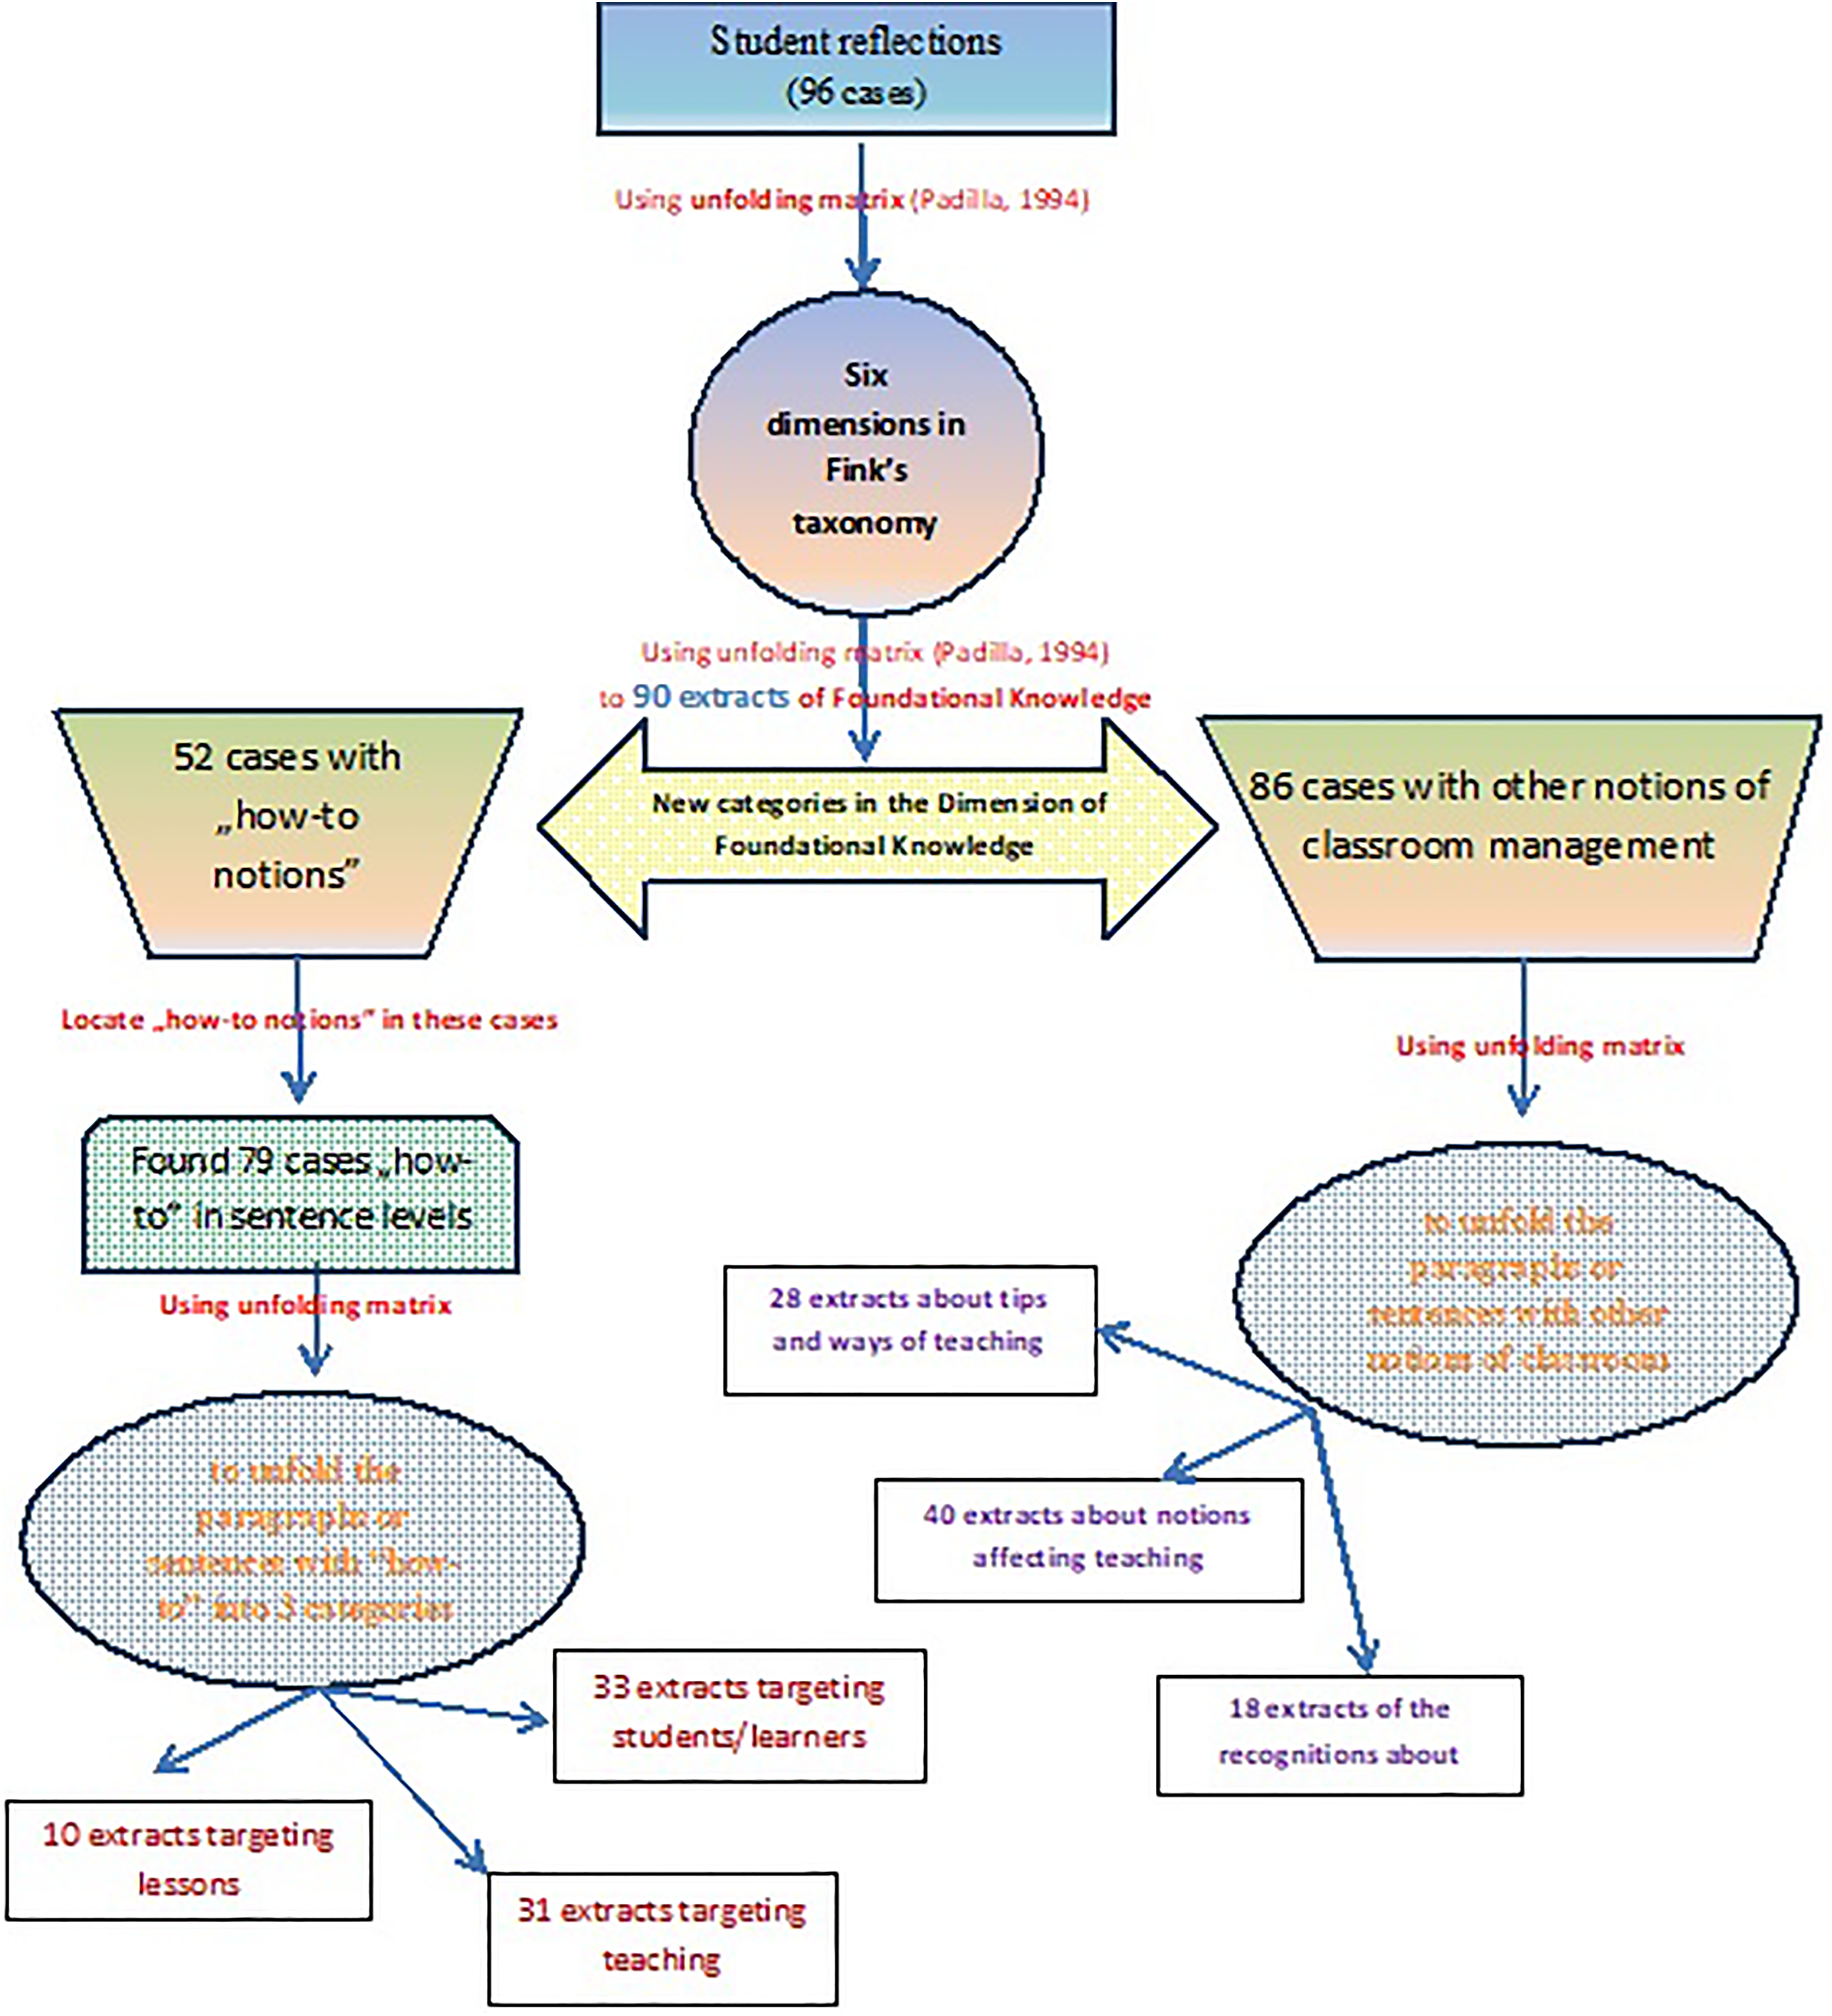
Data mining process for the dimension of foundational knowledge. Professor Raymond Padilla commented on the author’s idea about this Figure in his e-mail dated December 14, 2016, as “I like the way that you displayed your research in Figure 1.”
I first designed matrix forms to unfold during the process of capturing the relevant data (Padilla, 1994). The empty matrix form is given in Table 1.
As with Table 1, the data relevant to the teachers’ communication orientation were first captured, coded, and then put into the parallel column of coded extracts. When all data from all research tools were completely captured and sorted into the (1) communication orientation, the same process was done for the next orientation of expertise (2). The same method was used for capturing, coding, and extracting to the column in the matrix until it unfolded to the last data. Then, the same procedures and steps were repeated for (3) student orientation, (4) teaching orientation, (5) professional orientation, and (6) personal orientation.
Empty Unfolding Matrix.

The coding method for the data of interviews used in the unfolding matrix is given in Table 2.
From Table 2, every extract displaying in this session could be tracked for its source in the set of raw data. In fact, it could be understood that the extracts from applying the technique of unfolding matrix were also raw data but found within the boundaries to answer the research question. In this case, these classified data were unfolded to find the ways on how the teachers facilitated students’ learning in analyzing them with the orientations. Therefore, the patterns from each teacher’s orientation were synthesized for the findings and further discussions.
Description of Codes for the Data of Interviews.

In order to clarify how the coding system was applied for extracting relevant data into the unfolding matrix of Padilla, Table 3 displayed some samples from each orientation with each type of data from different groups of respondents.
The Samples of Coded Extracts.
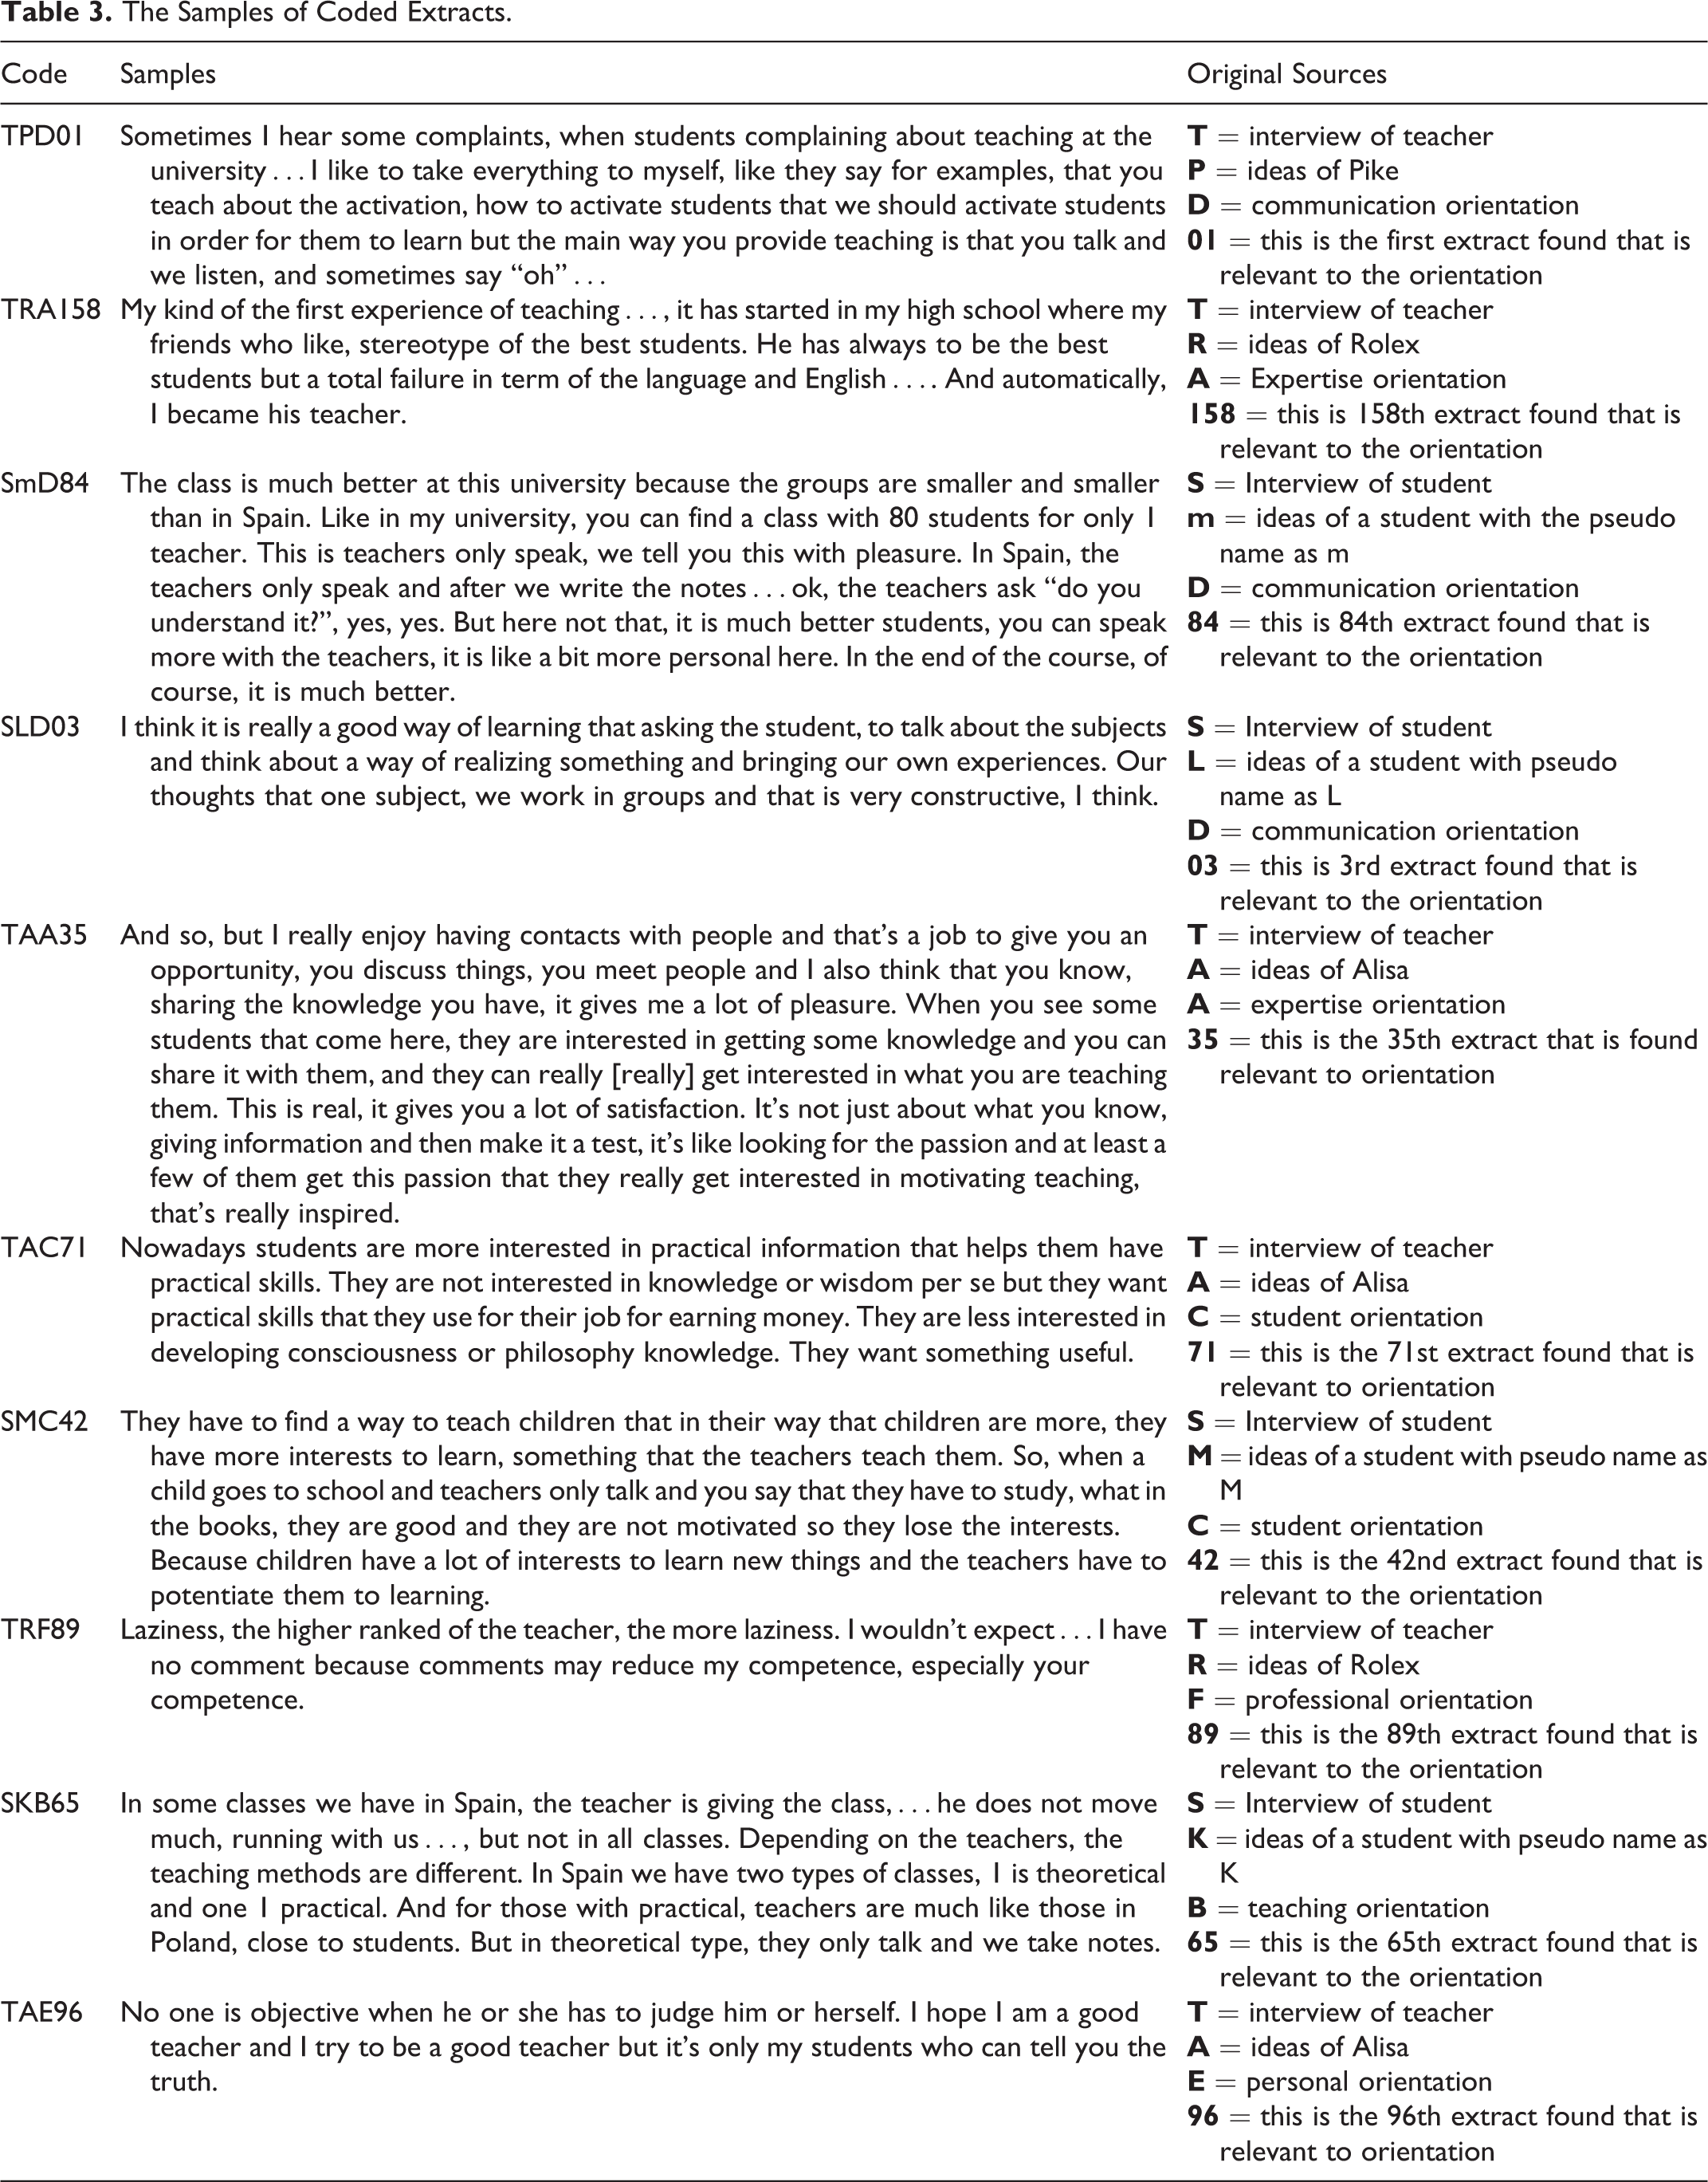
The next step after unfolding the data into the matrices was to carefully analyze and find the patterns among these raw data from both students and the teachers. The completed matrices and supplementary data represent the raw data which then are subjected to careful analysis. (Padilla, 1994, p. 280)
Another Application of Padilla’s Unfolding Matrix to Students’ Reflections and One Special Method of Analysis
I applied two different ways to analyze the data from student reflections. The first way was applying Padilla’s technique of unfolding matrix as the above descriptions of how to set the boundaries to the data, unfold the raw data to Fink’s taxonomy, 5 and then analyzing the patterns found from each dimension of significant learning. The finding from this method of analysis was presented after the section of general information about student reflections.
The second way to analyze the word used in students’ reflections was the application of discourse analysis. 6 It was done simply from the surface level of words in the reflections before checking the issues of semantics using the first way of unfolding matrix. For the first step, the frequency of words in all 96 cases was analyzed. Then, all these words were grouped into different categories of (1) the objects in classroom management, (2) the notions of what they learned, (3) the degree of satisfaction about the lessons, and (4) the negative awareness. The counted words were classified into these four categories for analysis. Since the purposes of learning from student reflections were mainly for the modifications to teach better, in the next step, all the cases with negative awareness were carefully analyzed. All the words within the categories of negative awareness were used as a link to locate the extracts containing them.
After setting the boundaries of raw reflections in terms of extracts using unfolding matrix of relevant research questions, these found extracts with negative words inside the sentences containing that word were analyzed using Atlas.ti (version 7.5.12) to categorize into different codes and filter for quotations. 7 Although these quotations embedded the negative words, it could be the situations of (1) a double negation, (2) a way of emphasis using negations, or (3) the real negative reflections. Among these, the next step in my way of analysis was to focus on these real negative reflections to study the meanings of the extracts so as to learn and plan for some modifications about the coming teaching courses.
During the analysis process, a similar system of codes was used to indicate the extracts that were analyzed with negative signals. The samples are given in Table 4.
Description of Codes for the Data of Interviews and Sample Interpretation.
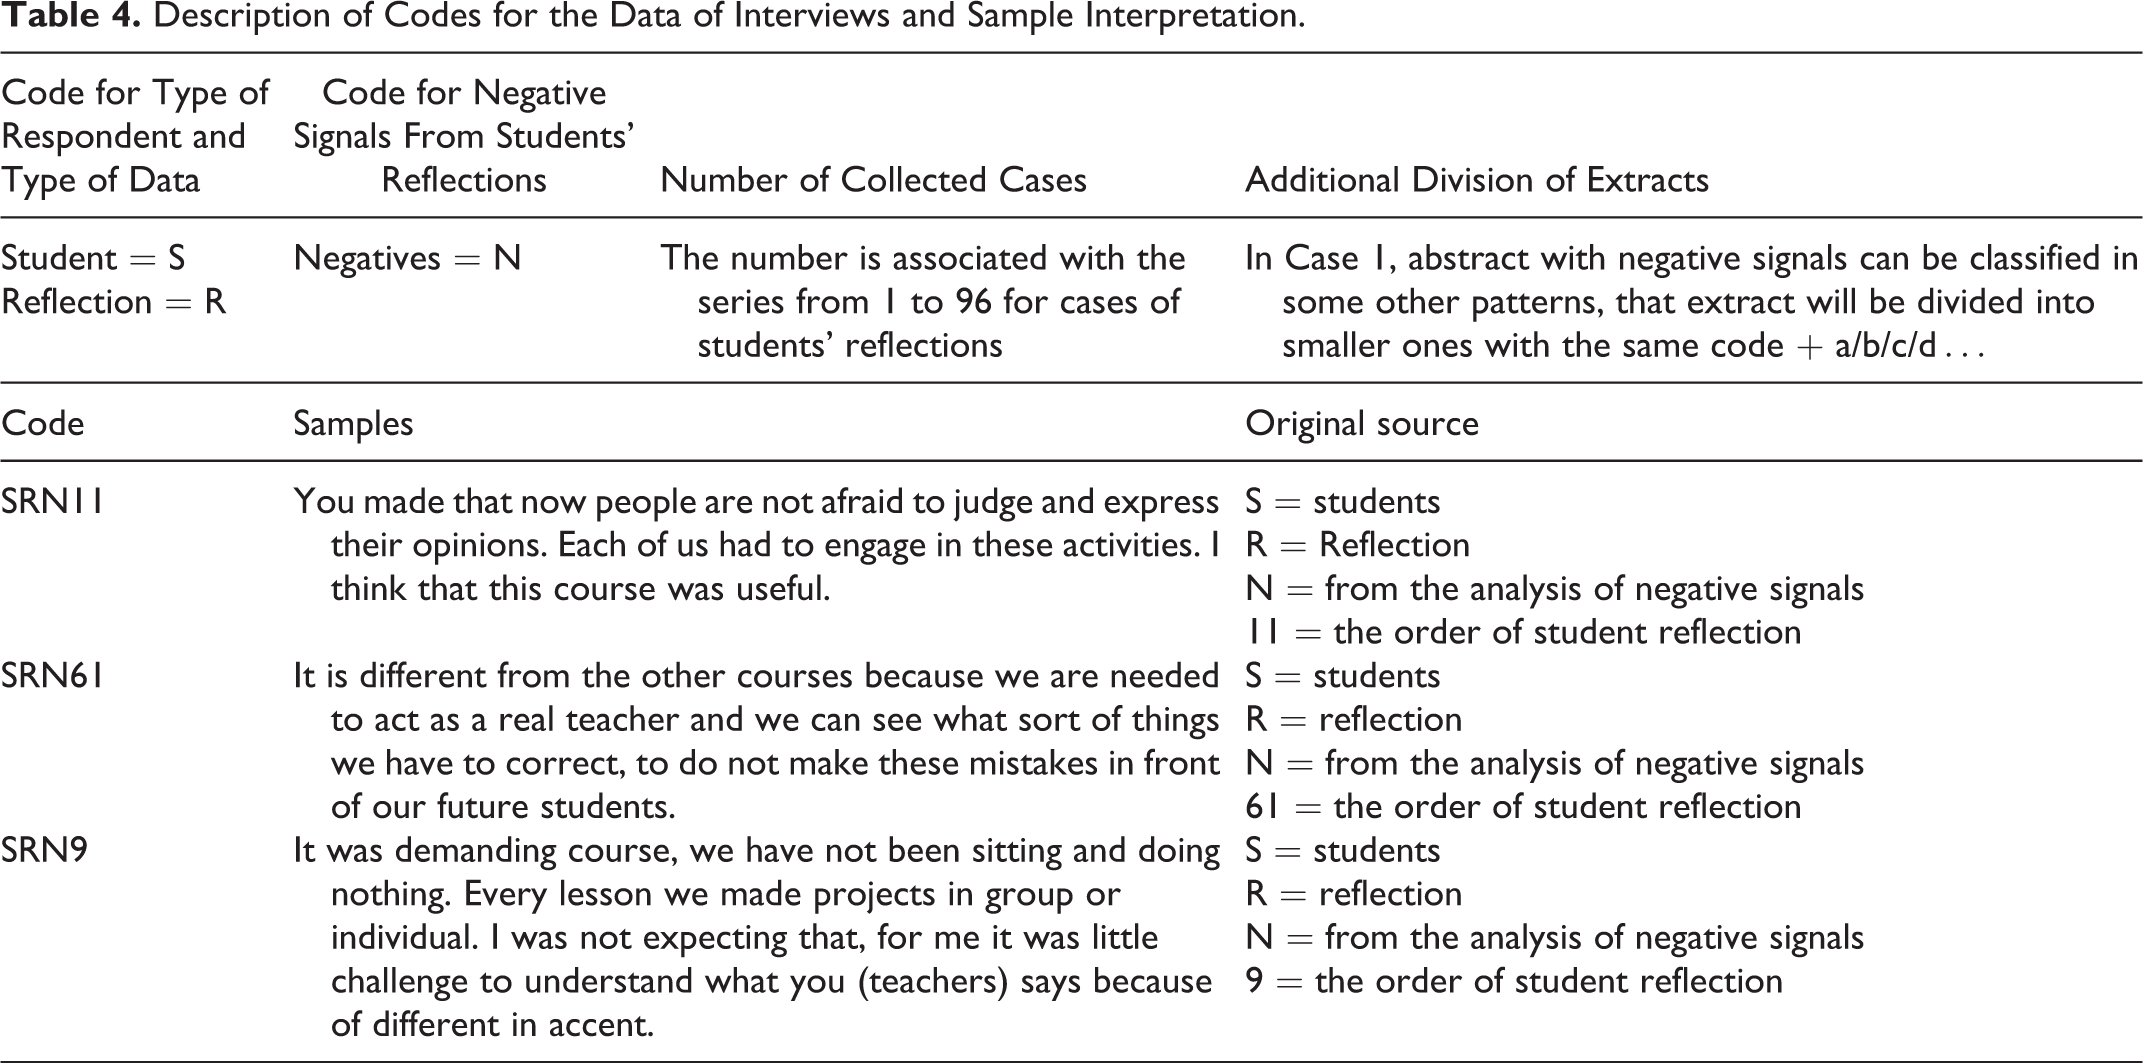
I have to clarify that this way of analyzing the data from student reflection with negative signals was totally separated from the methods of data analysis in accordance with Fink’s taxonomy. It could be simply seen that the same data of students’ reflections were analyzed by two different ways for other aspects of looking at the data.
A different special way of analysis was applied to analyze the dimension of foundational knowledge from student reflections because this dimension was unfolded with a large quantity of data. Ninety extracts were found relevant to this dimension which needed a special way for analysis. The data mining approach was applied to find the data patterns in it. Data mining approach was the way for a researcher to divide the data into smaller categories prior to analysis. This dimension was grouped into two smaller categories of those with “how-to” notions and those without “how-to.” Similar to Padilla’s unfolding matrix, a loop of classifying data 8 into smaller groups was used before naming any patterns for analysis. The data mining which was applied to the extracts in the dimension of foundational knowledge could be display in Figure 1.
It can be seen from Figure 1 that Padilla’s technique of unfolding matrix was used in a loop of at least 4 times for this dimension of foundational knowledge. The scale of data was large and complicated because the distinction among the knowledge in this course of classroom management was vague. It was complicated because the skills of managing the class could also be classified as the foundational knowledge. The skills could be understood and interpreted into both the dimensions of application and foundational knowledge because the contents of the courses involved practical and applicable aspects of each element in the lessons.
Conclusions
This application to the process of analyzing the data raised the aforementioned awareness about how the researchers ensure their data are not missed or irrelevant to the main research issues. It was not to be used to compare with Raymond Padilla’s unfolding matrix or any other process in framing qualitative data in the pre- or post-data collection. It is just newly applied for a specific research with large sets of data, a new application of framing huge qualitative data derived from Padilla (1994). This article introduces not only how the process has been used, but also how the follow-up activities for educational research have been modified from a certain research to introduce how this technique can be used differently. In addition, even when experienced researchers mastered and did not have problems with the technique of unfolding matrix for their data collection and analysis, the clarification and examples of how these extracted data found and displayed in the matrices can be coded and used in the main reports have possibly become a quest for new researchers. As a result, this technique of unfolding matrix has been used in different ways for the concentration of relevant data. It can be used at the levels of meanings with manual selection of data and technical recognitions with current software for qualitative data analysis. This technique of Padilla could be expanded to a loop of different repetition processes until the researchers could locate important extracts of their data.
Footnotes
Declaration of Conflicting Interests
The author(s) declared no potential conflicts of interest with respect to the research, authorship, and/or publication of this article.
Funding
The author(s) received no financial support for the research, authorship, and/or publication of this article.