
Abstract
Projective techniques are qualitative methods that allow health researchers to elucidate and interpret patients’ values and experiences. However, these methods typically generate complex, at best semi-structured, and often metaphorical data that are challenging to analyse consistently at a scale. Recent advances in artificial intelligence, particularly in automated image segmentation and optical character recognition, offer new possibilities for assisting qualitative researchers in analysing and interpreting projective data of non-trivial complexity. Artificial intelligence-driven segmentation facilitates the identification of visual elements within drawings while character recognition enables the extraction of textual elements from handwritten materials. By automating these key aspects of the data processing, artificial intelligence may augment human analysis and enhance the scalability, consistency, and objectivity of projective techniques. This article explores the integration of artificial intelligence in qualitative health research, employing the concrete case of a drawing-based projective technique for elucidating the self-rated importance of health-related resources in illness prevention interventions.
Keywords
Introduction
Projective techniques have long been a cornerstone of social and behavioural sciences research, enabling the exploration of participants’ implicit thoughts, feelings, and perceptions (Branthwaite & Patterson, 2011; McGrath et al., 1993). By engaging participants in creative tasks such as drawing or storytelling, these methods bypass the constraints of direct questioning, eliciting less rationalising and more spontaneous responses compared to interview- and focus-group-based methods. The anticipation is that the responses obtained through projective techniques will be less influenced by the impact of reflexive response biases compared to conventional qualitative methods (Malone & Hackett, 2020).
However, the subjective nature of analysing data collected through projective techniques has led to methodological concerns regarding the quantifiability, reliability, and comparability of results (Rook, 2006), complicating study reproducibility and the integration of results in mixed-methods research. In qualitative research, where interpretive depth and reflexivity are essential for ensuring contextual understanding, such challenges are particularly pronounced. The integration of artificial intelligence (AI) into qualitative research, therefore, creates both opportunities and tensions: while AI might enhance analytical transparency and scalability, it also raises new epistemological questions about how meaning is generated and interpreted. Addressing these tensions requires more than technical innovation – it calls for methodological reflection on how AI can augment rather than automate qualitative interpretation.
The recent advent of powerful AI models that learn from large textual and visual data sets has the potential to automate both cognitive and mental tasks in qualitative data analysis. AI systems based on large language models such as ChatGPT have brought the question of their applicability to the analysis of qualitative text data to the very forefront of qualitative health research (van Manen, 2023). This development continues the trend of AI-enhanced qualitative data analysis software, ranging from commercial offerings such as MaxQDA to research tools such as CODY (Rietz & Maedche, 2021). AI models have also been used to support idea generation, writing, and literature search (Lu et al., 2024; Ouzzani et al., 2016; Tallyn et al., 2018).
While much of this work has focused on textual data, AI also holds clear potential for assisting researchers with visual data analysis (Hitch, 2024). Visual projective techniques have already been applied in developing AI-based learning tools (Karimova et al., 2025), yet the reverse application – the use of AI to analyse data produced through projective techniques – remains underexplored. This gap has only recently been identified as a direction for future methodological research on projective techniques (Piotrowski, 2025).
Aim
This article aims to explore the methodological potential of AI-augmented qualitative visual data analysis empirically and critically.
To move beyond informed speculation and theoretical reflections, we have developed an AI analyser for data collected through a specific visual projective technique – the 12 Circles Drawing Technique (12-CDT) – as a prototypical case study based on a dataset collected from 2,118 participants. The 12-CDT involves a drawing task designed to elucidate participants’ self-rated importance of various health-related resources. This method was originally developed (Schneider-Kamp et al., 2024) in the context of an ongoing multi-country, multi-centre, multi-cultural, multi-lingual illness prevention project (Collatuzzo et al., 2025; Kostrzewa et al., 2025; Schneider-Kamp et al., 2025). In this project, it is applied to enhance the understanding of sociocultural and behavioural barriers and facilitators of prevention interventions through a resource-based view on individual health-related practices.
Grounding our methodological exploration in a real-world, large-scale qualitative data collection provides an opportunity for introducing and reflecting upon an innovative approach to analysing projective data with AI in qualitative health research. Rather than pursuing full automation, we focus on AI augmentation, i.e., the use of AI to complement and extend human analysis and interpretation. This allows for critical reflection on the evolving intersection between AI tools and human-driven qualitative data analysis, including the ethical and epistemological considerations such integration necessarily entails.
The remainder of this article is structured as follows. The next two sections briefly introduce projective techniques, in general, and the 12-CDT, in particular. We then describe and evaluate the manual and the AI-augmented analysis of the 12-CDT, respectively, before critically evaluating and discussing the performance, strengths, and limitations of the AI-augmented approach. The article concludes by outlining implications for the methodological integration of AI into qualitative inquiry.
Projective Techniques
Projective techniques, such as the broadly popularised Rorschach inkblot test, originated during the first half of the 20th century in the field of psychology, where they were initially developed for personality assessment and the evaluation of personal functioning (Jura, 2017). These techniques involve the presentation of ambiguous stimuli to participants, with the aim of accessing thoughts and feelings that might not be easily captured through direct questioning.
Conventional tools such as questionnaires, interviews, and focus groups typically rely on eliciting self-reported data through direct questioning. These routinely fail to capture the nuanced, social and/or subconscious aspects of complex social practices. One of the primary issues is the phenomenon known as social desirability bias (Júnior & Patrício, 2022), where individuals may consciously or unconsciously provide responses that they believe are more socially acceptable or favourable rather than their true feelings or experiences. This is especially problematic in contexts such as education and health where societal norms may dictate certain expectations around behaviours and conditions.
As a result, self-reported data may reflect what participants think they should say instead of their genuine experiences or attitudes. Self-reported methods often assume that individuals have sufficient self-awareness of their thoughts and feelings to provide accurate reports. However, many socio-psychological and emotional aspects may reside in the subconscious beyond the immediate grasp of individuals. The resulting lack of awareness can lead to significant discrepancies between self-reported data and actual behaviours and practices. Conventional questionnaires largely focus on conscious thoughts and behaviours, neglecting the complex interplay of subconscious motivations that can affect decision-making and -outcomes (Jacobs, 2016).
By reducing personalisation in the questions posed to participants, projective techniques minimise sensitivity to responses and lower participants’ conscious defences (Das, 2018). Through ambiguous stimuli and open-ended tasks, these techniques are anticipated to elicit more spontaneous and less rationalised responses compared to conventional qualitative approaches including direct questioning such as interviews and focus groups. The confluence of these effects supposedly minimizes the influence of response biases (Malone & Hackett, 2020).
The theoretical foundation of projective techniques is closely tied to Freudian psychology with its conceptualization of the unconscious mind and projection as a defence mechanism. This perspective posits that individuals often struggle to articulate their motivations and emotions due to repression, social desirability bias, or lack of awareness (Jura, 2017; Tuber, 2012). As a result, projective methods bypass direct questioning by eliciting responses that are shaped by a participant’s internal cognitive and emotional processes. This approach has been widely used in clinical psychology for personality assessment (Morimoto & Ito, 2020). In addition to this individual-psychological use, projective techniques have also proven useful in eliciting social imaginaries and desires (Belk et al., 2003). Thus, it is also much used in market research to understand consumer behaviour (Donoghue, 2000; Mzahi, 2014; Pettigrew & Charters, 2008), and in qualitative health research to explore socially complex and sensitive issues (Sijtsema et al., 2007; Wiehagen et al., 2007).
Applications in Health Research
Beyond the classical personality assessments of value in psychiatric contexts, projective techniques are particularly valuable in somatic public health research for exploring sensitive or complex topics, as they provide a means for participants to express thoughts and emotions that may be difficult to articulate through conventional methods. These techniques have been used to investigate areas such as community attitudes toward cancer screenings (Wiehagen et al., 2007) or obstetrical nurses’ perceptions of medical interventions like Caesarean sections (Regan & Liaschenko, 2008).
The flexibility of projective techniques allowing for non-verbal stimuli and/or tasks makes them especially effective in culturally diverse contexts, where language or cultural barriers might limit the effectiveness of direct questioning (Sijtsema et al., 2007). The 12-CDT, introduced in this article, exemplifies such an approach by providing a visual and interactive means for participants to articulate their perceptions of health-related resources.
Limitations and Critique of Projective Techniques
One of the primary challenges of projective techniques is the subjectivity of interpretation, as responses to ambiguous stimuli can vary widely and require careful coding and analysis. The inherent openness of projective methods makes them susceptible to biases in scoring and interpretation, raising concerns about their replicability and generalisability across different research settings (Catterall & Ibbotson, 2000).
Another key critique involves issues of quantifiability (France, 2024). Unlike structured survey methods, projective techniques often produce rich, qualitative data that can be difficult to systematically analyse. While rigid coding and scoring systems have been developed to improve standardisation, these systems risk oversimplifying complex human responses, potentially leading to loss of depth and context in the data. Qualitative researchers are faced with a trade-off between high-speed automated insight generation and high-engagement meaning-making (Paulus & Marone, 2024).
Additionally, cross-cultural differences present a challenge for projective techniques. The way individuals interpret and respond to ambiguous stimuli is influenced by cultural norms, linguistic structures, and social conditioning, making it difficult to apply standardised scoring systems across diverse populations (Clarke, 2001). This issue is particularly relevant in qualitative health research, where understanding cultural perceptions of health and well-being is critical.
To summarise, while projective techniques excel at capturing complex, implicit experiences, they face significant limitations, including but not limited to: • Resource Intensity: Conventional projective techniques are labour-intensive and expensive, requiring skilled analysts and extensive manual processing. • Scalability Challenges: The high time and cost burdens limit the applicability of these techniques to large-scale studies, particularly in diverse populations. • Inconsistencies in Analysis: Manual interpretation is prone to variability, undermining the reliability and comparability of results.
Recent developments in AI have begun to address some of these methodological constraints. While AI applications in qualitative research have primarily focused on text-based data analysis (Paulus & Marone, 2024), there remains limited exploration of how AI might augment the analysis of non-verbal, visual projective techniques. The few existing studies applying computational methods to projective data (e.g., Karimova et al., 2025; Piotrowski, 2025) demonstrate preliminary feasibility but have not yet systematically evaluated how AI-augmented approaches compare to traditional manual analysis in terms of consistency, scalability, or interpretive depth.
This gap is particularly significant for qualitative health research, where projective techniques offer valuable insights into implicit health beliefs and resources, yet their labour-intensive nature limits their use in larger or more diverse samples. The question remains whether AI augmentation can address the practical limitations of resource intensity and scalability while preserving, or even enhancing, the interpretive richness that justifies projective techniques in the first place.
This article addresses this gap by developing and empirically evaluating an AI-augmented approach to analyzing the 12 Circles Drawing Technique (12-CDT), comparing it directly with conventional manual analysis to assess its methodological implications for qualitative health research.
The 12 Circles Drawing Technique
In our exploration of how AI might contribute to the analysis of projective techniques, we used a novel projective technique: the 12 Circles Drawing Technique (12-CDT). The technique is structured around 12 health-related resources, which is reflected in its name. This method was originally developed in the context of the ongoing Cancer Prevention at Work (CPW) project, where more than 10 healthcare centres implement pilot interventions across four countries and languages (Collatuzzo et al., 2025; Kostrzewa et al., 2025; Schneider-Kamp et al., 2025). In this context, the 12-CDT was developed to enhance the understanding of sociocultural and behavioural barriers and facilitators of prevention interventions among a large-scale and highly diverse group of participants (Schneider-Kamp et al., 2024).
We use the 12-CDT as a case study to investigate how the development and integration of an AI system for augmenting the analysis process might reduce the subjectivity that has long been a point of critique of projective techniques, offering a more consistent and systematic means of interpretation. What is more, an AI-augmented analysis is also crucial in scaling the method to collect data from hundreds to thousands of participants. While rigorous scoring systems have been applied to analyse data collected through projective techniques (France, 2024), to the best of our knowledge, our development of an AI analyser for the 12-CDT represents a first attempt at AI-augmented analysis of non-verbal projective technique.
The Design of the 12-CDT
The development of data collection methods often requires balancing conceptual clarity and simplicity with the desire to cover the subject at hand both in depth and breadth. Furthermore, given the distributed nature of the data collection, it was crucial for the method to be comprehensible to both participants and facilitators. To ensure such broad accessibility, 12-CDT needed to be intuitive and user-friendly, accommodating different cognitive and cultural processing styles.
To meet these requirements, the 12-CDT was designed to incorporate both textual and visual elements. This multimodal design ensures that diverse participant groups can effectively engage with the method, enhancing both usability and data richness. The texts were designed to be brief, comprehensible, and easily translatable to the four target languages.
The 12 health-related resources at the centre of the 12-CDT were carefully curated based on Schneider-Kamp’s (2021) multi-dimensional conceptualisation of health capital as the resources possessed by an individual that can affect their position in the social field of health. Health capital encompasses social, cultural, economic, and personal factors (Schneider-Kamp et al., 2023) that shape and are shaped by an individual’s health-related practices. The 12-CDT operationalises each of the key dimensions of health capital by two or more of the 12 health-related resources, which in turn are represented by 12 brief statements. Each of the 12 resource statements is connected to the concept of health capital through the overarching question of “How important are each of these to your health?”
The concept of health capital has been chosen as it provides a holistic perspective on the complex mechanisms by which social, cultural, economic, and personal resources separately and jointly impact health decision-making and - outcomes. Building an understanding of these complex, often subconscious, and at times even counterintuitive dynamics often requires nuanced qualitative data. This makes projective techniques and the concept of health capital a good fit for allowing qualitative health researchers to explore subconscious perceptions and dispositions toward health-related resources and, ultimately, how these act as barriers and facilitators of illness prevention interventions.
Practically, participants engage with the 12-CDT through a circle diagram that serves as the primary vehicle for conducting the drawing task. This large circle acts as a conceptual space in which individuals can indicate their level of self-rated importance for each of the 12 statements describing the associated health-related resources. Participants are asked to draw circles, where the area of each circle reflects the importance of the corresponding statement, i.e., the larger the circle they draw, the more significant the statement is to them and vice versa. The participants then mark the circle with the number of the statement, typically drawn inside the circle. This visually maps self-rated priorities and perceptions to health-related resources.
The 12 health-related aspects included in the 12-CDT drawing task are (in their English reference formulation): (1) Relationships with my friends (2) Relationships with my family members (3) Diseases in my family’s history (4) Communication with health care specialists (e.g., GP, nurses, doctors, etc.) (5) Government attention/support to the health care system (6) Availability of information about health and diseases (7) My educational background (8) Foreign languages I can understand (9) Access to digital technologies (e.g., smartphone, computer, fitness tracker) (10) Money for buying medicine and paying for health services (11) Money for purchasing healthy, high-quality foods (e.g., organic, ecological) (12) How well I can handle stress
Figures 1(a) and (b) showcase an as-of-yet unfilled circle diagram and a filled one, respectively. (a) The unfilled circle diagram; (b) A filled circle diagram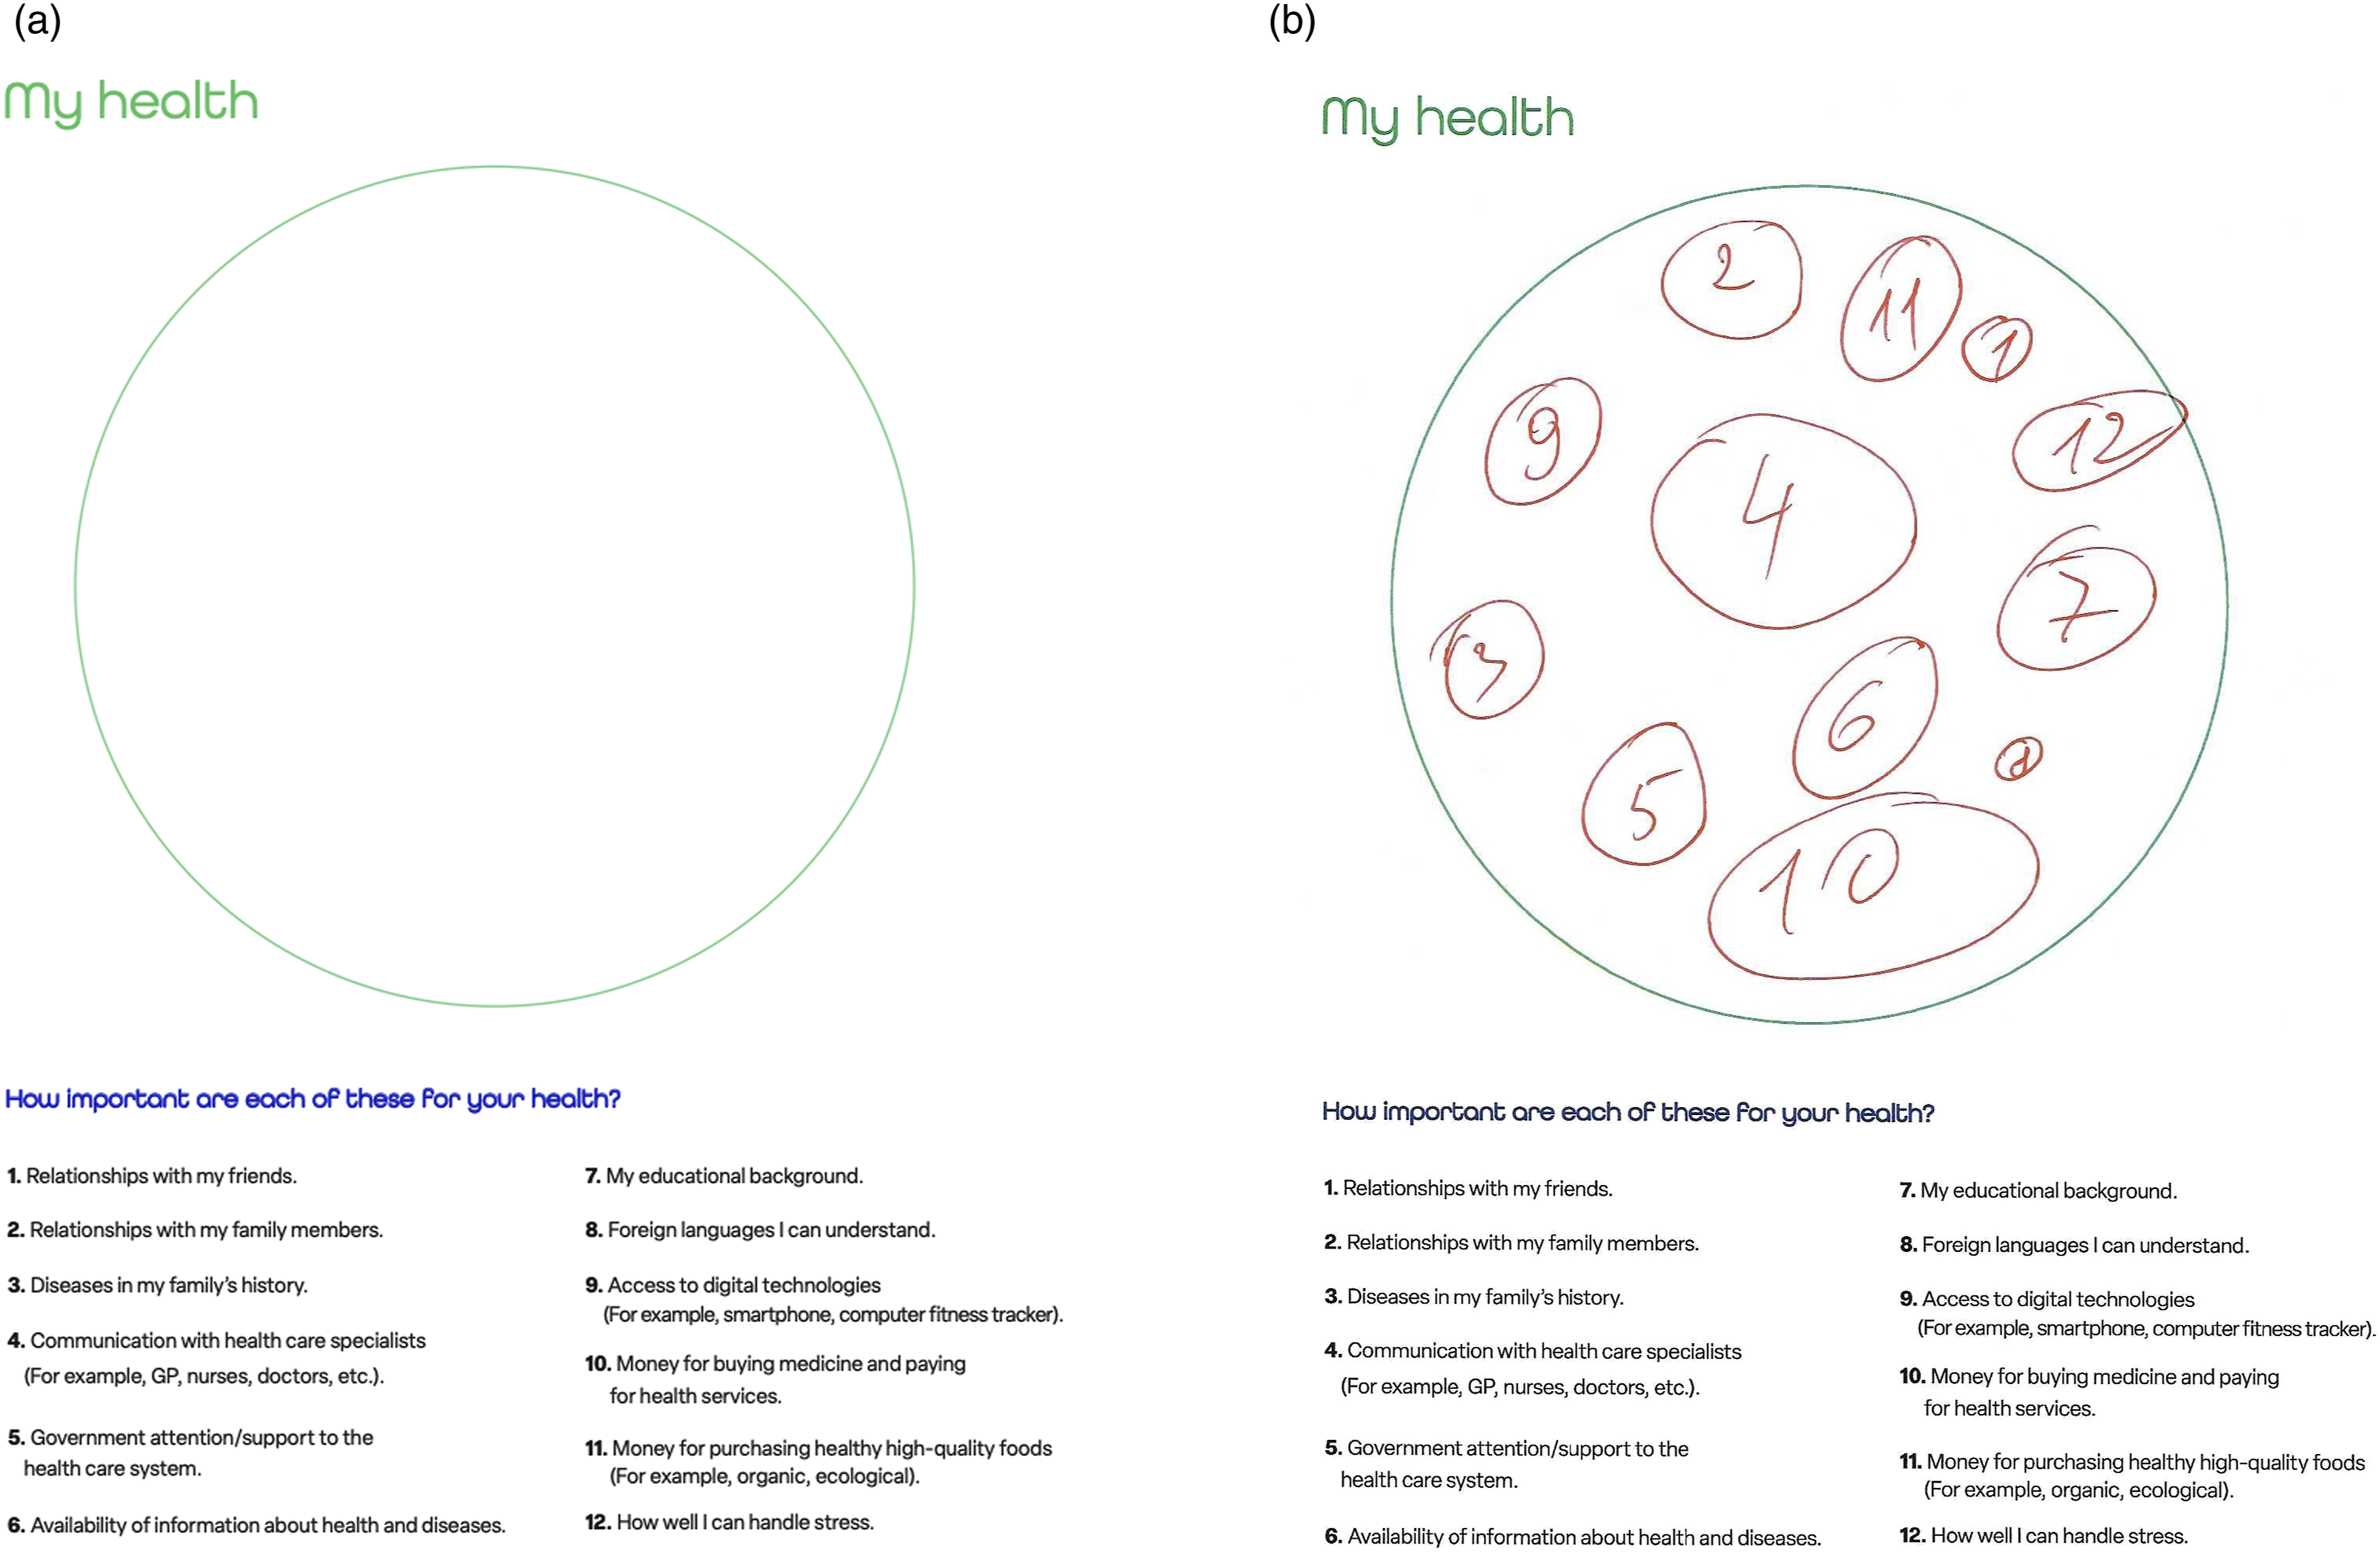
Participants filling the circle diagram are encouraged to interpret the circle and the statements in a manner that feels natural to them, allowing for intuitive and spontaneous responses. The circle diagram is preceded by a page of brief but clearly stated instructions. Through drawing the 12 circles, they visually express associations, relative importance, or emotional connections to each statement. In addition to areas, participants can use both absolute and relative locations as an expressive way of visualizing the self-rated importance of health-related resources. For instance, participants might use proximity to the centre of the circle to signify greater relevance or importance or create clusters to indicate interrelations among different statements. However, for this first instance of the 12-CDT we have chosen to focus on the relative areas of the circles – and thereby the ability to rank resources – as our main point of the analysis.
The data employed to develop and evaluate the method introduced in this article and to illustrate our method were fully de-identified and anonymised, voiding any requirement to report the data processing to the national data protection authority. Ethical clearance by the national committee for health research ethics was likewise not required, as we neither performed medical interventions nor collected biological material from human participants.
Manual Analysis
For the manual analysis, we choose a fully analogue analysis, i.e., we measure the areas of the circles using only our hands, a ruler, a pencil, and a semi-transparent overlay grid. For realistic results, it is important to recall that human-drawn circles are typically not perfectly round but only approximate a circle shape. Furthermore, sometimes they might overlap, be smaller than the number they are supposed to contain, or have more organic shapes than ideated for the 12-CDT. Figure 2(a) illustrates a common case of less-than-perfectly circle-shaped drawings, while Figure 2(b) demonstrates a case of heavily overlapping shapes. (a) Diagram with irregular shapes; (b) Diagram with overlapping shapes
To the best of our knowledge, there is currently no agreed-upon standardised method for manually measuring uneven or irregular geometrical shapes. Consequently, the approaches tested in this section should not be considered exhaustive but rather represent a collection of exploratory methods developed through the authors’ conceptual experimentation.
To start this manual experiment, we looked at different ways of measuring a shape supposed to represent a circle by hand. A perfect circle’s area A can be obtained from the radius r by the equation A = πr2. As explained above, this may not be a good fit for representing a hand-drawn shape that deviates significantly from that of a perfect circle. Therefore, we came up with 4 ways of measuring such shapes. Here, it is important to remember that for each participant, our focus is on the area relative to the other shapes drawn. Due to this focus, we may use methods that result in an accurate ranking of areas rather than a measurement of the absolute areas. • Average of radii We measure several distinct radii of each shape and calculate the average radius. Intuitively, this should give us a representative estimate of the area for shapes that are close enough to a perfect circle. Then, we calculate the area based on this average radius (cf. Figure 3(a)). The precision of this method depends on the number of radii measured. An improvement for highly irregular shapes is to use a form of polar integration, where the segments between two radii are approximated as pie slices. • Ellipse approximation We approximate the area of the shape using the ellipse area formula, as ellipses allow considering some (regular) divergence from perfect circularity. The area for an ellipse is A = πab with a and b being the longest and shortest diameter, respectively (cf. Figure 3(b)). As this method considers that the shape has different radii at different points, we assume it can be somewhat useful for the estimation of the area of irregular shapes. • Enclosing rectangle We enclose the shape within a bounding rectangle. We then measure two neighbouring sides of the rectangle and rank the shapes based on the area of the square obtained by multiplying the two measurements. As we compute the area of the enclosing rectangle (cf. Figure 3(c)) rather than that of the shape itself, this method should give good results as long as we may assume a linear relation between the area of the rectangle and the area of the shape. • Grid counting A grid overlay is used to measure the circle. First, we count the number of non-broken squares. Then, we estimate the collective number of broken squares that might make up a whole square (cf. Figure 3(d)). Adding these together gives us a squares-per-circle measurement that can be turned into an absolute measurement based on the area of each square. This might be considered more accessible than using a ruler as is done in the three other methods. (a) Average of radii approximation; (b) Ellipse approximation; (c) Enclosing rectangle; (d) Grid counting
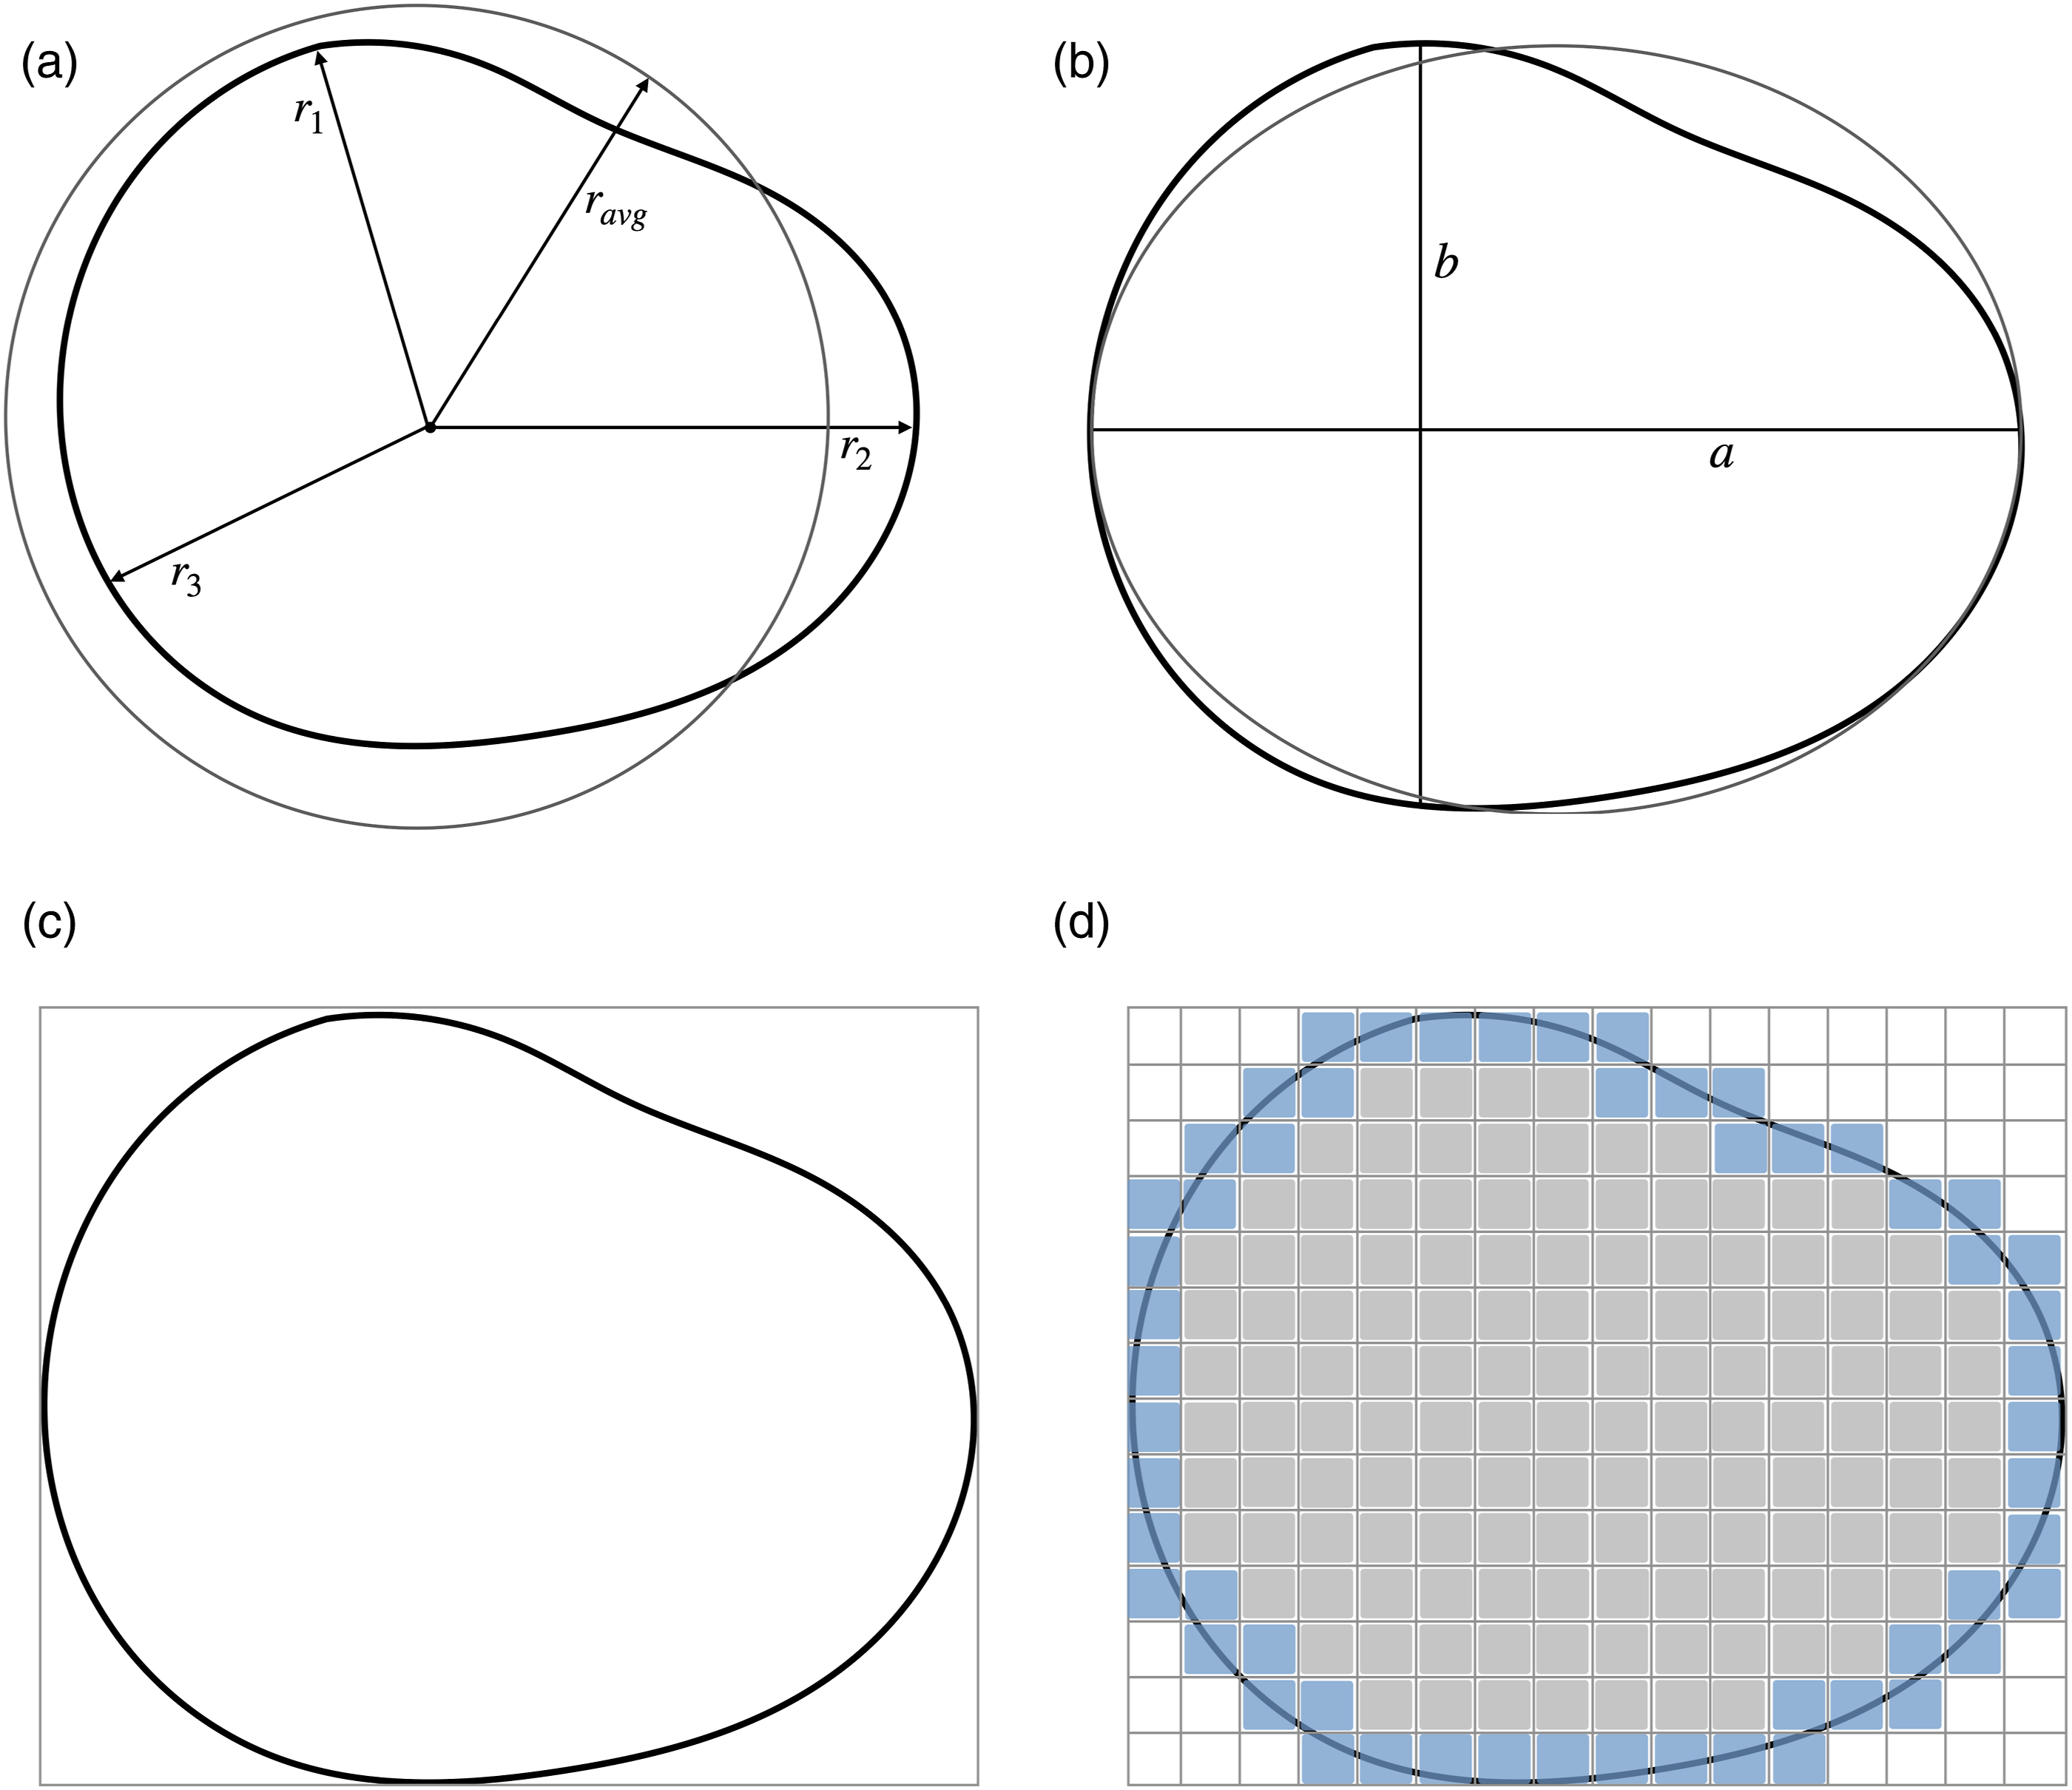
Figures 3(a)–(d) illustrate the four different manual measurement methods, including what is actually measured and which area is effectively computed from these measurements. Other methods could, of course, be devised. It is unlikely though, that these methods would give considerably different results in terms of accuracy and labour intensity.
Empirical Evaluation of the Manual Analysis
Initially, we attempted all four methods for measuring the hand-drawn “circles” on one representative circle diagram. We then evaluated not only which method was the fastest but also which one was the least labour-intensive. The dataset a person might have to analyse manually could easily comprise hundreds to thousands of filled circle diagrams from the 12-CDT, making efficiency a concern. The chosen method was then applied to a set of 10 filled circle diagrams so we can compare the manual to the AI-augmented analysis presented in the following section.
Since the rankings of the circles were almost identical across three of the four methods, none could be identified as the definitive approach for measurement. As we did not have a grading rubric for this, we continued with the assumption that when multiple methods give the same ranking, this ranking represents the closest we have to a true ranking and therefore our ground truth. The grid method was the only method displaying variability with some rankings split between two circles, making it less consistent and therefore unsuitable for further measurements.
Among the remaining three methods of equal ranking accuracy, we applied further exclusion criteria based on their time efficiency and labour intensity. Consequently, the Average of radii method was excluded as it involves several meticulous measurements while enclosing rectangle methods was excluded for relying heavily on estimation and drawing. For the final comparison with the AI-augmented analysis, the Ellipse approximation method was selected as the most appropriate method, given its balance of accuracy with speed and simplicity.
We proceeded with manual measurements of the circles using the Ellipse approximation method across another 10 projective techniques, which required just over 2 hours to complete. This corresponds to an average time of 11 minutes per filled circle diagram. The next step involved logging and sorting the collected data. This process posed additional challenges due to variations in individual handwriting precision and technique. Notably, distinguishing between the numbers 1 and 7, as well as 6, 8, and 9, was occasionally difficult even for human cognition. The number 8, for instance, was sometimes incomplete or not fully closed at either end, making it resemble a 6 or a 9. Although these discrepancies were minor and eventually resolved, they were nonetheless noticeably slowing down the measurement process.
Once all measurements and corresponding numbers were entered into a spreadsheet, where we organised the data by area. The intended output was a spreadsheet, ranking health-related resources based on the intended ranking of importance by the participants. To this end, it was necessary to rank each participant’s 12 circles in order of area. Surprisingly, this ranking process proved to be a lot more time-consuming than it was thought to be, taking over an hour to complete.
To summarise, the manual analysis consisting of measuring, logging, and ranking of the 10 projective techniques required just over 3 hours to complete. We finished this experiment with the impression that measuring the “circles” by hand, associating them to the related number, and ranking the health-related resources by size proved more work-intensive than we had initially anticipated.
Our experiment with a manual analysis reported in this article purposively avoided the use of computer- or tablet-based labelling software, where the area is computed from a contour of the shape drawn using a pointing device or finger movements. However, we did experiment with such computer-assisted labelling approaches, finding that consistent high-quality measurements required meticulous labour to approximate the contours of the roughly circle-shaped clusters and identify and associate the numbers. Thus, we would not expect significant efficiency gains from using labelling software for these first two phases of analysing the 12-CDT. The labelling software would, however, provide an efficiency gain through full automation of the third phase, i.e., through computer-aided ranking of health-related resources from recorded areas and numbers.
AI-Augmented Analysis
The idea of developing an AI analyser was born during our previous experimentation with labelling software, precisely from the experience that meticulously sketching the contours of shapes and identifying and entering numbers associated with the shapes still required significant time per image analysed and imposed a non-trivial cognitive load on the qualitative researchers.
The two qualitative health researchers among the authors consulted with the two AI experts among the authors regarding the feasibility of developing and integrating an AI system for the analysis of the 12-CDT such that area computation of the hand-drawn shapes and the labelling of the shapes with the related numbers could be automated to a large degree. The AI experts surveyed frontier AI foundation models for image segmentation pre-trained on large-scale diverse image datasets, determining that these provided a hitherto unprecedented opportunity to automate the generation of accurate contours for the shapes. They likewise identified several candidate models for optical character recognition (OCR) that might be able to aid in identifying and associating numbers to the circles.
The interdisciplinary team then engaged in a user-driven co-development process co-designing, implementing, and testing an AI analyser for the 12-CDT. Acknowledging that a 100% accurate, fully automated analyser for hand-drawn shapes and numbers is infeasible, considering that analysing and interpreting the finer and maybe unexpected nuances of the drawings might still require human involvement, we designed the AI analyser to deliver an AI-augmented analysis.
Here, AI augmentation refers to synergistically combining the strengths of the AI models with the cognitive and interpretive skills of the qualitative researchers. The design of the AI-augmented analysis comprises three phases: (1) Initial automated analysis In the first phase, the AI models perform an initial analysis fully automatically, aiming to accurately measure and label as many of the circles as possible. To identify the AI analyser employs image segmentation and optical character recognition (OCR) models for analysing the visual and textual elements. The next subsection provides further details on these models and their application. (2) Human-AI interaction In the second phase, the AI models and the qualitative researchers interact through the labelling software to review the analysis results and refine them, if needed. The labelling software displays the filled circle diagram, indicating the AI-generated contours of all the detected circles as editable overlays. The qualitative researcher can then visually review the contours and adjust them by moving them if deemed necessary. The results of the OCR models are available as labels associated with each of the circles and can be corrected by clicking the circle and typing the correct number. (3) Automated post-processing In the third and final phase, the (possibly refined) contours and numbers are automatically processed in order to generate a ranking of the health-related resources for each participant based on their circle diagram. This step requires neither AI nor human oversight.
In the following subsections, we first provide an overview of the technical components of the AI analyser, describe the analysis process and then evaluate the AI-augmented analysis empirically.
A Look Into the Engine Room
This subsection provides the technical background and details of the AI analysis needed for ensuring transparency and reproducibility. Readers not concerned with these implementation details may proceed to the next subsection on the AI-augmented analysis process without loss of continuity.
The AI analyser relies on AI models for the automation of two key processes: image segmentation and OCR for detecting contours within an image and for identifying digits in a part of the image, respectively. Figure 4 provides a schematic overview visualising the application of AI models during the initial automated analysis phase. Schematic overview of initial automated analysis phase
Image segmentation is the process of dividing an image into distinct parts to identify and isolate relevant features (Ma et al., 2020). We employ the Segment Anything model for instance segmentation (Kirillov et al., 2023), which is freely available under the permissible Apache 2 open-source license (Meta AI, 2023). The Segment Anything model builds upon the Vision Transformer architecture (Dosovitskiy et al., 2021). This model is, at the time of writing, on the top of the leaderboards for zero-shot instance segmentations (Papers with Code - LVIS v1.0 Val Benchmark (Zero-Shot Instance Segmentation), 2025). In the context of the AI analyser, we employ image segmentation to detect and separate individual shapes (instances) from the background, enabling subsequent separate computation of the shapes’ areas and OCR of the numbers contained. We used a regular grid of 576 seeding points to ensure sufficient coverage of the diagrams. Before sending the detected contour and the content of the shape for further analysis, we employ a number of pruning techniques, including insufficient size, excessive size, and subsumed by another shape pruning filters. We apply edge detection and contour analysis to accurately delineate each shape. This is particularly important when circles are overlapping, drawn with varying levels of precision, or placed near handwritten labels. A linear algebra-inspired overlap matrix analysis resolves ambiguous cases reliably.
OCR is the technology used to automatically identify and extract text comprising characters representing letters and digit images (Chandra et al., 2020). We employ a custom lightweight VGG16 (Simonyan & Zisserman, 2015) inspired convolutional neural network architecture (CifarXII) with 2.8 M parameters for OCR to predict numbers in the range 1-12 based on an image as input. We train on a set of 13,600 samples containing the inside of shapes identified in 12-CDTs and validate on a holdout set of 3,400 samples (80/20 split). The training data is sourced from the human-corrected predictions made by previous versions trained on fewer digits. We use a batch size of 32, a learning rate of 0.001, and a weight decay of 0.0001, respectively. All samples are reshaped to a size of 48 × 48 pixels and normalised with a mean and standard deviation of 0.5.
Jointly, segmentation and OCR allow the AI analyser to effectively process projective techniques data by identifying, measuring, and categorising the drawn elements while minimising the need for manual intervention. Figure 5(a)–(c) show the Human-AI interaction in real life, with the results of the initial automated analysis clearly visible. (a) The results of the initial automated analysis for the circle diagram cropped from Figure 1(b); (b) The results of the initial automated analysis for the circle diagram from Figure 2(a) to be refined; (c) The results of the initial automated analysis for the circle diagram from Figure 2(b) to be refined
The AI-Augmented Analysis Process
In this subsection, we expand on the three-phase design and describe all five phases of the actually implemented AI-augmented analysis process and methodology starting from the papers on which the participants have hand-drawn the circles to the final insights obtained. (1) In the pre-processing phase, first, every sheet is scanned with the help of an automatic document feeder, storing all diagrams from a cohort of participants and their papers in one directory. Then, a simple automation script crops the scanned diagrams by removing the parts of the page above and below the large circle that visualises the projective space. (2) The initial automated analysis phase starts by applying the segmentation model to predict any contours of shapes that participants might have drawn. Then, we prune the set of predicted contours, removing contours larger or smaller than a given threshold, and contours fully enclosed by others. This pruning effectively removes accidental marks, half-started circles, the large circle that represents the projective space, and circles that have been redrawn on top of themselves. We use the remaining contours to extract the parts of the image inside the circles and apply the OCR AI model to predict any digits present in these. (3) During the Human-AI interaction phase, the results from the automated analysis phase are presented as marked contours on top of shapes in the labelling software. The qualitative researchers review the contours, refine them where necessary, and review and correct the associated numbers. Furthermore, they visually inspect each drawing and may note down any observations and reflections in their analytic fieldnotes. (4) The automated post-processing then computes the area of each shape, infers their ranking, and then saves this information in a spreadsheet for each participant who has filled a circle diagram. (5) In the insight triangulation phase, the qualitative researchers triangulate the rankings of health-related resources with qualitative data from the analytic fieldnotes and any other data on the participants. In the context of a mixed methods study, the qualitative data might then be correlated with quantitative data from sources such as baseline and follow-up questionnaires, diagnostic results, or data on intervention success, ultimately aiming to discover how self-rated importance of health-related resources varies with, is impacted by, and impacts sociocultural and health diversity.
Empirical evaluation of the AI-augmented analysis
We initially evaluated our method on the same set of 10 filled circle diagrams that we evaluated our manual analysis on. This set includes some diagrams with very cramped writing, deformed circles, and other challenges. To ensure that we have a ground truth to operate from, these examples were reviewed by two of the authors and compared to the results from the manual methods.
We compare the results from the fully automated initial analysis following best practices from the evaluation of AI models in image processing. After detecting the shapes with the segmentation model, the resulting contours are uniquely matched with exactly one from the ground truth using bipartite matching. The cost function is defined as the negative pair-wise intersection over union between each pair of contours, which provides a descriptive numerical measure for how much two given shapes are overlapping. Subsequently, we compare the digits on the matched pairs of contours to obtain the accuracy, calculated by the percentage of correct hits.
We then extended our evaluation to a set of 111 circle diagrams in order to obtain a solid basis for a quantitative assessment of the performance of our approach. The average intersection over union of matched circles was 93.39% on the initial 10 diagrams and 94.17% on the extended set. This level of performance implies that finding the contours of the circles can effectively be automated, with human refinement only required for approx. 1 out of 15 shapes analysed. Furthermore, resolving these remaining 6-7% of the cases is highly efficient as the qualitative researchers can interactively control the AI model to correct or create the contours in real-time, bringing down the time per circle diagram to just under 1 minute.
Our OCR model displays an accuracy of predicting the digits 1-12 of 92.53% as validated on 3,400 circles. Thus, the custom lightweight AI model significantly outperforms larger general-purpose OCR models such as TrOCR and even vision language models such as Google’s Gemma-3 with 12 billion parameters, both of which struggle to reach overall accuracies of more than 50% on this particular problem. The custom OCR model effectively reduces the time required to annotate the circles by more than 90%, as the qualitative researchers only need to handle less than 1 out of 10 remaining digits and effectively transition from an annotator to a validator role.
The computation of areas and rankings is trivially automated and requires no human intervention. In total, the AI-augmented analysis took less than 11 minutes for the set of 10 circle diagrams collected through the 12-CDT, including both reviewing the AI-generated results and refining them.
Comparing Human and AI-Augmented Analysis
Fully aware that efficiency is only one of the dimensions, we are starting our comparison by extrapolating the impact of the AI-augmented analysis on time consumption for the qualitative researcher. As demonstrated in the results section, the manual measurement of all 10 samples in the test set required more than 3 hours. The use of labelling software could reduce this to approx. 2 hours. In comparison, the AI-augmented analysis took just under 11 minutes. Experiments with a set of 111 circle diagrams confirmed that the analysis of one circle diagram takes just over 1 minute on average as the whole batch took just under 2 hours.
In the ongoing CPW project, for which the 12-CDT originally was developed, 2,118 circle diagrams have been collected analysed. Extrapolating from the above numbers, handling this real-world data set would require nearly four months of full-time work, which might not even suffice as this would assume the ability to sustain effort over full working days. Using labelling software could reduce that to approx. 2 months and two weeks. This intensive workload presents a practical barrier that may discourage researchers from undertaking studies using projective methods at this or even larger scale.
In contrast, the AI-augmented analysis of the 2,118 circle diagrams was performed in six days of full-time work with enough time and cognitive surplus that the qualitative researcher also could devote attention to nuances not caught by the AI analyser. This reflexive freedom will be detailed at a later point in the article.
The initial automated analysis can be run in mere hours and would not hold back the qualitative researcher, as the first results would be available for human review and refinement after less than 15 seconds. The preparatory steps such as scanning and cropping would represent a negligible time investment of less than 1 hour and would be necessary also for manual analysis with labelling software. Figure 6 visualises the massive timesaving achievable through AI-augmented analysis. Estimated number of working days for analysing a large-scale dataset
The substantial timesaving comes from the replacement of the manual measurement process with an automated one. Manual measurements require not only time but also sustained cognitive focus, which can be mentally taxing and prone to fatigue-induced inconsistencies. The need for attentiveness and precision over extended periods also introduces the risk of reduced data quality due to human error or attentional drift.
Moreover, manual tracing of irregular shapes (such as hand-drawn circles or other shapes) not only is less precise than state-of-the-art AI models but also inevitably introduces a degree of subjectivity. Despite the qualitative researchers’ best efforts, variations in interpretation, measurement technique, and fatigue may influence outcomes. In contrast, the AI analyser applies consistent criteria and measurements across all samples, enhancing the objectivity of the analysis. While no measurement method is entirely free of interpretation – particularly in the context of human-drawn diagrams – the AI’s consistency introduces a more standardised basis for comparison, making the results more replicable and reliable across datasets and researchers.
Discussion
The AI-augmented analysis of projective techniques, where an AI analyser assists qualitative researchers by automating parts of the analytic and even simple interpretive tasks, has demonstrated the potential for integrating the objectivity of machines into the qualitative analysis process. The AI analyser eliminates the variability of the inherently subjective manual measurements of irregular shapes that involve a degree of estimation that may lead to inconsistencies and measurement errors (Catterall & Ibbotson, 2000). The potential to deliver consistent and reproducible results bridges the gap between qualitative and quantitative research, allowing researchers to quantify aspects of projective techniques without losing their interpretive depth.
The AI-augmented analysis of the 12-CDT may reveal aspects regarding the self-rated importance of health-related resources that would remain hidden in face-to-face interviews or direct questioning, as participants are not directly interacting with a researcher and, therefore, may express different priorities and connections between concepts, offering new insights into how they perceive and experience their health (Jura, 2017; Tuber, 2012). This opens important possibilities for understanding aspects of health that are less constrained by social desirability and similar dynamics of interpersonal interaction.
Projective techniques can provide rich, contextual data but are challenging to execute due to the resource requirements of manual measurements and analysis (Pich & Dean, 2015; Soley, 2010). As we demonstrated in the section on manual analysis, the resource requirements for manual analysis of the 12-CDT effectively limit the scale at which the phenomenon can be studied in practice. The substantial timesaving afforded by AI-augmented analysis enables larger and more diverse datasets to be analysed without prohibitively increasing the labour involved. This allows scaling qualitative methods to levels previously only accessible for survey studies operationalising qualitative concepts using quantifiable proxy variables.
For qualitative health research, AI-augmented analysis as an innovation opens new possibilities for comparative or longitudinal research, where temporal and demographic variations can be systematically studied at scale. This ameliorates the time constraints, geographic limitations, and high costs that often impact the usability of projective techniques (Gill et al., 2008; Opdenakker, 2006).
What is more, scaling projective techniques also allows employing them as a reflexive intervention. Projective techniques such as the 12-CDT can be performed individually and at the leisure of the participants, allowing for deeper reflection and self-driven empowered engagement with the tasks compared to methods based on direct questioning. In the case of the 12-CDT, it might be employed to enhance the individualized critical reflection on the importance of a variety of health-related resources among target populations.
Epistemological and Ethical Implications of Automating Qualitative Analysis
The shift from manual to AI-augmented analysis raises fundamental epistemological questions about what constitutes valid knowledge in qualitative research. While AI models excel at detecting patterns in visual data, identifying subtle regularities in shape, size, and spatial relationships that might escape human attention, they lack the contextual, embodied understanding that human researchers bring to interpretation. A qualitative researcher might recognise that a deliberately misshapen circle represents emotional turmoil or creative resistance, whereas an AI model trained on geometric precision may simply classify it as poorly drawn or anomalous. Conversely, AI analysis eliminates forms of bias that plague manual coding: the tendency to “see” patterns that confirm existing hypotheses, the gradual drift in coding criteria over weeks of analysis, or the unconscious privileging of data that fit neat theoretical categories.
This tension between pattern detection and interpretive depth is further complicated by the cultural situatedness of both AI training data and algorithmic assumptions. Models trained predominantly on datasets from WEIRD (Western, Educated, Industrialized, Rich, Democratic) populations (Henrich et al., 2010) carry implicit norms about visual communication, assumptions about what constitutes clarity, coherence, or meaningful spatial organization, that may not translate across cultural contexts. While qualitative researchers have long grappled with ethnocentric bias and the need for cultural reflexivity in interpretation (Smith, 1999), AI systems encode such biases at scale (Mihalcea et al., 2025) but struggle with the explicit contextual awareness that human researchers can cultivate (Ofosu-Asare, 2025). The apparent objectivity of algorithmic classification thus risks naturalizing culturally-specific conventions as universal standards.
However, this apparent objectivity masks deeper ethical concerns. AI models encode the biases present in their training data and design choices. They may therefore systematically misinterpret drawings from participants with culturally and professionally diverse backgrounds or non-normative cognitive styles not sufficiently represented in the training data. Furthermore, algorithmic consistency can become algorithmic rigidity: where human researchers might pause over an ambiguous diagram, seek clarification, or honour participant intent, AI analysis renders definitive judgments that may silence creative or marginal expressions. This raises questions of epistemic justice (Fricker, 2007): Whose ways of knowing and expressing are made visible or invisible by our analytical tools?
The ethical imperative, therefore, is not to choose between human or AI analysis, but to develop dedicated qualitative AI systems built from the ground up for interpretive research (Beltoft & Galke, 2025) that facilitate conversational engagement with qualitative data rather than mere automation of coding procedures (Hayes, 2025; Morgan, 2023) while remaining critically reflexive about what each approach reveals and conceals. As Cheah (2025) argues in the context of digital ethnography, such AI augmentation requires explicit ethical and methodological frameworks that foreground researcher agency and accountability. This entails implementing robust validation procedures, documenting disagreements between human and algorithmic interpretation, and maintaining human oversight to ensure that efficiency gains do not come at the cost of erasing the complexity and diversity of participant meaning-making.
Such systems ought to be created to extend the professional self (Schneider-Kamp & Godono, 2025) of the qualitative researcher, to augment rather than replace human reflexivity through iterative dialogue between researcher and AI (Hayes, 2025), ensuring that analytic rigour does not come at the expense of cultural and epistemic diversity.
Directions for Future Development
The AI-augmented analysis we presented in this article focuses on automating the measurement and ranking of circles, as these represent two time-consuming aspects of the analysis process. Future iterations of the AI analyser could further support analysis and interpretation by exploring the spatial and relational aspects of participant responses. The positioning of circles, their overlap, any redactions to them, and their adherence to the boundary of the projective space all might provide valuable insights into decision-making processes and interpretations of the task.
A positional analysis might consider the placement of circles within the designated projective space, which may reflect underlying cognitive or perceptual tendencies. Participants may cluster specific circles in specific locations, which could provide insight into how participants conceptualise the relationships between different health-related resources. Positional analysis can also visualize the reflective process of the participants, who might rank resources following certain patterns (cf. Figure 7(a)). (a) Ranking along a semi-circular pattern; (b) Intentionally overlapping circles; (c) Heavily redrawn circles; (d) Circles outside the projective space
An overlap analysis may likewise help to identify and interpret participants’ conceptualisation of the relationships between health-related resources. Participants who overlap circles could be signalling that they perceive certain health-related resources as conceptually or experientially closely related. However, this type of overlap may also arise unintentionally (cf. Figure 7(b)) due to space constraints or drawing habits and needs to be distinguished. Additional qualitative follow-ups could also help clarify participants’ reasoning for merging specific circles. Notably, we found that diagrams where the AI analyser missed circles or mis-detected their shapes due to overlaps were particularly interesting for the qualitative researcher to reflect upon. In this way, the limitations of the AI analyser guide the qualitative researcher to pay additional attention to divergent diagrams where additional qualitative insights are more likely to emerge.
A redaction analysis would be challenging, as redrawing or relabelling may reflect hesitation, reconsideration, or a deliberate attempt to correct initial estimations. Examining the frequency and location of redrawn circles (cf. Figure 7(c)) could provide insight into which health-related resources participants found most difficult to understand or quantify. Similarly, analysing the relabelling of some circles may disclose how participants change their ranking while working through the list of 12 resources or as the result of critical reflection.
A boundary adherence analysis would analyse and interpret whether participants respect the boundaries of the projective space. While some participants simply run out of space, others might place circles representing health-related resources they consider irrelevant outside the circle (cf. Figure 7(d)). Understanding why some participants adhere to the boundaries and others do not might also provide insights into task engagement levels. We have implemented boundary analysis by detecting the large circle and use this to allow researchers working with the analysis of the 12-CDT data to interpret circles drawn outside the projective space either on equal footing with circles inside or as irrelevant, i.e., of zero area.
Figures 7(a)–(d) show real-world examples of these interesting nuances in completing the 12-CDT drawing task that we discovered during the Human-AI interactive review and refinement process. In Figure 7(b), the overlaps seem to be employed intentionally to communicate connection rather than seemingly randomly as in Figure 2(b). The redrawn circles in Figure 7(c) are reminiscent of an iterative reflection process on the relative importance of the different health-related resources. Integrating positional, overlap, redaction, and boundary adherence analysis would provide a more nuanced understanding of how participants engage with projective techniques.
By expanding the AI analyser’s capabilities beyond circle area measurement, these additional dimensions of analysis could offer deeper insights into the cognitive and perceptual processes underlying participants’ engagement with the task and its conceptual space. This would advance projective methodology in qualitative health research, simultaneously increasing the objectivity and the depth of qualitative inquiry.
Methodological Vigilance
Balancing technological innovation with the depth and richness of qualitative inquiry requires ongoing reflection and adaptation. Despite the improvements in objectivity and efficiency, researchers must remain critically reflective regarding how AI shapes qualitative data analysis and interpretation. As extensively discussed in the case of qualitative data analysis software (Paulus & Marone, 2024), there is always a risk that contextual subtleties and essential nuances may be overlooked when reducing complex qualitative data to measurable components. This danger to interpretive depth is aggravated by the possibility that researchers may choose to accept AI-generated analysis results uncritically.
Case in point, for the first iteration of the AI analyser for the 12-CDT, we have chosen to focus only on the area of the circles and the implied ranking. This means that other interesting and relevant aspects such as the positioning and grouping of circles is not accounted. In the case of the 12-CDT, uncritical acceptance of AI-generated analysis results also might have direct ethical implications, as the effectiveness of OCR is known to vary and correlate with sociodemographic and cultural factors such as ethnic backgrounds and education levels (Maung et al., 2024). This might lead to systematic under- or misrepresentation in the analysis due to lower recognition accuracy. This form of technological exclusion may bias the dataset and subsequent interpretations, potentially reinforcing existing inequalities in research visibility and voice.
The automation of analysis through AI may inadvertently encourage a reductive treatment of data, transforming rich, meaning-laden narratives into flattened, overly quantifiable results. This shift can diminish opportunities for reflexivity – an essential component of qualitative research whereby researchers deepen their understanding through close, iterative engagement with the data.
Toward Reflective Freedom
However, when AI augments rather than replaces human analysis and interpretation, this might arguably provide them with more reflective freedom. The time freed by not having to perform manual measurements and annotate and process data can instead be used to study interesting nuances in-depth or to investigate a qualitative aspect in a larger cohort of participants. The review and refinement process at the core of the AI-augmented analysis process presented in this article provides a natural starting point for both kinds of engagement.
Beyond timesaving, the AI-augmented analysis changes the work of the qualitative researcher. The focus shifts from measuring and annotating to validating and refining. This decreases the cognitive burden of the researchers, enabling them to allocate more cognitive bandwidth to interpretation, critical reflection, and theory-building, i.e., elements of the research process that are central to qualitative inquiry.
This shift aligns with calls for enhanced reflexivity in qualitative research (Finlay, 2002), where researchers critically examine their own role in knowledge production. However, ‘reflective freedom’ extends beyond traditional reflexivity. While reflexivity focuses on the researcher’s awareness of their interpretive biases and positioning, reflective freedom concerns the capacity to engage more deeply with interpretive possibilities, to pursue unexpected patterns, question initial assumptions, and iterate between micro-level detail and macro-level patterns. In this sense, AI augmentation potentially redistributes interpretive authority (Mayer, 2009): the AI handles pattern recognition at scale, while the researcher retains authority over contextual meaning-making and theoretical integration. This division of labour requires a new form of reflexivity, one that critically examines not only the researcher’s perspective but also the human-AI analytical partnership itself.
The AI-augmented analysis also has the potential to add to the richness of the data and, therefore, interpretive depth, particularly by allowing qualitative researchers to interpret not only individual representations of a phenomenon but also the collective patterns that emerge at scale. Applied wisely, a method like the 12-CDT might bridge qualitative insights with quantifiable data from the AI-augmented analysis, thereby offering a deeper, more holistic view of the self-rated importance of health-related resources than a purely qualitative manual inquiry might afford.
We, therefore, encourage not to view the AI analyser as a replacement for human insight and the interpretive work that qualitative research demands but as an enabler of deeper and more comprehensive analysis. Instead of presenting as one more technology to learn, master and adapt to, the technology unintrusively extends the capacities of the qualitative health researcher (Schneider-Kamp & Godono, 2025).
Moving forward, qualitative health researchers should carefully consider the balance between efficiency and interpretive depth to ensure that technological advances remain a tool for deeper understanding rather than a constraint on it. Ultimately, it remains each researcher’s responsibility to critically evaluate and contextualise AI-generated analysis results.
Concluding Remarks
This article presents an AI-augmented method for analysing the data collected through a specific drawing-based projective technique, the 12-CDT for the self-rated importance of health-related resources. This analysis method addresses key limitations of conventional analysis methods such as the subjectivity, time intensity, and high cognitive load of manual measurement processes. When augmenting rather than replacing the qualitative researcher, this method can preserve and even improve the interpretive depth of projective techniques as a method of qualitative inquiry.
The efficiency gains of AI-augmented qualitative analysis open new avenues for longitudinal, cross-cultural, and multi-sited qualitative health research, as well as for tighter integration with quantitative analysis in mixed-methods contexts. Future work should investigate how AI-augmented analysis can be applied to other qualitative or mixed methods in a way that does not erode but rather encourages interpretive depth, contextual sensitivity, transparency, and critical reflection.
Footnotes
Acknowledgments
We are grateful to Dr. Tija Ragelienė for her contributions to the design and development of the 12 Circles Drawing Technique, used as the case study for this methodology paper, during her affiliation with the Cancer Prevention at Work project.
Ethical Considerations
The data employed to develop and evaluate the method introduced in this article and to illustrate our method were fully de-identified and anonymised, voiding any requirement to report the data processing to the Danish Data Protection Agency. Ethical clearance by the Danish National Committee on Health Research Ethics was likewise not required, as we neither performed medical interventions nor collected biological material from human participants.
Author Contributions
ASK designed and conceptualised the study, positioned it in relation to the extant research literature, and acted as the corresponding and senior author. SLB and JN jointly developed and experimented with the AI analyser. SLB, ASK, and JN wrote the initial and revised drafts. SA provided feedback on the initial and revised draft, and together with ASK provided supervision.
Funding
The authors disclosed receipt of the following financial support for the research, authorship, and/or publication of this article: This work was jointly supported by (a) the Danish Foundation Models project funded jointly by the Danish Ministry of Digital Affairs and the Danish Ministry of Higher Education and Science; and (b) the European Union Horizon Europe Research and Innovation Programme under the Cancer Prevention at Work (CPW) Project Grant Agreement No. 101104716.
Declaration of Conflicting Interests
None of the authors has declared any conflict of interest.