
Abstract
Visual data are everywhere. This article explores the ambiguous role of visual data in academia by reflecting on a series of photovoice studies conducted by the author over several years. While academia proposes to have an innovative mandate for exploring what is new, in fact, visual data have not yet been accepted as a viable form of research. Five studies will assist the reader in reflecting on this topic. It is clear that the power of the visual image permeates our contemporary culture, however, this article explores how visual data may better be integrated and utilized in research.
What Is Already Known?
Increasingly, authors have begun to explore how visual data may be collected and analyzed, how it can provide new information, and how this data can be situated in the context of qualitative research. This has been done predominantly in the context of those disciplines where visual data is seen to be acceptable - the fields of history, anthropology, film studies, geography, as examples. Some researchers have begun to write more prolifically about the use of visual information as an additional form of information, or in the context of photovoice.
What this Paper Adds?
Very little research can be found that discusses the current role of visual data in the broader context of academia, especially in disciplines where visual data may be newer or seen as an add-on. While the use of visual information has been increasing in the past five years in many fields, it's more formal acceptance as true data has largely been unexplored. Exploring and reflecting on the use of visual data as key to research in the broader context of academia is one contribution of this paper. Despite the proliferation of a visual world around us, academia has been slow to accept visual data as true data.
Visual images are ubiquitous in the lives and work of those who study and those who are studied. There is no lack of attention paid to the visuals in the worlds we study, merely a failure of perspective in the academy. (Banks & Zeitlyn, 2015, p. 166)
Introduction
This article explores the role of visual data in academia, using a series of studies conducted by the author over several years, as a way to problematize the role of visual data and its somewhat bumpy entry into the site of academia. While our world abounds with visual images and academia proposes to have an innovative mandate for exploring what is new, in fact visual data have not yet been accepted as a viable form of research. This article explores the intersections of this problem and reasons why visual data should be utilized more explicitly.
Presentation of the Research Question. Recently, I attended the exhibit at the Canadian Human Rights Museum of blind photographers (see Figure 1). It was powerful and vibrant in its message about how some blind people, photographers, see the world. I was challenged in this exhibit to “see” differently—to experience shape and color in a way unusual for myself as a sighted person—to consider the stories behind the pictures and to engage in touch and sensory seeing, which the exhibit so brilliantly set up. The exhibit stimulated ongoing questions for the viewer about how easily we depend on a construction of reality through vision, and thus, also ideas of normalcy. In the reality outside of academia, the visual world is in full and unnegotiable swing. It is a constant vibrant river of information.

Canadian museum for human rights sight unseen exhibit.
According to Lapenta (2011), there are 5 million pictures uploaded to Flicker a day, 2.5 billion to Facebook, and YouTube serves 2 billion videos a day to millions of viewers (see Figure 2). Why then is it that academia, whose history and mandate is about seeking evidence about the world we live in, has been so slow to accept visual data as research data? Lacan (1978) cautioned us to remember that the eye goes back as far as the species does. And Klinke (2014) has suggested that the word versus the image debate goes back thousands of years, and is in fact, nothing new. And yet, we practice research as if language is the only mode of communication—whereas, in visual epistemology for example, it is recognized that the image is another form of understanding and knowledge.

A range of online health images.
My own work is located in community health sciences in medicine, and I am interested in issues related to health and identity, with a focus on illness. We can look to the field of anthropology, geography, or history, which have long accepted the use of photography, film, and so on. We can include fields such as the medical sciences, where X-rays and ultrasounds as images are valued as clinical data, and anatomical diagrams are helpful well-recognized examples to which we owe credit for communicating critical information. Artists have also long depicted illness and how society has viewed it over the centuries (see Figure 3). We need only turn to Frida Kahlo on disability or Edvard Munch on anxiety. In all these examples, images are more than just another representation of an idea put into words, they do not follow the same logic as words, and they portray something new to our senses about understanding and knowledge. The contemporary visual virtual world now also illustrates copious examples of health and illness in our ever-increasing online experiences—in a Facebook post on diabetes, on the television about the impact of smoking, and in digital marketing on roadside billboards about cancer.
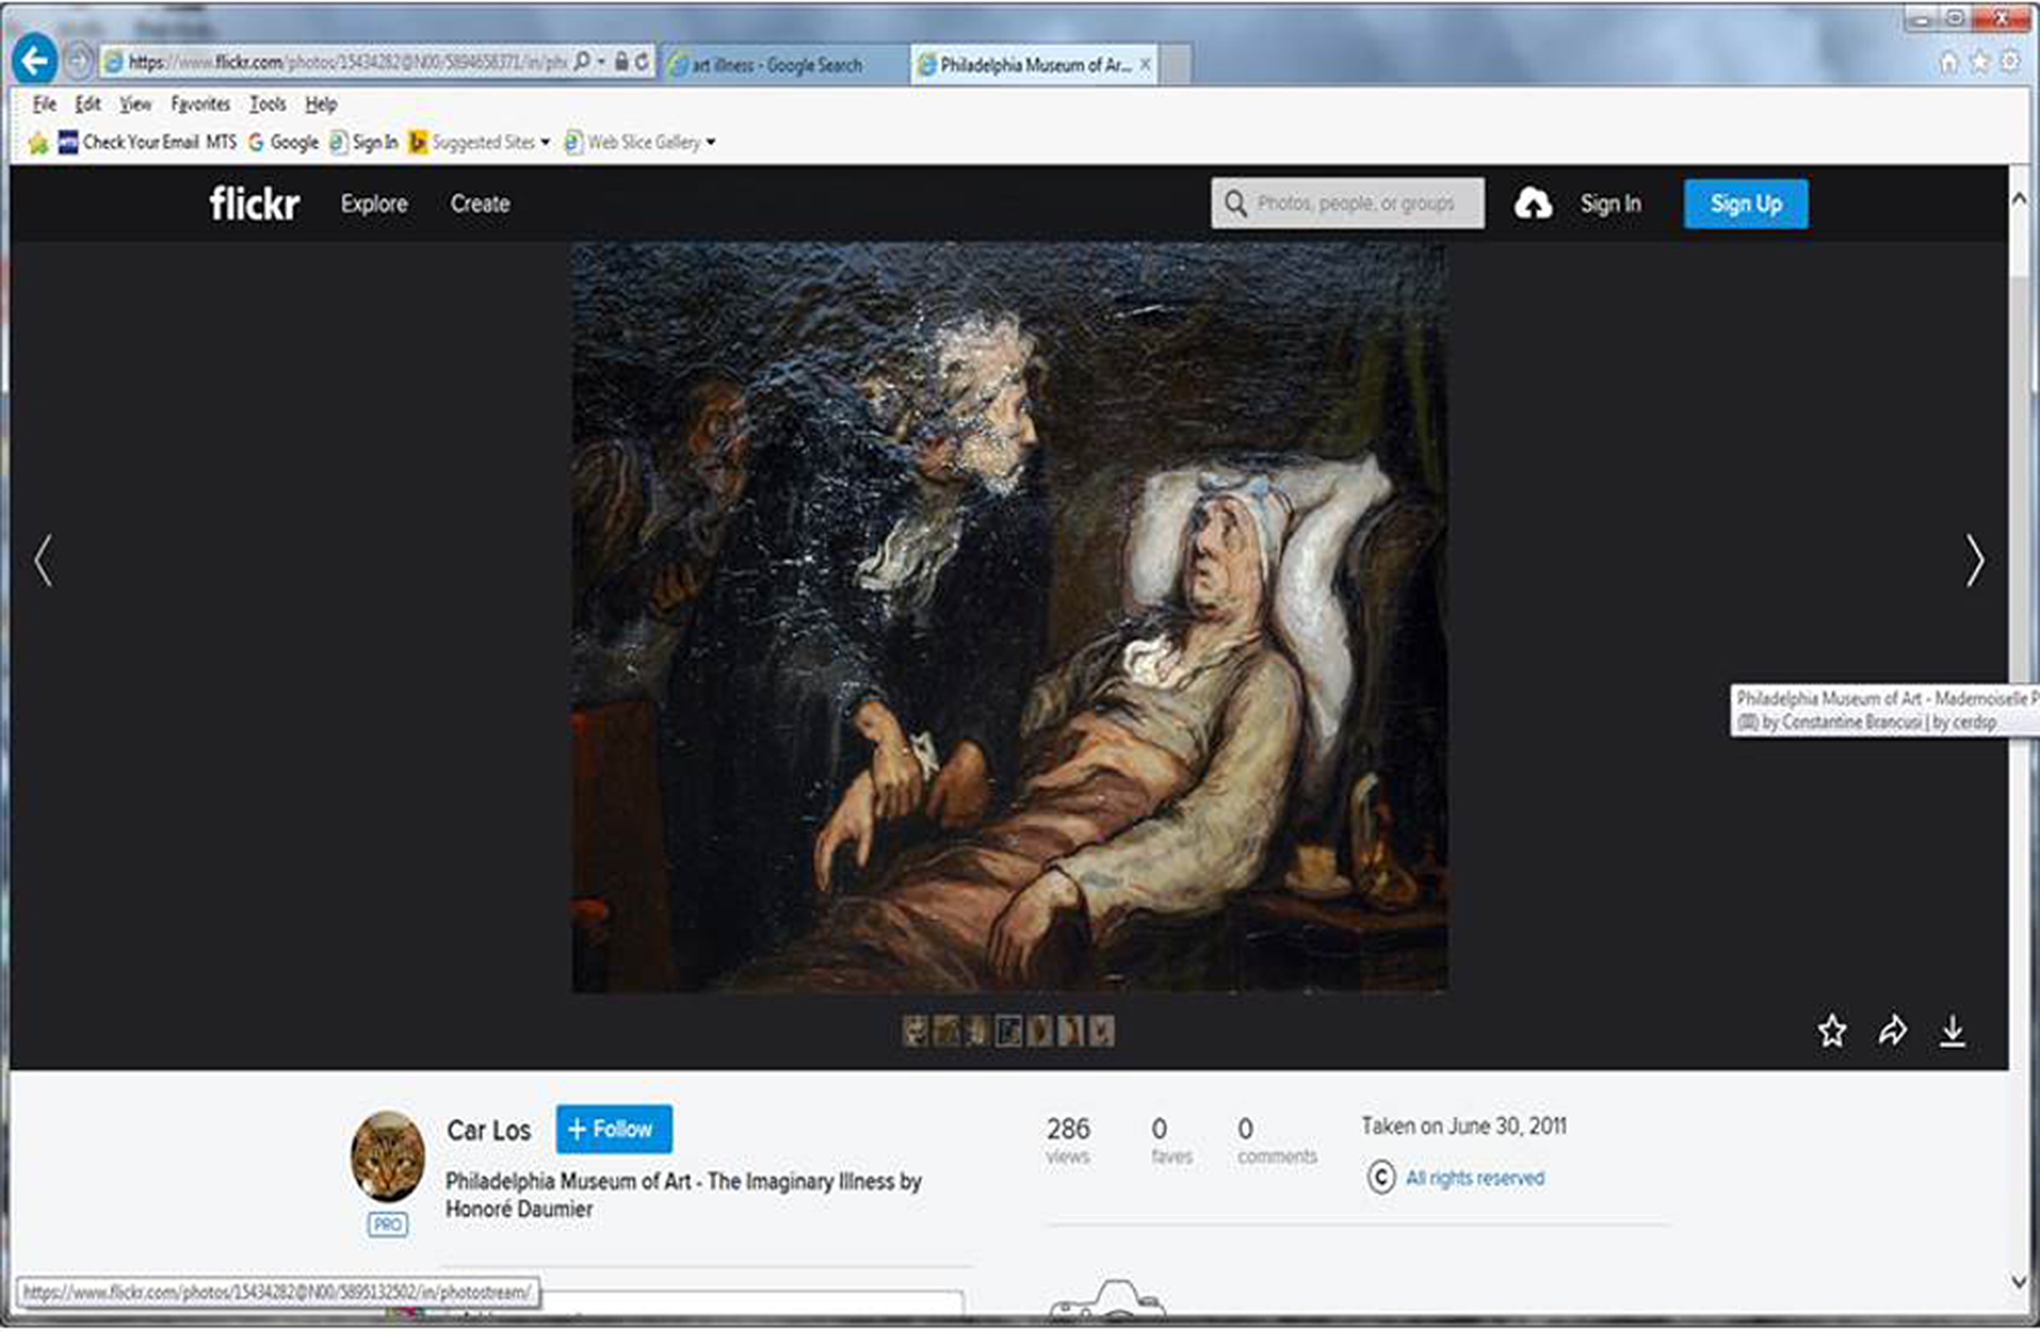
Daumier and the imaginary illness.
What are the challenges we encounter if we want to seriously integrate visual data as part of our research worlds, in a way that understands its importance in our daily lives, and values its place in producing real evidence, knowledge, and understanding of our world. In an interesting and unique clash of constant self-disclosures and open-ended revelations about the virtual and visual self, we have a particular avoidance of visual data as data in academia. And yet, “Oh I see!” has long been attached to knowledge and understanding. Who has not said the words “words cannot describe” or the infamous “a picture is worth a thousand words,” knowing that words cannot say it all?
New related fields are developing—digital storytelling, narrative medicine, and photovoice are being developed further—all visual epistemologies. I agree that the meaning and purpose of visual data in research may still need development, but I also believe that we haven’t thought enough about its value to research.
Landmarks in Literature on Visual Data
Cooley (1902) first suggested the term “looking glass” as a way to describe how we might see ourselves in others’ view of us—that our sense of self develops out of our interactions with others and their perceptions of us. This was said prior to the advent of modern virtual representations of the self but remains very true for today. In this sense, our whole society on Facebook has become like one big revolving looking glass. Goffman (1959) talked in a unique way about the “presentation of self,” in which he similarly asked us to review the importance of how people want to present their “self” to others. Despite the slow uptake of visual data in academia, good literature has evolved on the topic. We can find more historically discursive articles on how photos tell a story according to the much critiqued Mead (1928) and the more contemporary and lesser well-known Freund and Thomson (2011). We cannot forget the first examples of photo elicitation as provided to us by Collier in 1957 or photovoice as introduced to us by Wang and Burris (1997). As a form of community-based “participatory action research (PAR),” photovoice seeks to record and reflect strengths and concerns present in the community, to encourage communication and knowledge generation of community issues through a discussion of photographs, as well as mobilizing desired changes through partnerships with those who have the power to influence policy. Potential exists for application of visual data in grounded theory (Charmaz, 2014) also as well as other methodological approaches such as phenomenology or interpretive description.
Using photography has increasingly been made popular by others including Hurworth (2003) on the strength of photo elicitation or Han and Oliffe (2016) on their scoping review of photovoice and mental health research. Banks and Zeitlyn (2015) present a fantastic hands-on tool for beginners, discussing basic building blocks of using visual data. Margolis and Pauwels (2011) similarly give us a useful collection of articles for determining the path of research using visual data—from the origin and nature of visuals, to research focus and design, to format and purpose. For example, Pauwels in Chapter 1 discusses an important and wide range of issues that must be considered for the visual researcher—everything from what data have previously existed in your area, to necessary visual competencies of the researcher, and even how we might then present visual data suitably and what its status is in our final work. The literature in the area is certainly increasing and improving, but it is still seen as a fringe benefit to real research.
Methods
I have conducted five qualitative studies between 2011 and 2016 that have used photos in some capacity and as a central part of the study. I have also supervised research assistants and graduate students in using photography in some way in larger studies and in their own work. On this basis, I have reflected on the primary issues which shape this article, and I will present one core category and four themes that emerged related to the use of visual data in these studies.
My analysis of the emerging themes occurred over many years, and in discussion with colleagues and community participants, by keeping field notes and ongoing reading, by doing constant comparison of emerging ideas and data, and by analyzing narratives in my studies in a reflexive and sometimes autobiographical manner. I continued to engage in a constant comparison of my own research questions and the research and theories of those I read about. Since I also teach a qualitative graduate course, my ongoing interaction with graduate students has highlighted the great disparity that exists in their training as researchers who already embed their knowledge acquisition in visual experiences.
Findings
In analyzing the way in which visual data entered into the research I have conducted, the core category “engagement” emerged at all stages. Engagement here identifies an active relationship between the researchers and identified others—between the potential participant or stakeholder and the possible photo to be taken. Engagement also reflects an interaction which can be fruitful to the research endeavor in that it requires thought and action. One is engaged in an issue by thinking about it and by participating in it through a number of avenues in the example of being recruited and study participation. By finding the core category of engagement as representative of the place of visual data in my five photoelicited 1 studies, I note that visual data work well in the methodological context of PAR, certainly for grounded theory, or even phenomenology and interpretive description.
The value of visual data through engagement in my research can be broken down into several subthemes which I outline as recruitment, data collection, stakeholder and community access, and knowledge production. A fifth one emerges though, primarily as a low level of engagement, and one of the reasons I wanted to prepare this article. For this reason, I place funders, ethics committees, and colleagues into the discussion section of this article as a fifth low-level kind of engagement.
The reason I am embedding this discussion of engagement in an everyday research process, where I see the “everyday as problematic” (Smith, 1987), is because knowledge is created in every aspect of conducting our research. It is in the everyday practice of doing research step by step that we find or see new knowledge. In this way, I believe that the use of visual data starting with the beginning of our everyday research practices fundamentally shapes what we see along the way. As Banks (2007) has said, our visual experiences are mutually constitutive to our understanding of the world around us.
Engaging to Recruit
Attention needs to be paid to how potential participants experience the way in which we engage them in the potential use of photography, but this is true for research in general as well. The cohort can matter (older vs. younger participants may use different tools to collect visual images) the research question itself (is it a natural fit for the participant in the use of visual data?), the sociodemographic (do they have cameras? iPhones? expectations of themselves as photographers?), and overall methods of reaching out and discussing the use of photos matters. You need to know your participants so you do not have to try too many varieties to succeed.
People adverse to being part of research overall appear to love photos in order to move into the research space, they see their own photos as a way to participate, contribute, and be engaged in the research process in a way that they feel has value to them (Oliffe & Bottorff, 2007). Potential participants see in advance that photos may help them to tell their story to researchers—which otherwise sitting in a formal room with a tape recorder may not have achieved. Photos in my experience act as a favorable bridge in the recruitment of many kinds of participants: older rural men, indigenous women, and folks with chronic illness.
Engaging for Richer Data Collection
I have found that good probes are important when tending to the narrative in the photo. In this way, photos help us to make what is not seen or known more visible, but the narrative is still required. The value of the picture is that interviews can become richer, and more descriptive emotions and experiences otherwise forgotten can be made explicit in the story. The picture also shows something that words cannot always describe, and so such details can be tended to, or new emotions drawn out that deepen our understanding and knowledge. The photo as part of a publication can also speak for itself alongside the narrative (Wang & Burris, 1997).
Engaging the Stakeholder and Community
Engaging others is critical and associated with most visual data usage (e.g., PAR). Engaging the broader public (including government and leader stakeholders) with photos is very powerful (Catalini & Minkler, 2010), as is showing participants the compilation of their final photos and stories. A final exhibit can release pride and awareness of key issues and also show them that they are not alone. This can be an empowering result that can include family and friends—they are often a key presence in the lives of our participants and so this acknowledgment through a final exhibit can increase awareness, education, and decrease shame and stigma. They may not read an article, but they might go to a community-based photo exhibit.
New knowledge production can also occur at this stage if it is built in. People talk, provide insights, can relate to us as researchers, and provide feedback to stakeholders. This is tangible, exciting, and real. It is applied but not distinct from conceptualizing and knowledge formation.
Engaging in Knowledge Production
Visual data change how we engage with and see our worlds. As Banks (2007) has said, knowledge is mutually constitutive through all our senses, and here, I am focusing on seeing visual data as data that change our knowledge base and how we can theorize. The photo can act as a catalyst for reframing concepts and theories, and while I have worked with several researchers who value simply “reporting” on findings, I have also had the privilege of working with colleagues who are willing to step outside the box and begin to explore and expand on this field of visual epistemology.
Discussion
The fifth theme involves in engaging the funders, ethics committees, and leaders. As Bank and Zeitlyn have suggested in my introductory quote, academia needs to become more familiar with the use of visual data. Engagement of funders, ethics committees, and other stakeholders may have been my fifth theme, but it couldn’t fully be because this type of engagement is largely missing in many disciplines and examples of research. We can see from my analysis here that community, study participants, students, and even some colleagues are on board, but as embedded in the systematic application of research, photos are still seen as Derrida said, a “dangerous supplement.” Using visual data as opposed to the written word opens disciplines up to issues that seem to threaten their well-marked definitions of research and their familiar boundaries of the acceptable. We can look to excellent discussions to help us move forward. Ricouer (Sitvast & Abma, 2012) speaks to the process of mimesis, where the telling of a story can lead to change in how we understand it. Photos can act as a kind of conduit or metaphor, which in their telling can be used to deepen our understanding about a topic or experience.
In this burgeoning era of virtual worlds, we need to engage funders and ethics committees to consider the new world of visual data (who needs protecting and from whom), and how we might best reflect concerns of privacy and confidentiality, or data analysis. We need to explore the idea that perhaps ethics committees have begun to misinterpret their boundaries and act restrictively as guardians of “good” research, preventing innovative research from occurring (Van den Hoonard & Hamilton, 2016). We may need to hone our way of analyzing the photo for research. As a matter of education, my students love the use of photos—it is already a central and unnegotiable part of their worlds! Some communities of participants who are not necessarily acculturated to the world of academia love photography as a way to allow them to be part of research (e.g., older rural men, indigenous communities, and those with chronic illness).
Finally, it seems to me that as an institution of research, we should be more sophisticated in our integration and understanding of the use of visual data as a form of communicating knowledge (and I include myself in that venture). Our mistake in academia could be that we assume a binary model of knowledge/understanding = the written word. I believe we need to move to the next step and reflect and integrate visual data more deeply into our research practices and contexts (see Figure 4). As the philosopher of mathematics, Koerner (1960) and other philosophers of mathematics will tell you, it is troubling to place an absolute truth-value on words and numbers. Linguists agree. Art matters, visual images matter, and these can be utilized toward a serious form of data usage, rather than Derrida’s notion of the dangerous supplement as a fringe benefit to academia. As Banks (2007) states, “seeing and knowing are mutually constitutive—the former is not a passive medium for the latter, as the linguistic communication model would presume” (p. 40).

Visual data in the American Medical Association.
Footnotes
Declaration of Conflicting Interests
The author(s) declared no potential conflicts of interest with respect to the research, authorship, and/or publication of this article.
Funding
The author(s) received no financial support for the research, authorship, and/or publication of this article.