
Abstract
As noted by several authors, field research has a craft-like element that makes it difficult for researchers to textualize the process of analyzing data. However, discussing our practices in field research could lead to the emergence of a more critical and self-reflective craft. With this objective, the author discusses the process of interpreting qualitative data from a 5-year longitudinal study on management accounting change in an Asian multinational company. The paper also includes a discussion of the institutional theories underpinning this research, which are used in the explanation of the data. Hence, this article elucidates the journey of moving from the “tape,” or the data, to the final written text.
Keywords
Introduction
How do you analyze your data? This is a commonly asked question, especially among those who work within the positivistic paradigm. Not content with being questioned by my quantitatively biased colleagues, I also questioned my own sensemaking process: How do I establish the authenticity of the findings and the credibility of the accounts? How do I reconcile differing interpretations of the findings? Such questions usually crop up during data analyses, causing me to face a crisis of confidence. The doubts raised in my analysis of data subsequently led me to question the data generated from the field and also to reflect on my role in the research process. Further questions such as How do I know I am not seeing things that are not there? also arose when I tried to weave the explanations together. Has my role in the research process influenced the data generated? In other words, have I inadvertently encouraged the answers obtained as a result of my line of questioning? I doubted not only my interpretation and explanation of the research phenomenon but also the authenticity of the data I had generated from the research.
I have come to realize that answering or even thinking about such questions is helpful. It has made me more reflective in my research. The craft-like element of field research (Baxter & Chua, 1998; Denzin, 1995; Van Maanen, 1995) means that the success of the research depends largely on the skills of the researchers. Therein lie the strengths as well as the weaknesses of qualitative research (Patton, 1990). Nevertheless, in writing this paper, I hope to inquire into how I make sense of the data and subsequently evaluate my data analysis technique while bearing in mind that this will also assess my ability and skills as a qualitative researcher. More important, through textualizing the process that we go through as we move from our field data to the written text, we can develop more awareness and be more reflective in our research. This could eventually lead to the emergence of a critically constituted craft (Baxter & Chua, 1998) and, I hope, to a more reflective and confident researcher.
Data analysis is a process of reality construction whereby the researcher, the theory, and the method used in the research, together with the data derived from the research, are all interdependent and interrelated. As such, it is difficult to explain how data are analyzed without also explaining the context in which the analysis is done. Hence, I will explain how I have analyzed the data from my theoretically informed case study. The research phenomenon I selected for my doctoral research warranted a longitudinal study. Even after completing my doctoral research, I have continued investigating this phenomenon.
Prior to undertaking the research, I have lectured mostly in the area of financial management. My educational training has been in the field of management at the undergraduate level and accounting and finance at the postgraduate level. On reflection, I find it unsurprising that at the start of my doctoral research, I had an accounting-centric view; that is, I accepted the centrality of accounting and accounting information in organizations. Initially I was not conscious of how my values and assumptions would reflect on my research, especially in generating and analyzing the data. This is not unexpected as we are usually unaware of our biasedness and subjectivity.
The context of data analysis
The purpose of my research was to understand the process of management accounting change that occurs within a business organization. A longitudinal case study was conducted over a period of 5 years in an organization that was implementing a new accountability system. The first phase of the research was carried out during the year 1998, and the project continued through 2003. Interviews were conducted with organizational members at different levels, ranging from the vice president to the clerk, and from different divisions. Evidence from the interviews was reinforced by documentary evidence, observations, and informal conversations both inside and outside the organization. Various company briefings and training workshops were also attended.
This paper relates mainly to the data analysis during the first phase of the research, in which I focused on gaining an understanding of and explaining how and why resistance to change occurred in the organization and on illustrating the historical and contingent characteristics of such resistance. In the second phase of the research, the way in which the new system had become institutionalized or decoupled from organizational practices was examined. The research was theoretically informed by an institutionalist framework. The methodological and philosophical underpinnings of the framework had greatly influenced the way in which data were analyzed and interpreted. However, the explanation came from within the case and was not imposed from outside (Scapens, 1990).
The theoretical and methodological underpinnings of the research
Qualitative researchers, unlike their quantitative counterparts, do not intend to test hypotheses at the beginning of their research process. Theory is used not to obtain predictions but to gain understanding of a certain phenomenon. In my research I used a theoretical framework prior to entering the field as it helped to provide a focus during the fieldwork and also while I was analyzing the data. I was confident that the theoretical framework chosen was the most appropriate one to be used in the research. The epistemological and methodological underpinnings of the institutionalist framework were in line with the interpretive case study approach used in my research. However, I was concerned that the initial research perspective and conceptual framework used would limit what I saw while in the field and would subsequently constrain my analysis and interpretation of the data.
Thus, to ensure that I would be open and sensitive to other issues arising from the field, most of my interviews, especially the earlier rounds, were unstructured and were conducted based on themes of issues to be discussed. The interviews were carried out like a “guided conversation.” Because of the openness of the research method, the focus of the study shifted from its original focus of examining change in budgeting routines to the issue of the introduction of key performance indicators (KPIs). The research focus shifted because the key theme that was persistently brought up by almost all of the people interviewed in the organization was the introduction of new key performance indicators. Nevertheless, the new research focus still fit within the wider research aim of understanding the process of management accounting change.
Explanation of social reality, the cornerstone of an institutionalist method, is achieved not through the use of universal laws but through identifying the place of something in a pattern that characterizes the ongoing process and change (Wilber & Harrison, 1978). Because the social system is seen to be in a process of change, the emphasis in institutionalist inquiry is on finding changing relationships. Usually institutionalists start their investigation by observing current phenomena and developing hypotheses out of these observations (Atkinson & Oleson, 1996). The main objective of providing explanations has also encouraged the use of a holistic approach in an institutionalist inquiry. Understanding the context of a particular event is important as the character of any given part is largely conditioned by the whole and by its particular function and location in the larger system. This means that we can provide explanations only if we understand the place of something in relation to its whole (Wilber & Harrison, 1978).
An institutionalist analysis also entails a processual approach (i.e., examining the historical context of a phenomenon to gain a deeper understanding of the present situation). The historical and contingent factors should be brought together in a holistic approach. Explanation is not reduced to one particular set of factors; instead, all the relevant factors need to be woven together (Dugger & Sherman, 1994). The analysis needs to be undertaken within the historical context in which the institutions emerge, and with due consideration to the forces that shape them over time. Therefore, the most critical issue in institutionalist inquiry is to understand the framework in which something happens (Atkinson & Oleson, 1996).
A pattern model of explanations, the institutionalist's “theory” of analyzing and making sense of data, is appropriate for interpretive research as it fits the holistic approach to knowledge (Wilber & Harrison, 1978). Johnson (1996) has explained pattern modeling as
an attempt to explain something by fitting it into a set of elements so that a unified whole is produced. Explanation consists largely of discovering relations that exist within an organized entity, and a well-founded explanation implies that everything “falls into place.” (pp. 3–4)
Before we can develop the pattern model, we need to organize all the information obtained from the fieldwork. To obtain a focus on the critical and strategic factors controlling a situation, analysts need to look for similarities and differences (Atkinson & Oleson, 1996). They need to search for emerging patterns; that is, the recurrent themes or repeated relationships between the properties and dimensions of the category, especially the significant key events or linkages between the various events. The data need to be interpreted and aggregated until something can be said about them as a class. The classes of things will be linked to one another until a key pattern emerges. Tentative hypotheses can then be formulated. A pattern model can then be constructed by linking validated hypotheses or themes in a network of patterns. Hence, the researcher needs to look for themes that express themselves throughout the system as a network of interrelations and describe these connections in a pattern (Wilber & Harrison, 1978).
The explanation can be considered as the “correct” one as the pattern becomes more complex and detailed, and a greater variety of evidence easily falls into place and new evidence can be fitted into that pattern (Wilber & Harrison, 1978). At this point it is difficult to imagine an alternative pattern or explanation that manages to include the same themes. In the next section I will explain the “practice” of data analysis; that is, how I used pattern modeling to make sense of the data and subsequently obtain understanding and an explanation of the phenomenon under study.
The practice of data analysis
I tried to follow the same institutionalist method discussed in the previous section of this paper to analyze my data. However, the pattern modeling technique provided only a rough guideline on how to analyze the data and derive interpretation from it. I also gleaned information from various textbooks and articles that discussed data analysis techniques in qualitative research (Coffey & Atkinson, 1996; Flick, 1998; Miles & Huberman, 1984; Silverman, 2001). However, the craft-like elements of qualitative data analysis ensured that even following the guidelines or suggestions by the various authors would not guarantee a good analysis of the data. It was not surprising, therefore, that I sometimes approached data analysis with much trepidation and anxiety, unsure whether the “product” of the various “recipes” would be up to standard as I also had to grapple with the fact that the analysis of the data was an ongoing process and that there was no clear-cut beginning and ending period.
Preliminary analysis during the fieldwork
Data analysis is an ongoing process; it starts during the fieldwork and continues throughout the research endeavor. Before interviewing began, I reviewed various publicly available company documents. Tentative impressions were developed during this stage. These tentative impressions and hypotheses were triangulated with other evidence derived from subsequent visits and also through subsequent interviews. Hence, the hypothesizing and analyzing of the case were carried out throughout the data collection process. Tentative themes and issues were developed during the research process and served as entry points for further hypothesizing during the subsequent stage of data collection. Hence, I was sensitized to the recurrent themes even during the data collection stage. In addition, being in situ facilitated data analysis as various interactions among the organizational members could be observed directly and the atmosphere of the organization and impressions made could also be gleaned and recorded. The informal conversations and observations helped in the analysis of the data as much as the formal conversations of the interviews did.
Analysis after the fieldwork: Finding the key themes and the plot of the story
The data were more thoroughly analyzed after the fieldwork had been completed. My being away from the field provided distance, independence, and the time to reflect on what was observed during the fieldwork. Because of the length of time I was in the organization, I found that toward the end of the fieldwork, I had become socialized into the organization. It was difficult to be a “professional stranger” (Agar, 1996), to find strangeness in the mundane, as the strange had become familiar.
I personally transcribed and retranscribed all the interviews both during and after the fieldwork. During the transcribing process, the interviews were reviewed again and again. Even though the transcription process took a long time, the ways in which the interviewees said things were replayed a number of times to allow me to listen again to the intonation, the pauses, and the context of the unfinished sentences; that is, the unspoken words. The data were printed out with a wide left margin, in which I could jot down the issues and topics that emerged from the interviews.
As this was a theoretically informed case study research, conscious effort was made to ensure that the research was not blind to the other issues arising from the field. As such, the interviews during the early stages of the fieldwork were conducted in a loosely structured form. Therefore, the first step in the data analysis was to find the key issues that were discussed or brought up during the interviews. I read the transcribed data many times to elicit the overall context and the types of issues and major themes that arose. This was done even though I was already sensitized to the key recurrent themes during the interviews because it would provide the context for the emergence of specific meanings and themes later on.
After gaining the sense of the whole context of the case, I reviewed the individual interviews one at a time and separated the specific issues that arose from each interview. In most cases, annotations were made on the transcripts regarding the issues that were discussed. This was done for each interview. The next process was to find the differences and also the similarities between the interviews. First, I identified the general themes common to the interviews. Then the similar themes from individual interviews were clustered to indicate the general issues that emerged from most of them. The key differences (i.e., the different issues that arose between the interviews) were also noted. All the common themes were placed in the context in which they emerged. Then the whole interviews were read again in view of the context of the case. The individual interviews were reviewed again so that I could read the data within the meaning of the overall context.
Hence, I read the data mostly with a view to their literal and interpretive sense; that is, I read the transcribed data to examine what was actually said, the context in which it was said, and what they might mean in the wider scheme of things. I also wanted to elicit the meanings of the pauses and what was left unsaid. Such reading of the data was to ensure that I did not take what was said out of context. I had jotted down my views about the whole interview process and also my impressions about the key informants during the interviews. These notes had been an important source of information, and they were valuable in the grounding of the data.
After that, a very detailed description of the key themes that arose from the fieldwork was written. At this stage the main purpose was to document all the issues that were gained from the fieldwork. There was no attempt made to find the connection or relationship between the various key themes that emerged from the study. These detailed descriptions of the key themes that emerged from the research are like a source document that I often revisited during my analysis and writing of the findings. The next step in my analysis was to tie these key themes together. I needed to find the central issue that would bind all these main themes; that is, I had to find the key plot of the story.
The plot of the story
As mentioned, the initial objective of the research was to understand the process of management accounting change with the focus on change in the budgeting process. However, during the fieldwork the issue of key performance indicators (KPIs) was brought up by almost all respondents. The focus of the research was therefore shifted and refined. As a result, the objective of the research now focused on providing an explanation for the new system of KPIs. The resistance to the KPIs was now deemed to be the plot of the story; that is, the central issue that would connect all key themes. In line with the theoretical and methodological underpinnings of the research, I now needed to understand the contingent characteristics of that resistance before I could explain the process of change.
Consequently, some of the research questions were developed and reformulated during the fieldwork and were further refined after the data collection stage. The questions formulated during the first phase of the research had the underlying objective of finding out the ways of thinking and the shared assumptions in the company (i.e., its institutions). As Mason (1996) has said, “Qualitative approaches usually entail formulating questions to be explored and developed in the research process rather than hypotheses to be tested by or against empirical research” (p. 15).
Diagramming/visualizing the data
After I had written up the descriptions of the case and decided on the plot of the story, the subsequent step was to explain the resistance to change. At first I wrote the themes in a narrative and chronological form. For example, I wrote about the introduction of the system, the reactions to it, and so on. The research questions were again revisited and further refined. Then the issues were organized around the research questions and the theoretical framework. All the questions had the underlying objectives of finding ways of thinking and the shared assumptions in the company. Knowledge of the ways of thinking and doing things in the organization can explain the reasons for resistance to change.
However, when I attempted to write up the findings, I found it very difficult to write “holistically”; that is, to tie the key themes together. This is because writing is a linear activity, with one idea or sentence following another (Scapens, 2004), even though the data might be all jumbled up in our minds. Rather than having the data muddled up in my mind, I embarked on the process of drawing a thematic diagram as a tool to assist in my analytical thinking. The use of a diagram provides a way of visualizing the data and helped in the writing up of the case. More important, besides being used as a way of understanding and integrating the data, the construction of the diagram forced me to look at the data in a holistic way. To draw the diagram, I needed to categorize the data. This is crucial as the diagram could be used to link the various categories, themes, issues, and topics that arose from the case and from which we could construct an explanation that wove all the factors together.
Creating and linking the categories
In constructing the diagram, I consciously sorted the data into categories of issues and themes, and there was a conscious effort at this stage to link the various themes and topics together. As Coffey and Atkinson (1996) wrote, “Starting to create categories is a way of beginning to read and think about the data in a systematic and organized way” (p. 32). Some of these categories were derived from the theoretical framework. The analytical concepts discussed in the framework were useful when thinking about and categorizing the data and finally when attempting to develop an explanation for the case. It should be noted that some initial categorization of the data had already been done during the early phase of the analysis.
A lot of reflective thinking was needed in the process of constructing the diagram. One of the advantages of developing the diagram was that it revealed the gaps in our learning (Millen, 2000). Consequently, I had to review the data several times to obtain additional input. As additional networks of issues and categories were developed, I had to look for the relationships between them. To illustrate, during the early stage of the data analysis, I had ascertained that budgets were used in the organization in a ceremonial manner. At this stage I had to think of the reasons why budgets were used in that way. As a result of this self-questioning, further categories were developed from the data as I continued along the process of constructing the diagram. It is the answers to these questions, the reasons behind these new factors, that led to the development of additional categories and linkages to the other factors. It should be noted that all the factors emerged from the data and were not imposed from outside. To ascertain the reasons that reinforced the categorization of the data and also to find the instances that might contradict them, I read, reviewed, and swept through the transcripts and documentary evidences several times. This was undertaken to ensure that the key similarities and differences in the data were not glossed over and also to increase confidence in my analysis. From this process further linkages were developed between the data, as illustrated in Figure 2.

The plot of the story

Creating and linking categories in a diagram
The whole diagram was completed when no other categories could be created and new evidence fell into place within the diagram. The final diagram is illustrated in Figure 3.
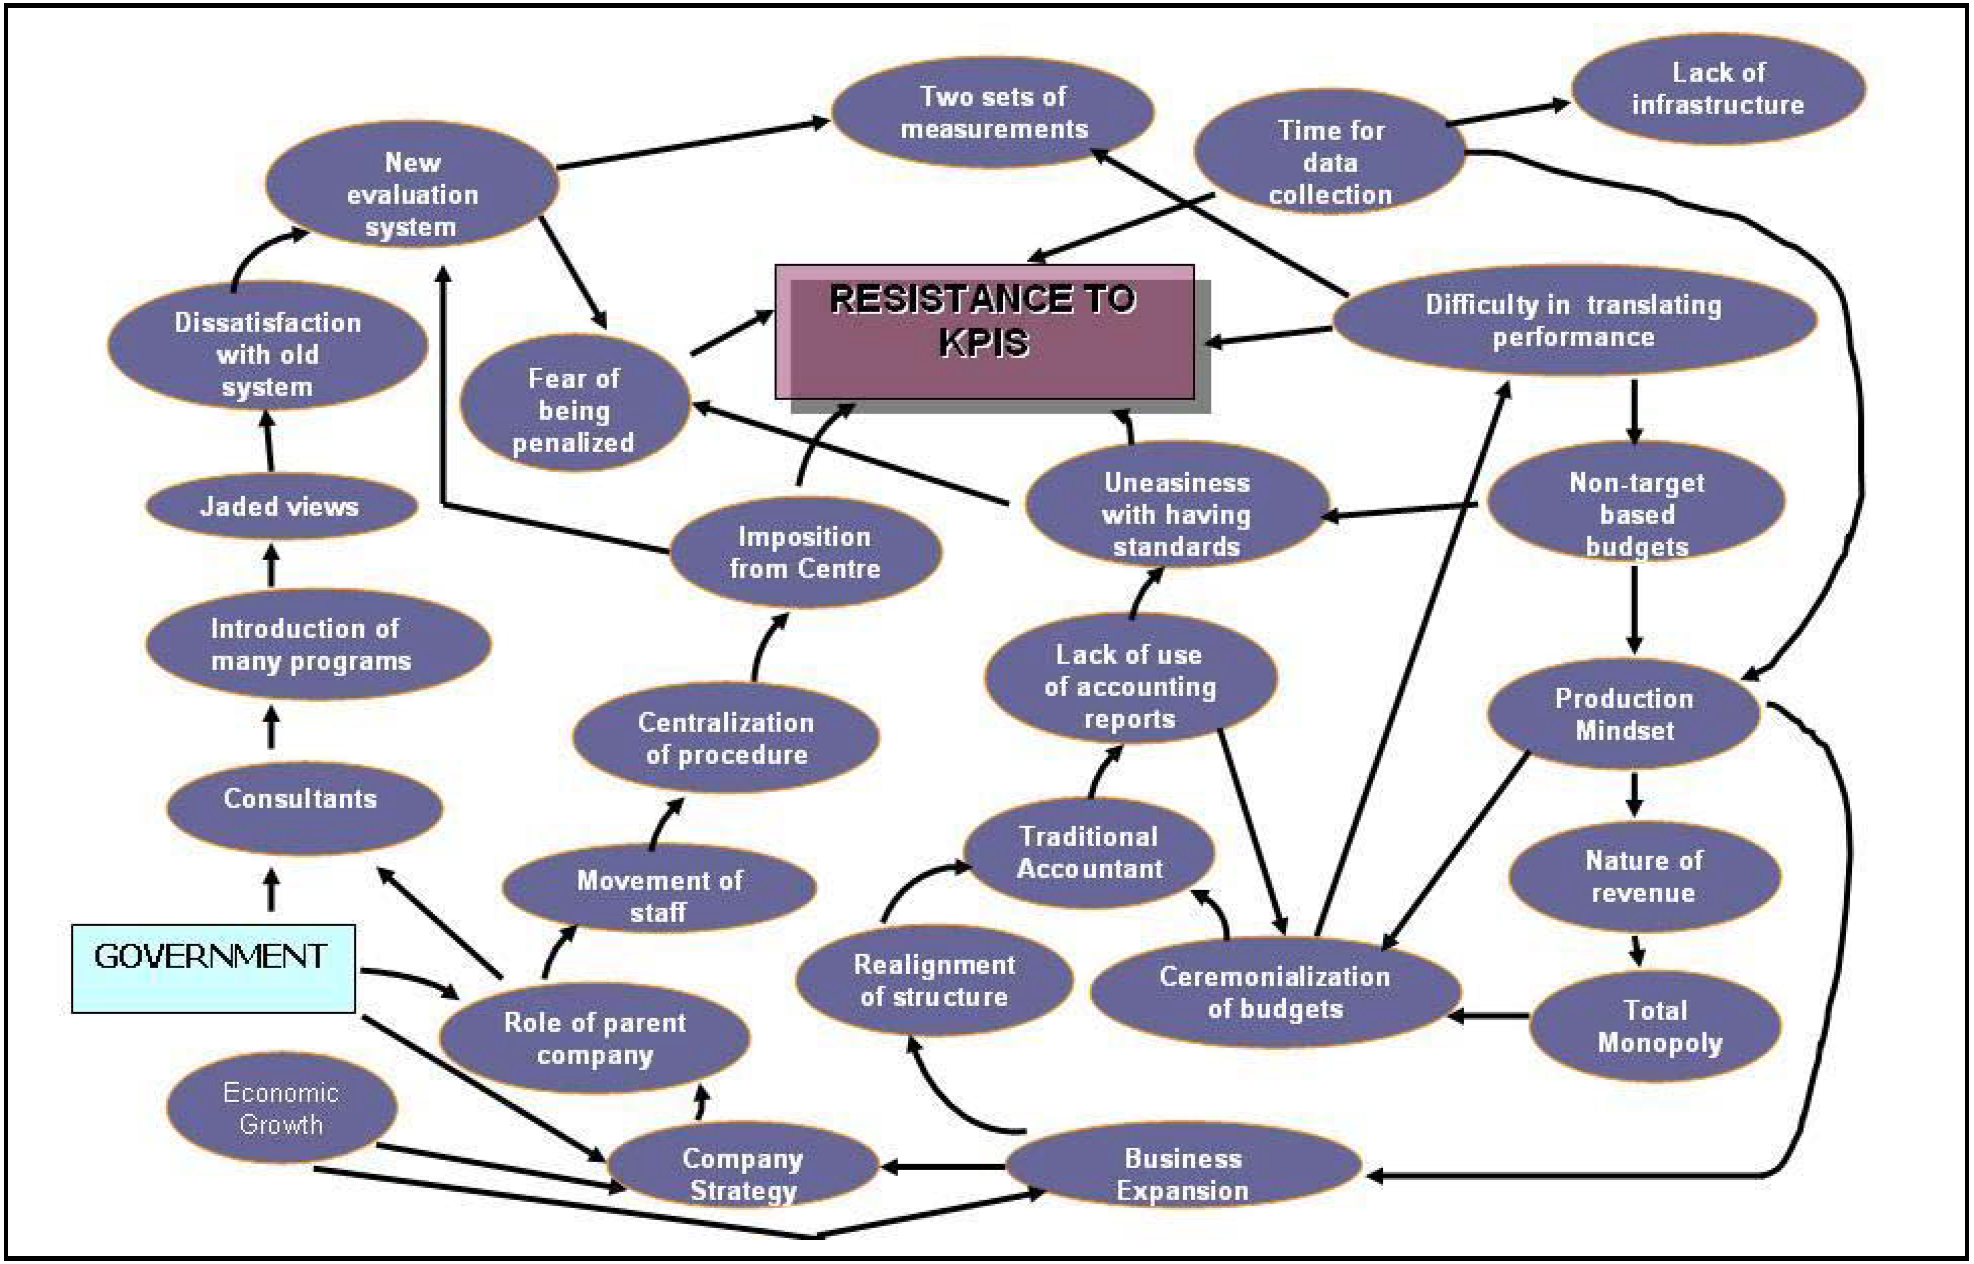
Final diagram of analysis for the first phase of the research
The visual output of the findings had made the process of writing up the research easier. After the diagram had been fully constructed, I wrote up what was happening without putting in the “theories.” At this point I formulated possible reasons and explanations for the resistance to change. Then the case was described and explained in terms of the patterns suggested by the diagram. I also used concepts from another theory to explain when the selected theoretical framework was insufficient in explaining the phenomenon. The explanation was considered complete when all the evidence fit into the pattern (Wilber & Harrison, 1978); that is, any new insights could be explained easily. Thus, the data, the theoretical framework, and the research questions were all used in explaining the case.
It should be noted that during the process of constructing the diagram and subsequent interpretation and explanation of the findings, I was besieged by self-doubts and a crisis of confidence. In addition, it created doubts about the data generated from the research. Did I make up the data? Did I see things that are not there? Is the explanation grounded in the case? Is the explanation just a rehash of the theory? Is my explanation appropriate, and does it encompass all of the data together in all of their complexity and contradictions? Most important, have I provided the best possible explanation of the data? How I gained confidence that my explanation is plausible and convincing, and, most crucially, did justice to the data and to the organization is discussed in the next section.
Enhancing confidence in the analysis and the explanation of the data
A researcher who has confidence in his or her analysis will be able to write the findings more convincingly and thus be able to convince others about the credibility of her interpretation of the research phenomenon. However, in the process of developing explanations, I fluctuated between certainty and confidence in the analysis and doubts and uncertainties about my interpretation of the case. For example, the process of constructing the diagram increased my confidence, especially when I could automatically find instances that supported the categorization of the data or knew the reasons and rationales behind the factors. At the same time, it led to a crisis of confidence, particularly when there was a gap in my learning. As a result, I swept through the data to get additional input. There were some issues that initially I had not thought of as important in the analysis but now, on further reflection, had to be looked at again in view of the evolving analysis.
The crisis of confidence also pushed me to reflect on the inherent biases or values that I had brought into the research and on the role of the theoretical framework in developing the explanation. As mentioned earlier, even though I went to the field to examine the role of accountants and accounting practices in the organization, I had not realized that I had an accounting-centric view. I was not aware at the beginning of the research of my biasedness and its potential impact on the research. What is the impact of an accounting person interviewing a non-accounting person on the use and practices of accounting? Only when I was carrying out the interviews did I realize that I was seen, especially by the non-accounting members of the case organization, as a person with an accounting-centric view. Even the title of my research reflected the accounting slant of the study. Furthermore, I was based in the accounting department/division during my stay at the case organization. Initially the respondents without accounting backgrounds, I suspected, were uncomfortable during the interviews.
Realization of my underlying views and biases led me to continuously question my generation and analysis of data. My role and stance as a learner in the field had help tremendously in obtaining the confidence of the respondents. Nevertheless, it is impossible to have a value-free position. Besides, all research starts with a specific stance and view toward the research phenomenon. As such, the data have to be read reflectively in view of our role in the research process not only in explaining but also in generating the data. What kinds of questions were asked in generating the answers given? Had I encouraged or discouraged them through my questioning and tone of voice?
Hence, to ensure that I did not create or encourage the answers given, I rigorously read the data transcripts in light of the questions asked and the way in which they were asked. I was able to do so because I transcribed the interviews myself. Despite its being an arduous and time-consuming task, the process of transcribing the interviews had enabled me to read the transcribed data together with the intonations of the speakers and thus have the “feel” of the conversation. The self-doubts had necessitated a more reflective reading of the data during the stage of developing explanations of the case as compared to the earlier stage of the analysis; that is, the stage of finding the key issues and relationships between the data.
To increase confidence in the analysis, I not only reflected on my role during the research process but also examined the use of the theoretical framework and its impact on the research. From the onset of the fieldwork, I was concerned that my use of the theoretical framework would constrain what I saw in the field or could lead me to see things that were not there. Subsequently this would influence my interpretation and explanation of the case findings. As Van Maanen (1995) has rightly pointed out, “our representation may well come first, allowing us to selectively see what we have described” (p. 14). As mentioned, I conducted most of the interviews in the earlier rounds like “guided conversations” to ensure that I was sensitive and open to other issues arising from the field. I used the theory in my research in a dialectical way. The theoretical framework had helped in providing an initial focus during the fieldwork, and it, in turn, was further refined from the data. Thus, the role of the theoretical framework in explaining the data has to be analyzed to ensure that it was not forced onto the data.
On reflection, I think the self-doubt and crisis of confidence challenged me to think about my role and the role of the theoretical framework in the research and also to search for disconforming evidence that refuted my explanation of the data. Although at times the process of reflection and self-scrutiny exacerbated the crisis of confidence, it also pushed me to think of other possible explanations of the phenomena and to dialectically juxtapose the various explanations so as to develop the best explanation of the data. Once I was satisfied and happy with the explanation, it was easier to write up the findings and explanation of the case. Thus, the crucial issue was to convince myself during my analysis of the data. Then I would be able to convince others and write my findings more credibly. Therefore, the process of reflection had helped to increase my confidence in my analysis and ensure that I did justice to the data. I was confident that I did not make up the data or take what was said out of context. In addition, the explanation of the research phenomenon was grounded in the case and it encompassed the data in all of their complexities.
The credibility of the research depended on the return visits to the organization. Two years later I went back to the organization for the second phase of the research. Those visits were initially filled with anxiety and questions of whether my explanation had been credible. The subsequent visits led to more questionings on the interpretation developed in the first phase of the research. This, subsequently, reinforced the confidence built in the earlier interpretation of the research.
Conclusion
In this paper I have discussed the craft of analyzing qualitative data. The leap made from the raw ethnographic data to the final reality reconstruction is elucidated and given voice. The interpretation process is actually a sensemaking craft (i.e., making sense of what has been learned) (Denzin, 1995), and from this the explanation that we derive is a mix of theory and observations (Humphrey & Scapens, 1996). The researcher in qualitative research is the research instrument, the means through which the data are analyzed and interpreted. The subjectivity of the researcher is part of the data and influences the sensemaking process. A researcher's reflections on his or her actions and observations in the field, impressions, and so on, are things that should not be objectified away. They become data in their own right, and they inform the interpretation of a phenomenon.
As such, the data generated from the research need to be read not only in their literal and interpretive sense but also in a reflective way. This means that they have to be read reflectively in view of our role in the research process: not only in explaining but also in generating the data. Hence, reflection is crucial. The researcher must think about how his or her data, the methods, categories, and theories used do justice to the subject and the data. Have we imposed our views on the respondents? I think the a researcher who is besieged with a crisis of confidence should be glad as it will help to ensure that she reflects on her role in the research process and on the bias and assumptions that she has brought along to the field. It also helps to push the researcher to unfreeze her thinking and subsequently to consider other possible explanations of the phenomena.
Thus, a crisis of confidence challenges a researcher to think beyond the obvious. The saying “Doubt is the beginning of wisdom” is very true. If we are straight away confident of our analysis and interpretation that we have derived from the data, then we will not be pushed to think of other possible alternative explanations and to reason out the merits of one explanation over the other. The crisis of confidence should be celebrated as it demands that researchers not only meticulously review the data again and again but also stand back from the data and scrutinize them within their overall context and in view of their role in constructing and explaining the data. In so doing, they become intimately familiar with their data.
With all these reflections and self-doubts in qualitative analysis, it is no wonder that sometimes it feels as if we are engaging in unscientific practice. However, as Van Maanen (1995) has observed, “the more scientific ethnographers tried to be by writing their methods, the less scientific those methods appear” (p. 8). This might be because crises in confidence dogged every step of the sensemaking process and question our quest to provide a credible, plausible, and authentic account of the phenomenon under study.
Despite all these concerns and pitfalls, I found that qualitative data analysis is, as expected, a very rigorous and, surprisingly, systematic process. The challenge is to make sense of the field, which does not come with a clear coherence. It is messy and ambiguous, and the phenomenon is the result of a mishmash of interrelated factors. We need to crystallize this mishmash. As such, we have to understand the data with a view of eliciting its key similarities and differences, to comprehend the context of what was said and to understand the framework within which something happened, and, finally, to weave them all together into a cohesive explanation. In so doing, we reflect on our role in the process and on whatever views and assumptions we bring along with us. Only then will we be able to do justice to the data, the organization in which the research is undertaken, and the organizational members who have given time and effort to the research.