
Abstract
Background
Intra-procedural characterization of stroke thromboemboli might guide mechanical thrombectomy (MT) device choice to improve recanalization rates. Electrochemical impedance spectroscopy (EIS) has been used to characterize various biological tissues in real time but has not been used in thrombus.
Objective
To perform a feasibility study of EIS analysis of thrombi retrieved by MT to evaluate: (1) the ability of EIS and machine learning to predict red blood cell (RBC) percentage content of thrombi and (2) to classify the thrombi as “RBC-rich” or “RBC-poor” based on a range of cutoff values of RBC.
Methods
ClotbasePilot was a multicentric, international, prospective feasibility study. Retrieved thrombi underwent histological analysis to identify proportions of RBC and other components. EIS results were analyzed with machine learning. Linear regression was used to evaluate the correlation between the histology and EIS. Sensitivity and specificity of the model to classify the thrombus as RBC-rich or RBC-poor were also evaluated.
Results
Among 514 MT,179 thrombi were included for EIS and histological analysis. The mean composition in RBC of the thrombi was 36% ± 24. Good correlation between the impedance-based prediction and histology was achieved (slope of 0.9, R2 = 0.53, Pearson coefficient = 0.72). Depending on the chosen cutoff, ranging from 20 to 60% of RBC, the calculated sensitivity for classification of thrombi ranged from 77 to 85% and the specificity from 72 to 88%.
Conclusion
Combination of EIS and machine learning can reliably predict the RBC composition of retrieved ex vivo AIS thrombi and then classify them into groups according to their RBC composition with good sensitivity and specificity.
Introduction
The new generation of thrombectomy devices has revolutionized the management of large vessel occlusion-related acute ischemic stroke (LVOAIS). Nonetheless, partial to complete reperfusion can be achieved only in about 80% of the patients in 2021.1,2 Stroke thrombi are composed of two main types of regions which influence mechanical characteristics: red blood cell (RBC)-rich regions and fibrin-platelet rich regions. Thrombus composition and mechanical properties play a critical role in the success of endovascular treatment. Recent data suggest that fibrin-platelet-rich thrombi are more resistant to thrombectomy and lead to poorer revascularization outcomes.3–7 For these resistant thrombi, stentrievers with a dedicated design, such as the Cerenovus Nimbus device, or more aggressive techniques such as double stentriever could be used from the first pass. Up to now, imaging was the only approximate indicator of the amount of RBC of the thrombus. Computed tomography (CT) with a hyperdense artery sign (HAS) or magnetic resonance imaging (MRI) with a positive susceptibility vessel sign (SVS) indicates thrombi with high rates of RBC.8–10 However, with a trend toward a direct-to-angio approach, the availability of pre-thrombectomy imaging for clinical decision-making will be reduced. 11 Identifying new and more precise tools to determine the thrombus composition is highly desirable to adapt the thrombectomy strategy to the composition of the thrombus and to analyze unretrievable thrombi.
EIS is a well-known and robust technology for real-time characterization of biological tissues. A small voltage is applied between two electrodes in contact with the tissue and the measured current response yields a characteristic electrical impedance spectrum of the tissue. Combining this characteristic electrical impedance spectrum with machine learning algorithms allows the classification and identification of the tissue. EIS has been used to determine tissue types for different applications including oncology, wound healing, intra-articular vaccination, and biopsy.12–15 Some studies have evaluated its ability to detect RBC hemolysis and aggregation and atherosclerotic lesions. (reviewed in Patil et al. 16 ) A recent publication described the characterization of in vitro thrombi using EIS. 17 However, the use of EIS to characterize retrieved human thrombi regarding their histology has not been reported.
The objective of our feasibility study was to perform an EIS analysis of thrombi retrieved by MT to evaluate: (1) the ability of EIS combined with machine learning to predict RBC percentage content of thrombi and (2) to classify the thrombi in groups based on a range of cutoff values of RBC content. Data from this study will be used to inform impedance thresholds in the design of a novel microguidewire for thrombus characterization in acute ischemic stroke.
Methods
Study design
Clotbase pilot was a multicentric, international, prospective study involving five hospitals performing MT.
Patient and thrombus inclusion criteria
Thrombi from patients 18 years and older with an LVOAIS of the anterior or posterior circulation were included in the study. The study was approved by local ethics committees of the stroke centers involved in the study.
Exclusion criteria included: protocol deviation (e.g., thrombus stored more than 3 h or fixed in formalin or frozen before EIS analysis), measurement was not electrically exploitable (mainly due to a design issue with the electrical ground connection of the ex vivo platform), the thrombus was lost during the workflow; the histological analysis was not realized or exploitable.
Overall workflow
The thrombectomy technique of revascularization was left to the operator's choice. The retrieved thrombus underwent EIS analysis and was then fixed in formaldehyde and sent to a histological reference center for histological analysis. EIS data and histological analysis results were stored in the Sensome cloud database. The data were analyzed using machine learning techniques to create a prediction model to identify the RBC content percentage of the thrombus. Figure 1 depicts the overall workflow.
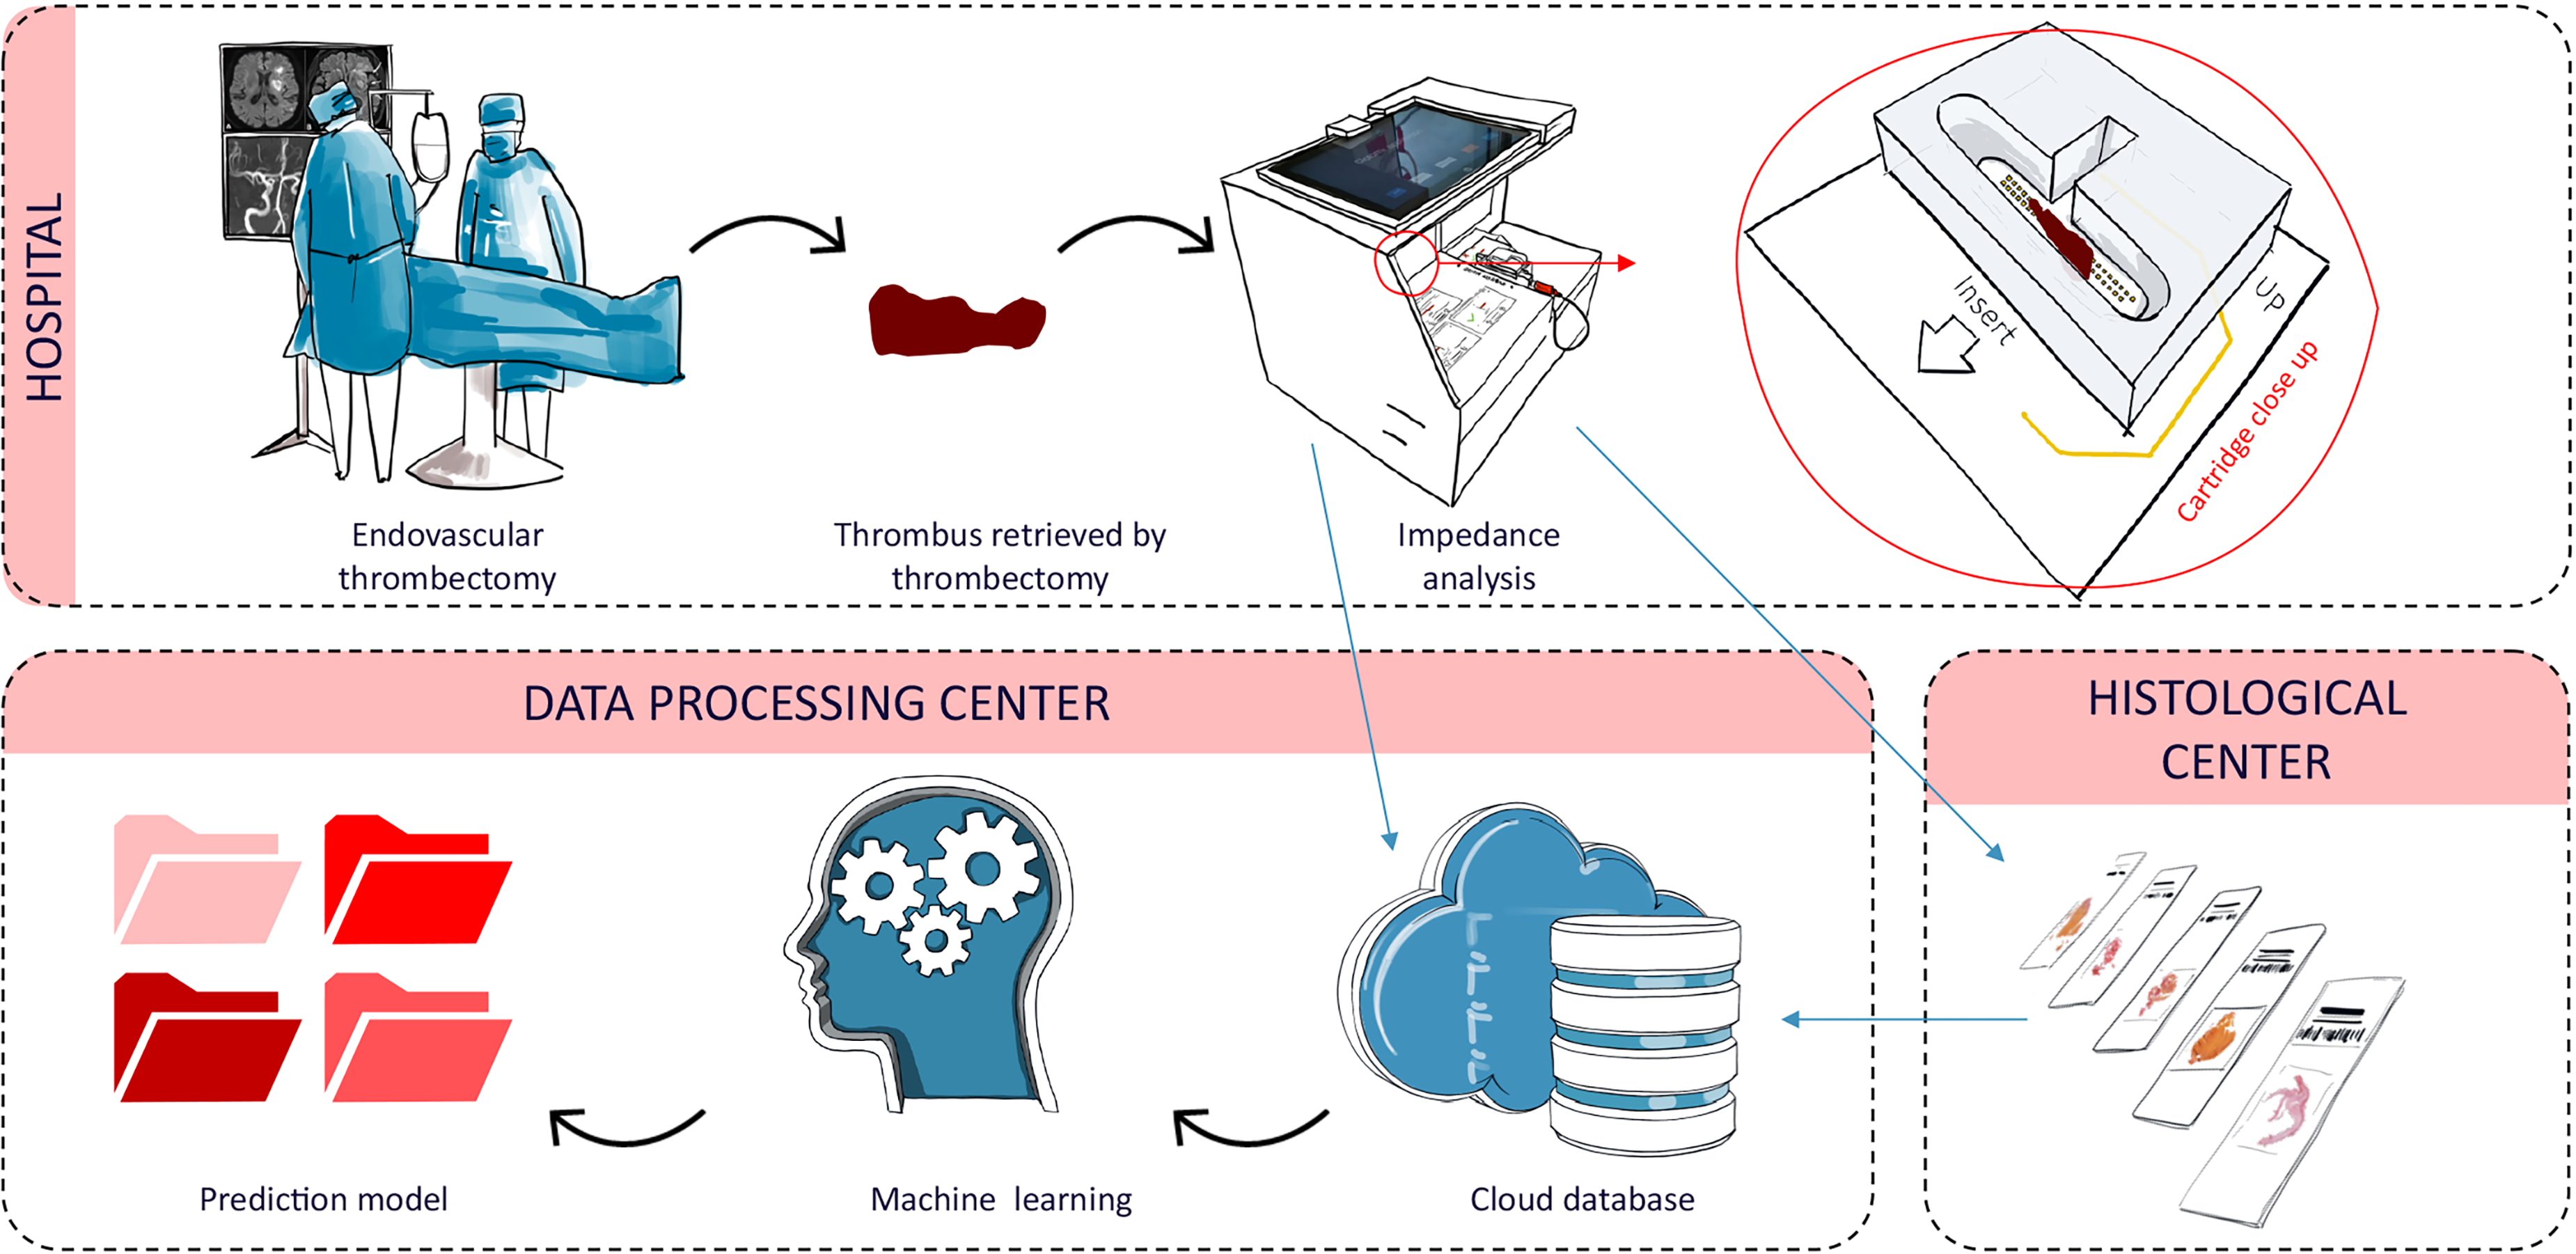
Workflow: Stroke patient treated with MT. The retrieved thrombus underwent EIS analysis by the investigator within 3 h. Thrombi were then fixed in formaldehyde for histological analysis. EIS data and histological analysis results were stored in the Sensome cloud database. The prediction model for thrombi classification was created using machine learning.
Electrochemical impedance spectroscopy
Thrombus analysis by EIS was performed with a standardized protocol in all centers using a custom-made single-use cartridge. Each cartridge was composed of an array of 48 gold electrodes, able to perform up to 45 individual measurements. Each individual measurement was performed between two adjacent electrodes of the same array. Each electrode was 300 µm × 300 µm in size, with an inter-electrode spacing of 450 µm. The local area probed by one individual measurement was 1000 µm × 300 µm. The total area probed by the 45 measurements within the array was 2 cm × 1 mm. The measurements were performed using a high-precision impedance analyzer (ISX-3, ScioSpec GmbH, Germany) in a frequency range between 1 kHz and 30 MHz. Thrombi were photographed and then analyzed in the cartridge containing ∼750 µL of Dulbecco's phosphate buffered saline (PBS) (DPBS-Gibco™ 14190086). For a measurement to be analyzed, the thrombus must be placed in the middle of the two arrays and must be in contact with the electrodes. A custom cap is used to ensure contact between the electrodes and the thrombus. Finally, the thrombi were fixed in formaldehyde (4%) and shipped to the histological center. The measurements performed by all the centers were centralized and synchronized in the Sensome cloud database.
Histological analysis
Histological analysis was realized by three different centers using a similar protocol. 18 Following EIS analysis, the thrombus was stored in 4% formaldehyde at room temperature for between 24 and 48 h. Samples were then embedded in paraffin and oriented in such a way to generate the largest cross-sectional area when cutting in 3–5 µm slices. Per thrombus, one section, exposing a large cross-sectional area of the entire thrombus, was selected for the staining.
The selected slice was mounted on glass slide, stained with Martius Scarlet Blue (MSB), and digitally scanned with a high-resolution scanner in three centers following a protocol. Then, a semi-automatic segmentation was performed as previously published with Orbit Image Analysis software (Actelion Pharmaceuticals Ltd, Allschwil, Switzerland, www.orbit.bio) 19 or ImageJ software 1.49v (National Institutes of Health, Bethesda, MD, USA; http://imagej.nig.gov/ij/). 20
Proportions of RBC, white blood cells (WBC) fibrin, platelets, and other were calculated for each sample.
Machine learning model description
For each EIS analysis of a thrombus, individual measurements in contact with the thrombus were isolated from the ones in contact with PBS only. The average number of individual measurements per thrombus after filtration was 21.2 ± 11.4. These individual measurements were also processed to eliminate electrical parasitic effects.
A support vector classifier (SVC; also previously used in our in vitro work 17 ) was trained at the level of individual measurements to recognize the RBC signal of a given measurement. 19 thrombi were selected to train the model by two EIS experts (“training set”). Of these 19 thrombi, 6 had an RBC content above 75% based on histological analysis and 13 had an RBC content of less than 30% based on histological analysis. Two EIS experts (PM 9 Years of experience; AG 3 Years of experience) confirmed that the 6 thrombi with high RBC content had individual measurements characteristic of RBC and that the 13 thrombi with low RBC content had individual measurements characteristic of absence of RBC. The number of thrombi in each of the two groups was chosen to have a balanced number of individual measurements per group with 236 and 238 individual measurements, respectively. All individual measurements of the 6 thrombi with high RBC content were labeled as “RBC signal” and the measurements of the 13 thrombi with low RBC content were labeled as “not-RBC signal.”
The output of the SVC is the probability of an individual measurement to be a RBC signal. The predictions on each individual measurement of a given thrombus are then aggregated to build a single prediction for the corresponding thrombus by averaging the probabilities of having a RBC signal over the individual measurements composing the thrombus. The predicted RBC content percentage of a thrombus corresponds to the resulting averaged probability.
A 5 folds cross-validation method was used to evaluate the predictive performance of the model. Both training and testing sets are divided into five folds. To rule out bias, a given thrombus was used only in either the training set or the validation set.
Statistical analysis
A linear regression was performed between RBC content given by the histological analysis and the one predicted by the model. To determine the consistency of the correlation, the Pearson correlation coefficient, the slope, and the intercept of the linear regression were computed. Thrombi were also classified into two groups based on varying cutoffs of RBC content, including 20%, 30%, 40%, 50%, and 60%. The overall accuracy, sensitivity, and specificity, together with 95% confidence intervals (CI) were evaluated using a binomial distribution. In the following the term “RBC-poor” refers to thrombi with a RBC content below the chosen cutoff, while the term “RBC-rich” refers to thrombi with a RBC content above the chosen cutoff.
Results
The study was conducted between October 2018 and March 2020 in five stroke centers from four different countries. Among 514 thrombectomies, 335/514 (65%) thrombi could not be included in the study for the reasons already mentioned and listed in Figure 2.
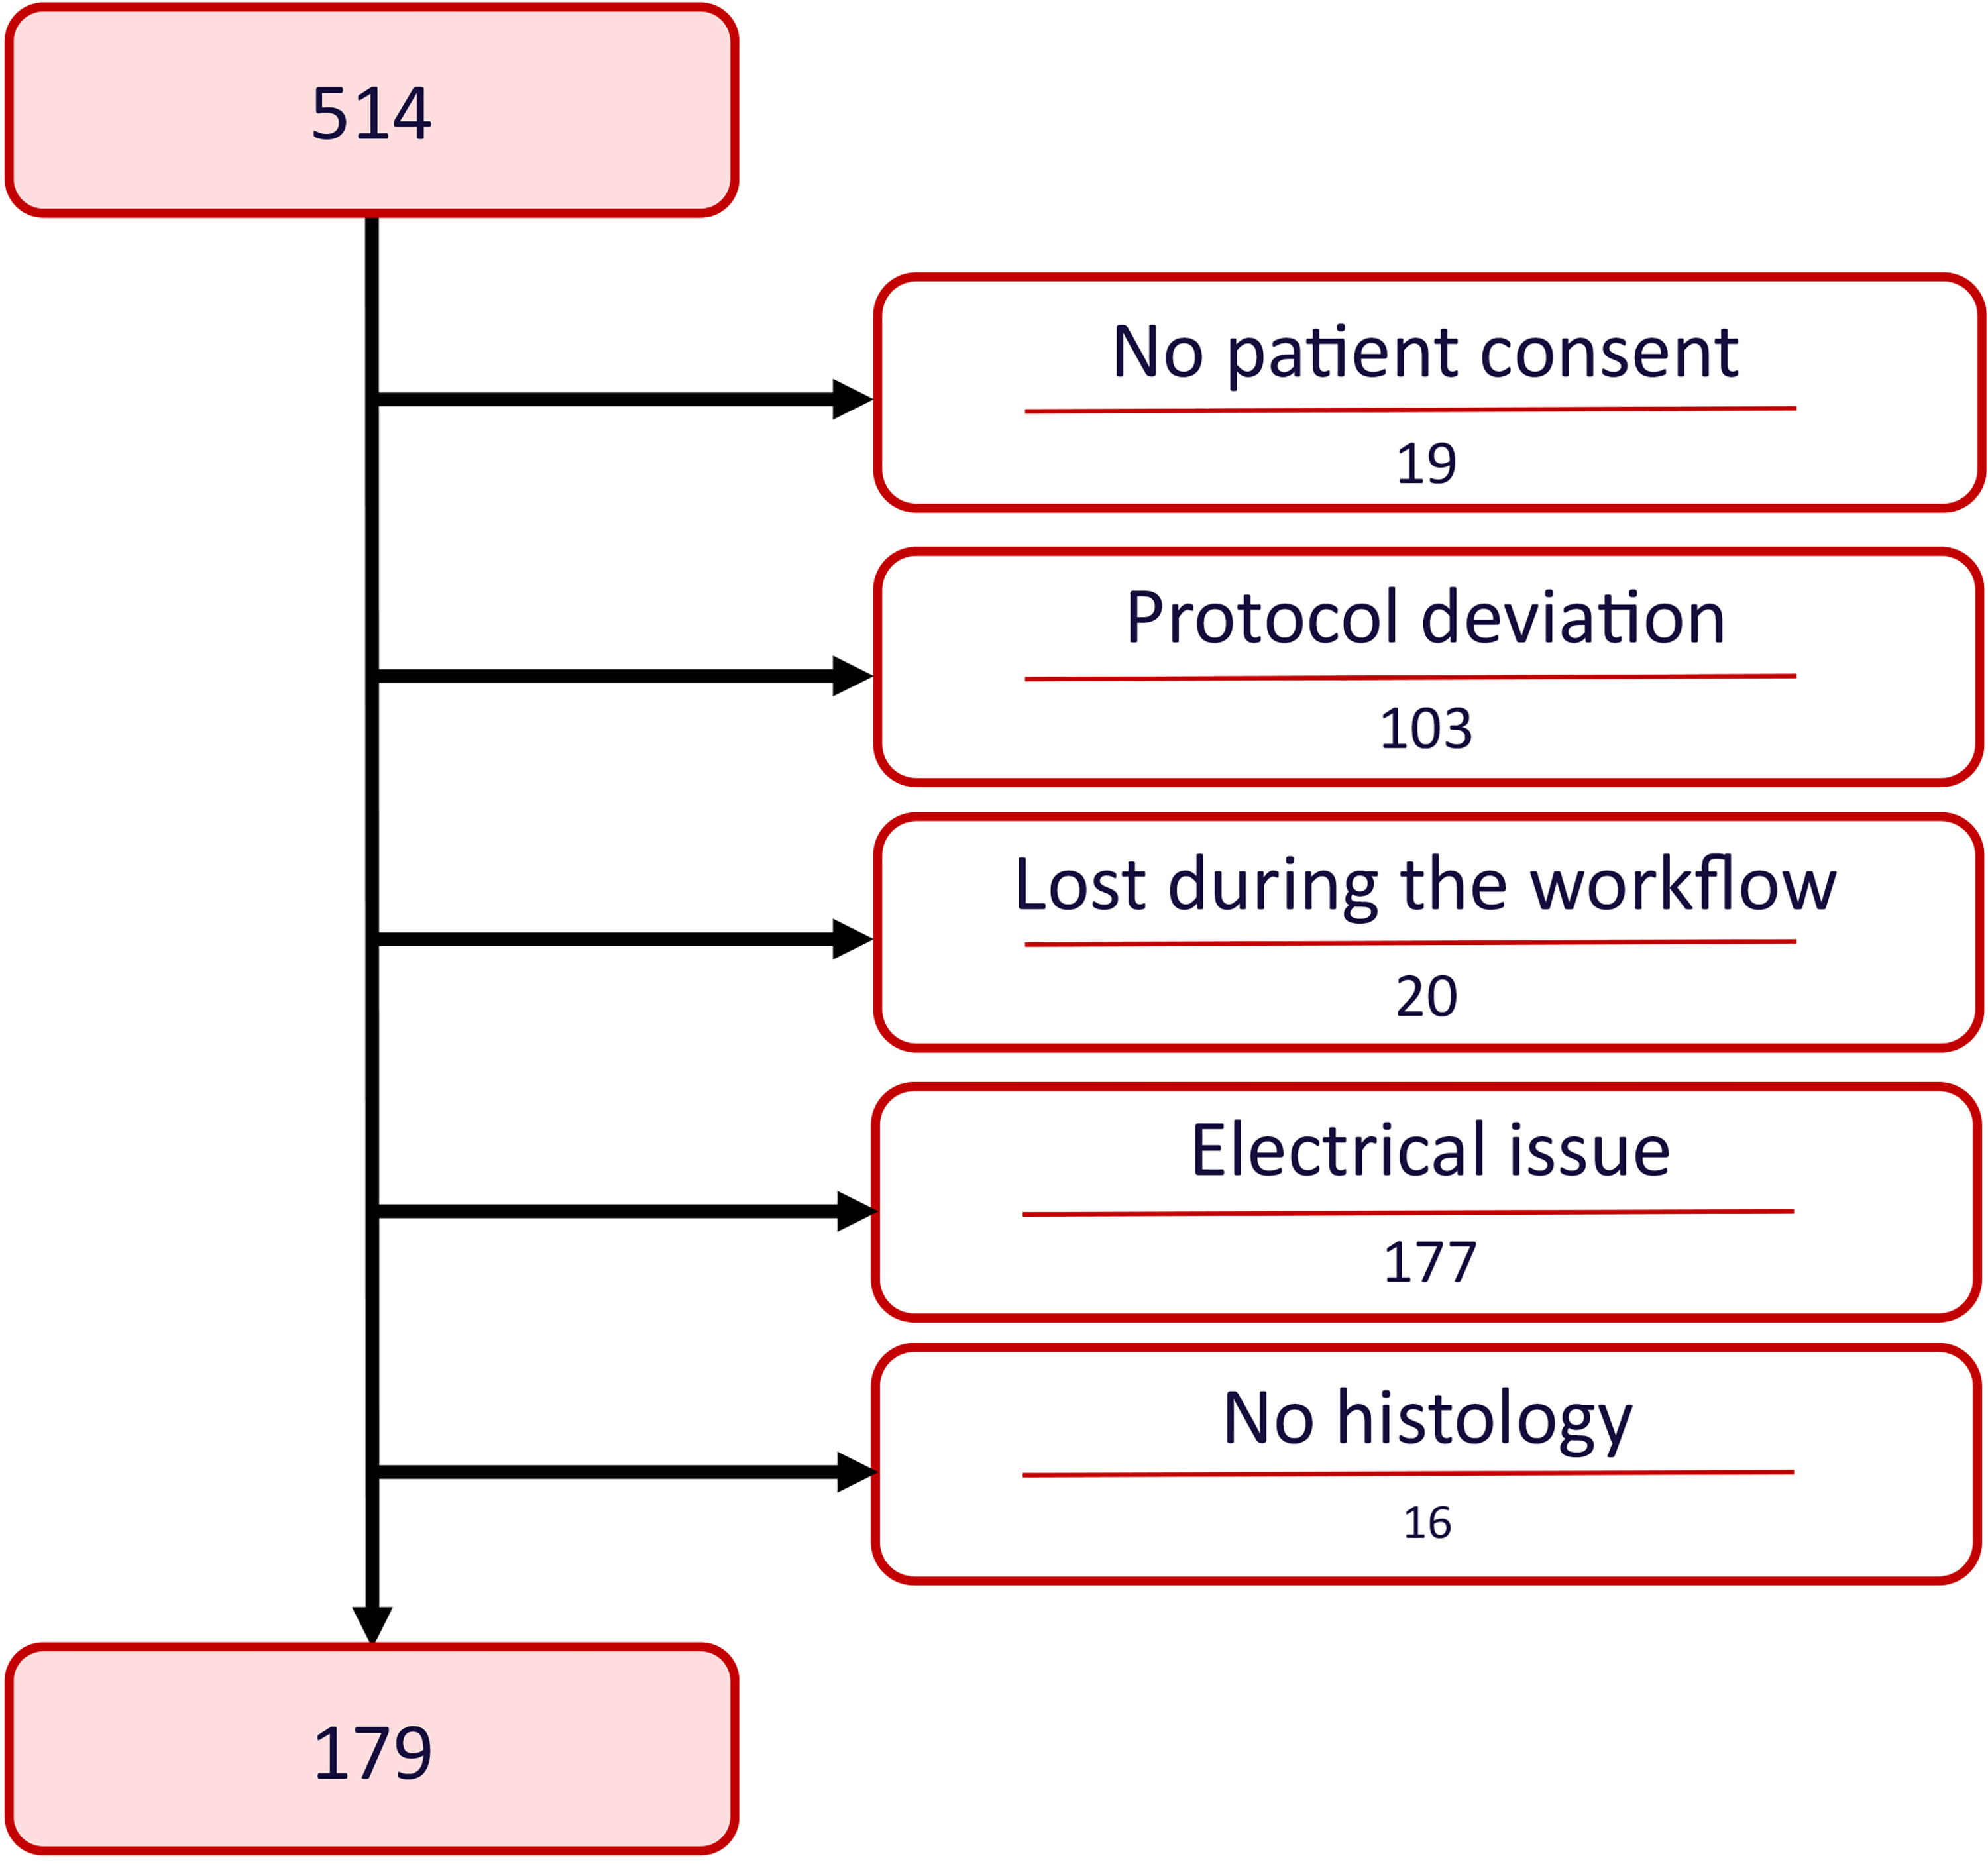
Clotbase Pilot flow diagram.
Hence, 179/514 (35%) thrombi were included in the study. As expected, marked heterogeneity was observed in thrombus composition (Figure 3A). Mean thrombus composition was 36% ± 24 of RBC, 29% ± 16 of fibrin, 32% ± 21 of platelets and other, and 3% ± 4 of white blood cells.
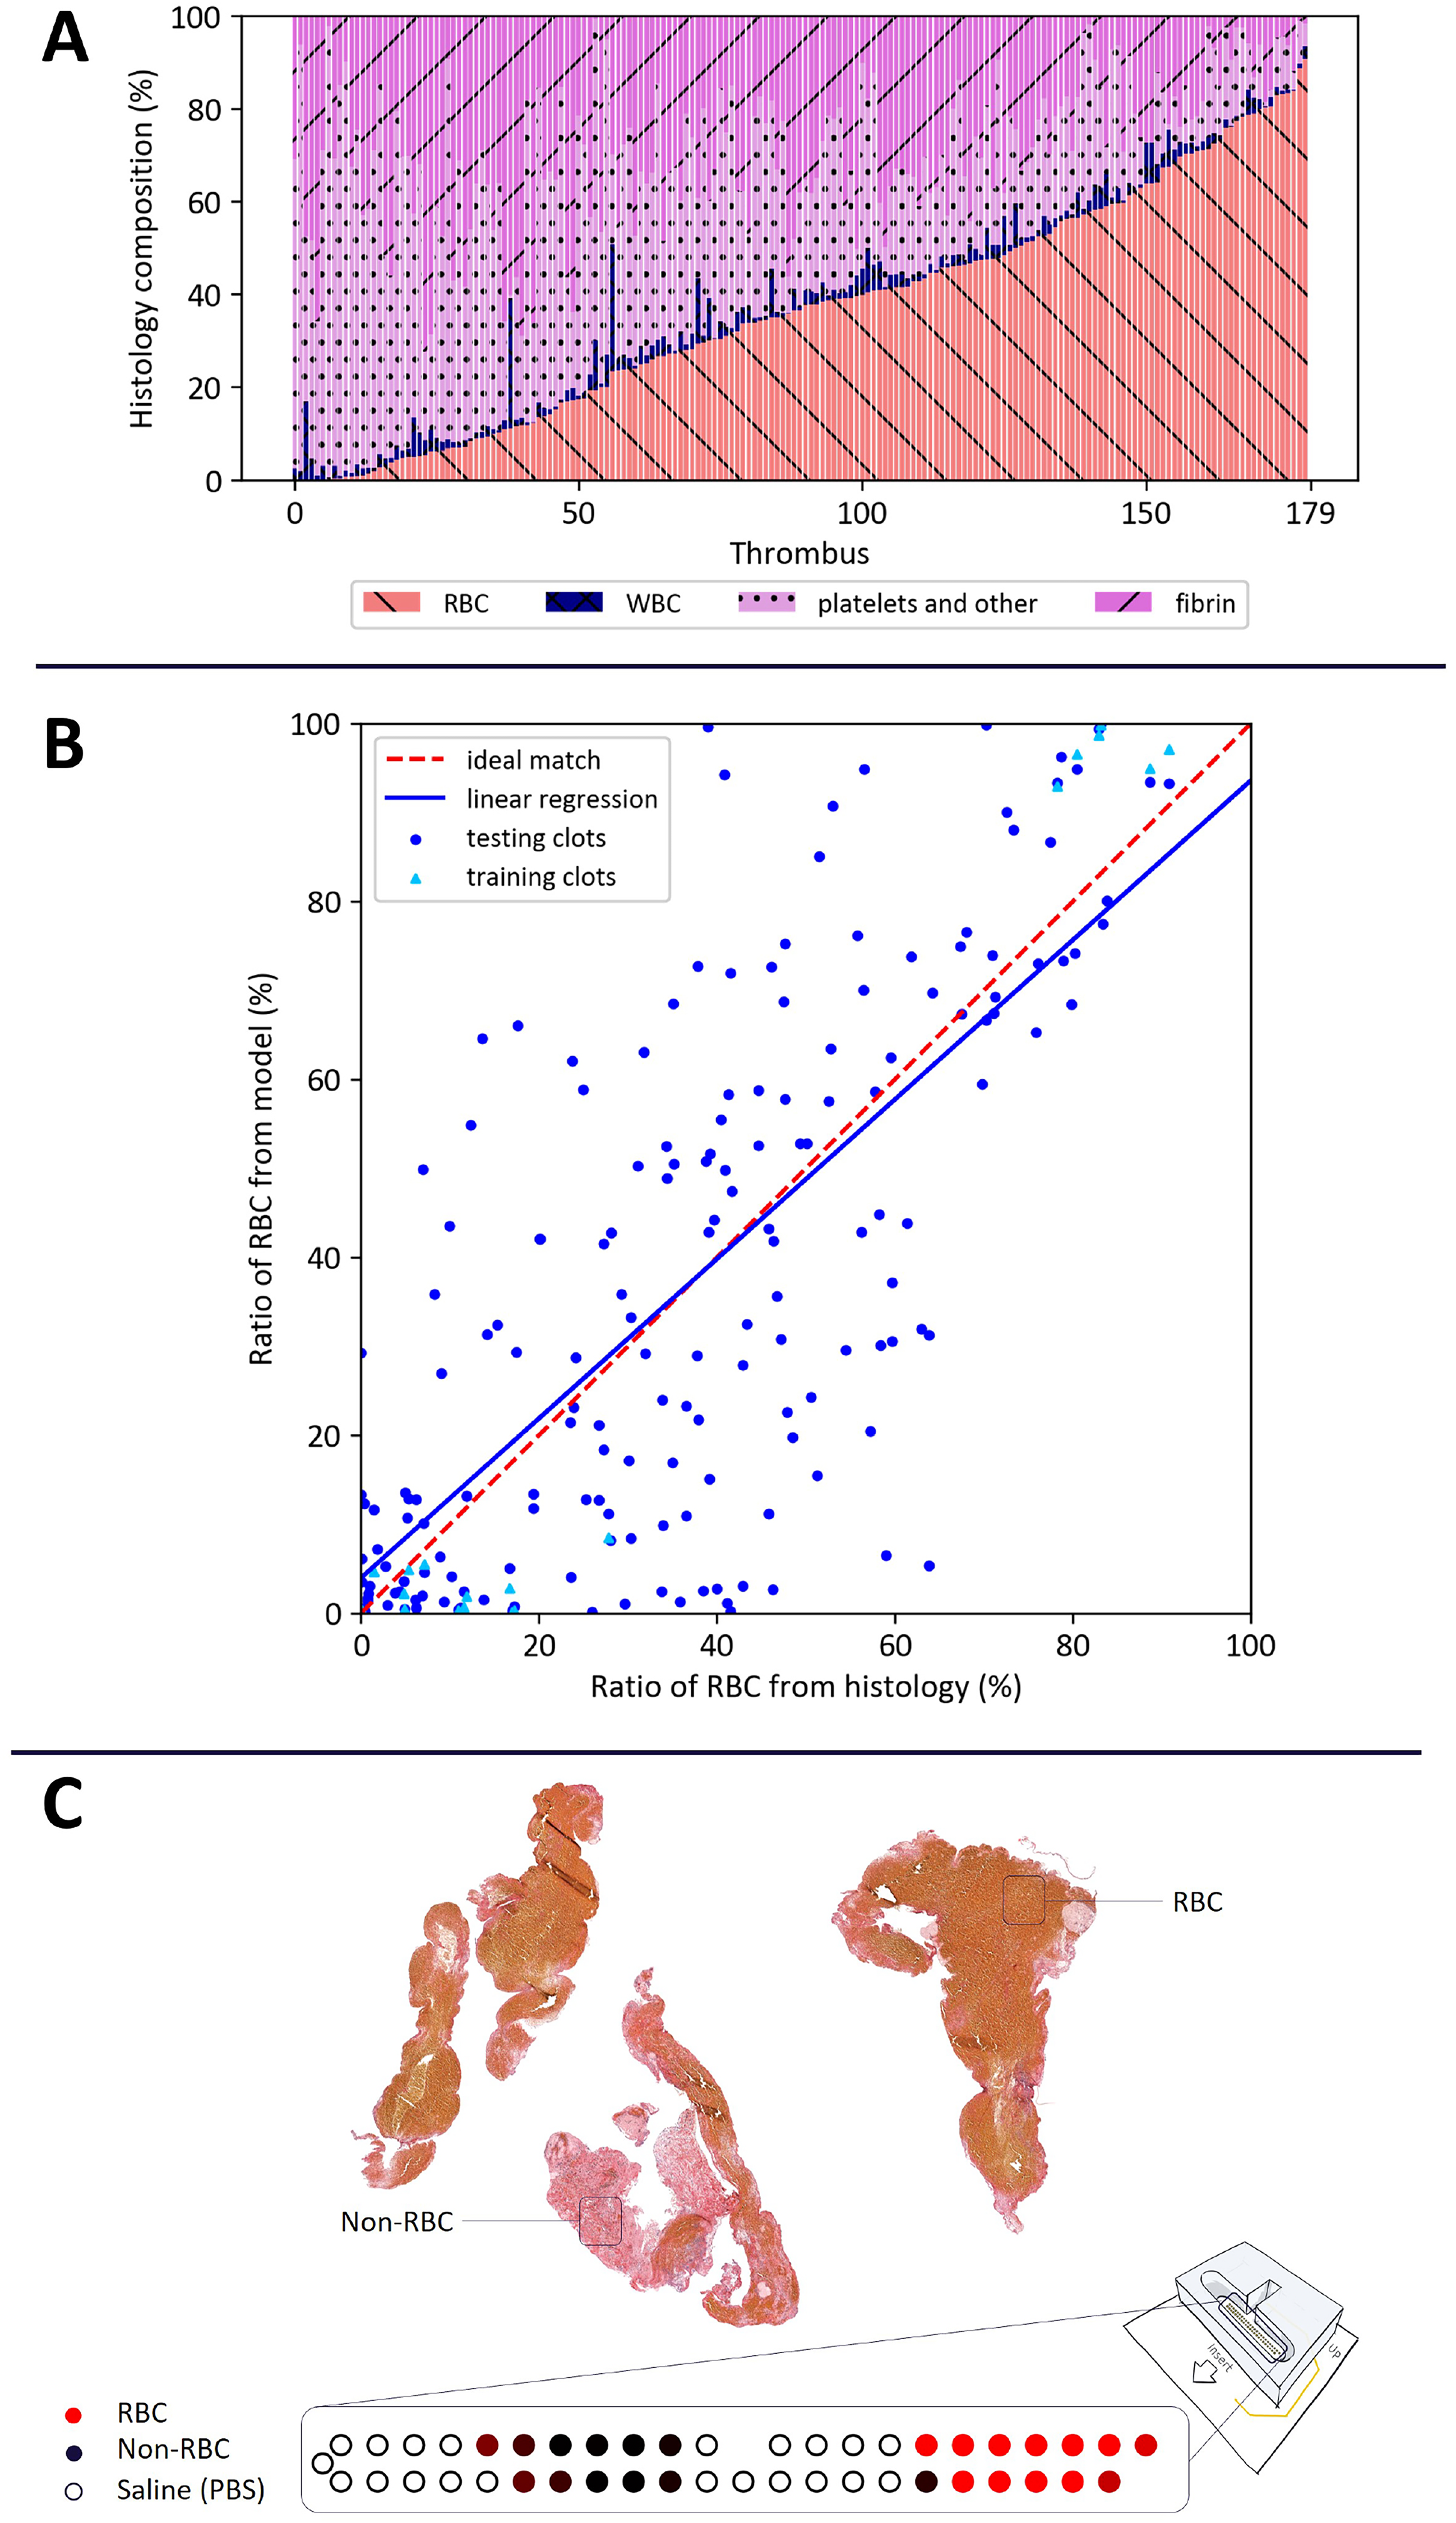
(A) Histological analysis of thrombi showing heterogeneity of the 179 thrombi in this study. Martius Scarlet Blue staining was used to quantify RBCs, fibrin, platelet, and others, and WBC composition of each thrombus. RBCs are represented in red left crossed out. Fibrin in pink right crossed out. Platelets in light pink with dots. WBC in blue. (B) Scatter plot with linear regression of the ratio of RBC in histology on the abscissa versus RBC ratio predicted from impedance measurements in the ordinate. The results of the RBCs ratio predicted by EIS were based on a model trained by machine learning and histological analysis. The machine learning model has been trained using a SVC on 19 thrombi (6 > 75% of RBC and 13 < 30% of RBC). Each blue dot represents a thrombus from the cohort. Light blue triangles represent the thrombus used for the training. Red dashed line represents the ideal match. Blue continue line represents the linear regression rm = 0.90 rh + 4.00. (C) Top: example of MSB staining for one thrombus, in which RBCs appear yellowish and non-RBC elements (e.g., fibrin and platelets) are pinkish. The quantification of this thrombus is as follows: RBC: 48%, non-RBC: 52%. Bottom: prediction map of individual measurements of the thrombus shown above. The color represents the probability of belonging to the RBC-rich class (red), the non-RBC class (black), or the PBS saline class (white/black circle).
Figure 3B shows the linear regression of the RBC ratio predicted by the EIS-based prediction model and the histological analysis. For each thrombus, the ratio of RBC predicted by the model “rm” was represented with respect to the ratio of RBC from histology “rh.” The regression obtained with the testing data is rm = 0.90 rh + 4.00 (blue line)
Figure 3C shows on the top the image corresponding to the histological analysis of a specific thrombus of the collection and its quantification based on MSB staining, and on the bottom the prediction of individual measurements for this same thrombus. In the latter graphic, each dot represents an individual measurement between two adjacent electrodes, and the color represents the probability of belonging to the RBC-rich class (red), the non-RBC class (black), or the PBS saline class (white/black circle). The intensity of the color varies according to the probability of belonging to a given class. For this specific clot, the mapping shows the distribution of the prediction of individual measurements to belong to a given class, before averaging all the probabilities. This example demonstrates the heterogeneity of composition throughout the clot.
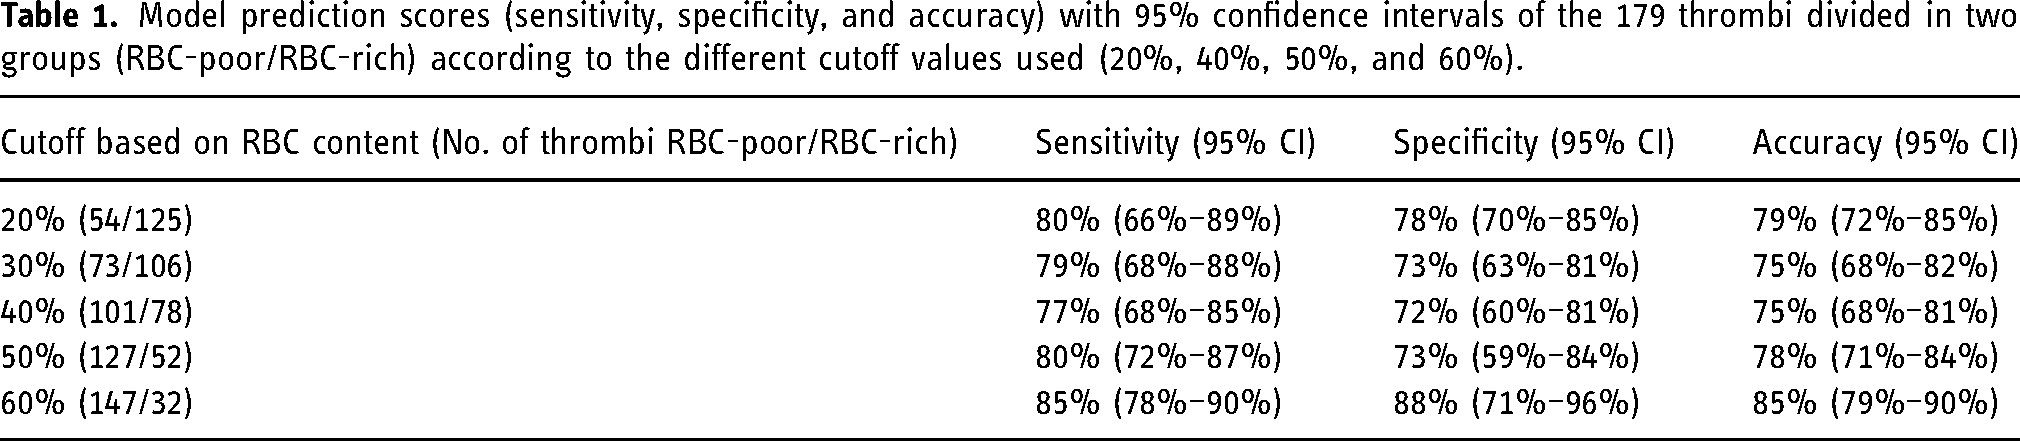
The sensitivity, specificity, and accuracy of the model to classify the thrombi in groups according to % RBC content are summarized in Table 1. Thrombi were stratified in 10-percentile bins according to RBC composition. Sensitivity varied between 77% and 85%, specificity between 72% and 88%, and accuracy between 75% and 85%.
Model prediction scores (sensitivity, specificity, and accuracy) with 95% confidence intervals of the 179 thrombi divided in two groups (RBC-poor/RBC-rich) according to the different cutoff values used (20%, 40%, 50%, and 60%).
Discussion
The main findings of our work were (1) that EIS analysis combined with a machine learning approach yields good results in predicting the RBC composition of thrombi showing a good correlation with the histological analysis. (2) The model could classify the thrombi for several cutoffs of RBC with good sensitivity, specificity, and accuracy.
The identification of fibrin/platelet-rich (i.e., RBC-poor) thrombi is clinically meaningful because they appear more resistant to recanalization and especially to contact aspiration alone.3,21,22 Since there is no consensus on the definition of RBC-rich or RBC-poor thrombi in the literature, we decided to analyze the ability of the model to classify the thrombi for a large range of cutoffs from 20% to 60% of RBC content. Our model was able to identify RBC-poor thrombi (<20%) with 80% sensitivity, 78% specificity, and 79% accuracy.
Currently, the only information available about the composition of the thrombus in the acute stroke care setting is given by cerebral imaging. Thrombi, typically referred to as “RBC-rich,” are visible in CT with the HAS or magnetic resonance imaging with T2* sequence with the SVS. 8 One study found a significant positive correlation between the composition in RBC and Mean Hounsfield Unit Densities on non-contrast CT (ρ = 0.291, p = 0.040). 20 However, the model described here has a markedly higher correlation between the percentage of RBC determined by histological analysis and the fraction of RBC predicted by the impedance machine learning model (ρ = 0.72, p = <0.0001).
Since SVS + and SH + have been reported for RBC “rich” thrombi and mean composition of RBC around 40%, the 40% cutoff is of particular interest. However, sensitivity or specificity of detecting RBC-rich thrombi via imaging has not been reported. In this feasibility study, we show that EIS is a robust technique to identify these thrombi with good sensitivity (77%), specificity (72%), and accuracy (75%) for the 40% cutoff.
Moreover, with a trend toward a direct-to-angio approach, the availability of and access to pre-thrombectomy imaging for clinical decision-making may be reduced. 11 Thrombus composition, in particular high content of RBC, is becoming accepted as a predictor of thrombectomy success, good clinical outcome, and influenced by thrombus etiology. 23 Pre-thrombectomy information about thrombus composition is thus needed and EIS analysis combined with machine learning is a promising approach to obtain this information.
This study has several limitations. First, a relatively high proportion of cases had to be excluded because of a design defect with the electrical ground of the ex vivo platform which could not be detected during the measurement. If the measurements were abnormal the cartridge was considered as inoperable. The research platform used for this study and the protocol has been continuously improved over time to avoid protocol deviations and electrical issues. To give an example, the exclusion rate due to electrical failures went from 65% for the first hospital, to 25% on average for the last two hospitals in which we deployed the platform. A second phase of the project is currently underway and after further improving the platform, the global exclusion rate due to electrical issues and protocol deviations is today less than 10%.
Nevertheless, it is important to mention that the samples collected were representative of the real thrombus population with a wide range of biological components of the clot as shown by the histological analysis. Second, EIS analyses were performed on the outer part of the thrombus in contact with the electrodes, whereas histological analysis was performed on a single 3–5 µm slice approximately in the center of the thrombus. A previous study has shown that while histological analysis carried out on one slide only is qualitatively representative of the whole thrombus, the RBC content on different slides throughout the thrombus can vary. 18 This directly affects the performance of our model. Third, the time between clot retrieval and its analysis was not recorded. While exposed to air clot, composition can be affected. Therefore, as per protocol thrombi were to be analyzed as soon as possible after MT and were conserved in saline solution at ambient temperature, if the analysis could not be performed immediately following the thrombectomy procedure. Thrombi stored for more than 3 h were excluded from the study. Previous studies have demonstrated that keeping the thrombus in saline solution for the first few hours has a negligible impact on the thrombus composition as determined by histological analysis. 23 Formaldehyde fixation was always performed immediately after EIS analysis. Thus, the thrombus structure for EIS and histology should be similar. Despite these limitations this study showed very good results with the first-generation of the platform.
Conclusion and perspectives
In conclusion, this current study has demonstrated that the application of EIS and machine learning approaches can determine RBC composition of retrieved AIS thrombi and classify ex vivo thrombi in groups according to their RBC composition with good sensitivity and specificity.
A second phase of this study is ongoing with a second-generation platform and an improved protocol, to increase signal quality and predictive performance. Also, the in vivo clinical trial (ClinicalTrials.gov Identifier: NCT04993079) CLOT OUT is currently ongoing using a micro-guidewire with an impedance-based sensor integrated into its distal part.
This technological innovation could inform the operator about the RBC composition of the thrombus and detect the distal end of the thrombus which is not usually visible on angiogram. These pieces of information could help the interventionist to adapt his/her retrieval strategy to the composition and/or length of the thrombus.
Finally, in case of thrombectomy failure this technology could be a useful way to gather information on thrombi that were not retrieved.
Footnotes
Acknowledgments
The authors wish to thank Ronan BALLAND for the design of the platform, Gor LEBEDEV and Joachim RAMBEAU for the development of the software integrated in the tablet of the platform, all the clinical coordinators, nurses and staff who contributed to the experimental work.
Declaration of conflicting interests
Pr. Pereira has ownership interests and are members of Sensome's scientific advisory board. Pr Cognard has ownership interests and are members of Sensome's scientific advisory board. He is consultant for Stryker, Microvention, Medtronic, Cerenovus,and MIVI. F. Bozsak has ownership interests. A. Giraud and P. Messina are employees of Sensome and have ownership interests. The other authors declared no potential conflicts of interest with respect for the research, authorship, and/or publication of this article.
Funding
The authors received no financial support for the research, authorship, and/or publication of this article.