
Abstract
Student evaluations of teaching (SETs) are a common measure of teaching quality in higher education, yet valid inference from such data remains challenging. Hierarchical dependencies among observations, variation in response styles, and measurement error in predictors complicate interpretation, while traditional analyses based on mean ratings often fail to distinguish teaching-related effects from correlated, non-teaching influences. This study introduces a Bayesian mixed-effects location–scale probit model as a model-assisted inferential framework for ordinal SET data. The model jointly estimates effects on the latent mean evaluation (location) and on latent response variability (scale), incorporating hierarchical random effects and correcting for measurement error in multi-item predictors. The framework is illustrated using four semesters of SET data from more than 5,000 students in psychology, pedagogy, and teacher education programs at a German university. The application is intended as a methodological demonstration rather than a population-level generalization. Within this context, didactic quality and lecturer likeability emerged as the strongest predictors of overall evaluations. An interaction effect suggested that comprehensibility receives higher ratings when lecturers are viewed as likeable. Beyond mean effects, substantial heterogeneity was observed at the student, lecturer, and course levels, along with systematic differences in rating precision linked to individual response tendencies. These findings highlight that robust inference from SET data requires models capturing both location and scale heterogeneity. More broadly, the proposed Bayesian approach demonstrates how location-scale modeling can improve the analysis of ordinal data with hierarchical dependencies and measurement error.
Keywords
Introduction
Student evaluations of teaching (SETs) are one of the most common ways colleges and universities try to understand how well instructors are doing in the classroom, but researchers have questioned their accuracy and fairness for decades, noting that these ratings can be influenced by bias and factors unrelated to actual teaching quality. These factors include who the students are, the kind of course being evaluated, and how the evaluation itself is designed (see Feistauer & Richter, 2018; Kromrey, 1995; Marsh, 1984; Rindermann, 2009). Because these factors introduce systematic biases, the results are difficult to interpret accurately or use as reliable evidence of teaching quality.
A key issue is that SET data are complex and multidimensional. Students not only differ in how they rate their instructors but also in how consistently they use rating scales. Research on response styles shows that individual respondents exhibit systematic tendencies, such as extreme or midpoint responding, that are stable across items and independent of item content, reflecting heterogeneous response behavior beyond mean evaluations (Van Vaerenbergh & Thomas, 2013; Weijters et al., 2010). Variance-components analyses of student evaluations further indicate meaningful inter-rater differences when students judge the same course or instructor, e.g., how consistently students agree on ratings (Feistauer & Richter, 2017). Thus, using simple averages can obscure whether scores represent true teaching performance or personal rating tendencies. Moreover, the reliability of individual responses does not necessarily translate into valid conclusions at the group level. Issues like nonresponse or absenteeism, common in course evaluations, can skew results if the students who choose to participate differ systematically in motivation, interest, or satisfaction (Feldmann, 1977; Marsh, 1984; Spooren et al., 2013). Because of this, the average ratings we see might over- or underrepresent actual teaching quality (e.g., De Bruin et al., 2025; Stoesz et al., 2022). Standard analysis methods that focus on average scores or basic regression models tend to miss these nuances, as they assume that all students interpret and use the rating scale in the same way.
While SETs have been widely studied, only a small number of analyses use statistical models that can clearly separate teaching-related influences from other sources of variation, especially when accounting for nested data structures (students within courses, courses within instructors, etc.). Most prior analyses focus exclusively on modeling mean scores, disregarding heterogeneity in the variance of ratings that can reveal structured differences in response behavior and measurement precision (see Bertoni et al., 2024 and Boysen, 2015 for a more detailed criticism). To address these challenges, the present study applies a Bayesian latent location–scale model to SET data collected across multiple semesters from psychology, education, and teacher-training programs at the Ludwig-Maximilians-Universität München. This dataset serves as an illustrative case study to demonstrate the inferential advantages of the proposed model, rather than to provide representative estimates of student evaluation behavior across disciplines or institutions. This methodological approach captures links between students, lecturers, and courses, modeling not just the average ratings but also their variability. By analyzing both parameters together, the model helps isolate true teaching effects from differences in response styles and other biases. This approach shows how this model can provide a more accurate and nuanced understanding of student evaluations.
Method
Sample
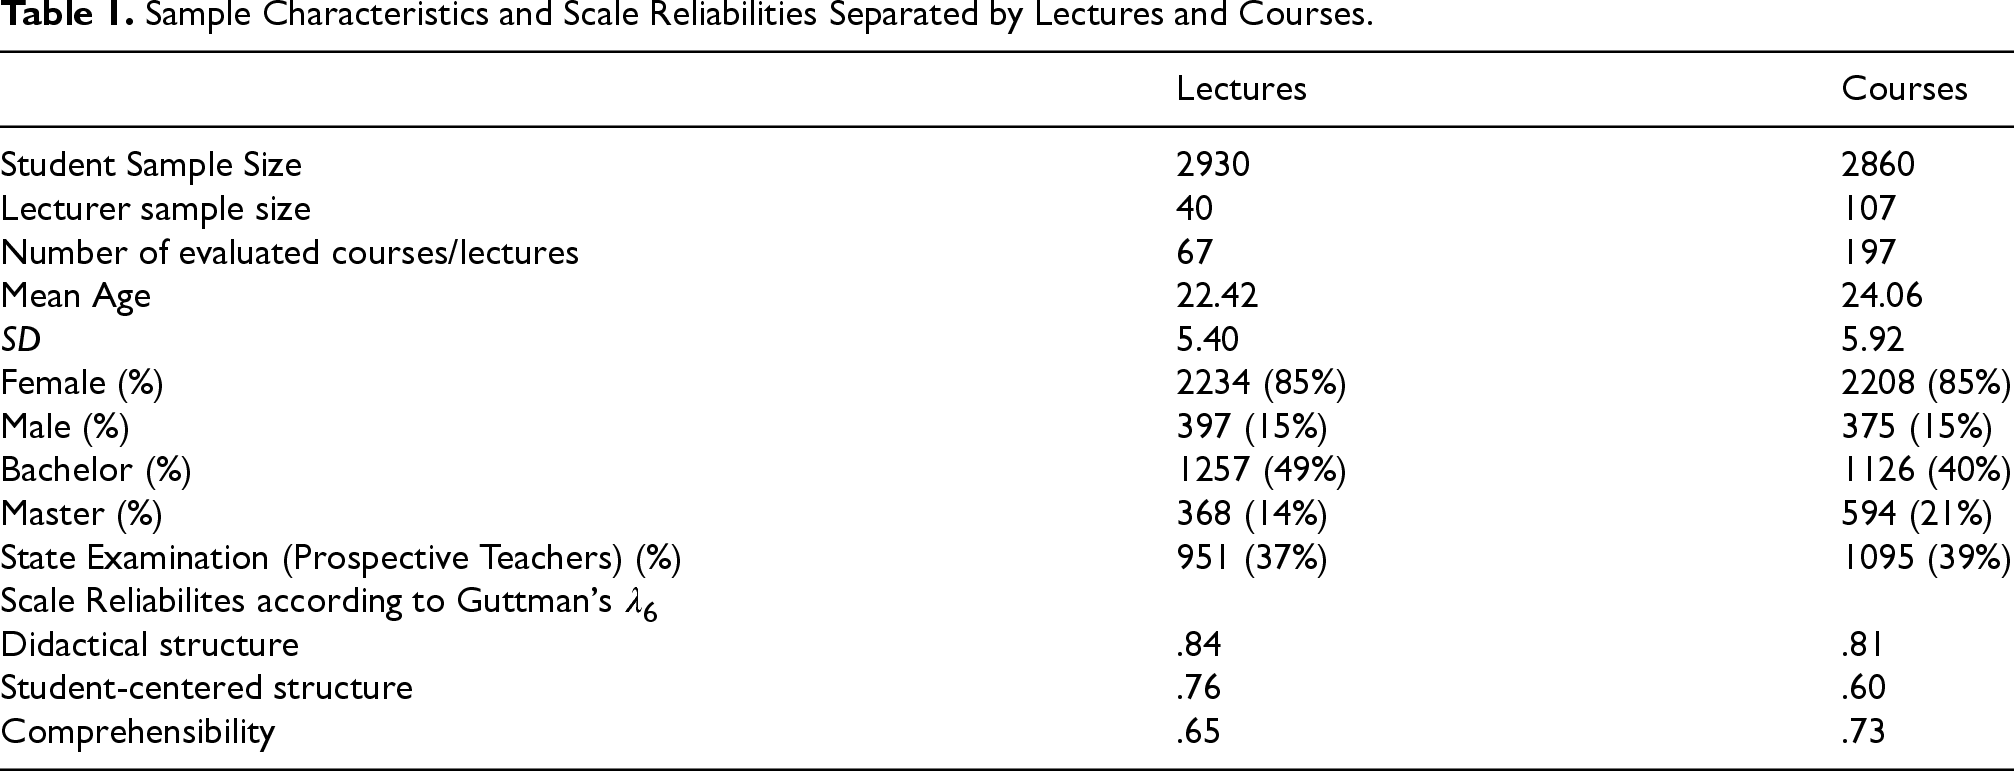
Study participants were lecturers and students studying psychology and pedagogy, as well as student teachers, during the summer term 2017 and winter term 2018/2019 at the Ludwig-Maximilians-Universität München. These groups of students evaluated university lecturers who gave lectures or taught courses over a period of four semesters. For clarity, within the German university system, lectures refer to large, instructor-centered teaching formats with limited interaction, whereas courses denote smaller, seminar-style classes with higher levels of student participation. The evaluations were administered on paper in the classroom during the last week of each semester. Detailed sample characteristics are reported in Table 1.
Sample Characteristics and Scale Reliabilities Separated by Lectures and Courses.
Sample Characteristics and Scale Reliabilities Separated by Lectures and Courses.
Although the sample was drawn from a single German university, the included programs, psychology, pedagogy, and teacher education, cover a wide range of course formats, instructors, and student backgrounds. This diversity allows for examination of both lecturer- and student-level influences on SETs.
For both lectures and courses, a specific evaluation instrument was used. The student evaluation instrument consists of 25 items for lectures and 29 items for courses and lectures. It was developed at the Department of Psychology and Pedagogy at the Ludwig-Maximilians-Universität München and is a multidimensional inventory designed to measure teaching quality separately for lectures and courses. The instrument was based on results from various critical incident techniques conducted with students and lecturers, as well as on a faculty-developed guideline for effective teaching. Its aim is to provide a behavior-based quantification of teaching quality (Knödler, 2019).
The component measuring teaching quality of lectures comprises three dimensions: didactical structure (i.e., extent to which the lecturer used a didactical structure throughout the lecture), student-centered structure (i.e., extent to which the lecturer followed a student-centered approach), and comprehensibility (i.e., perceived comprehensibility of the way the lecturer conveys the information). The component measuring teaching quality of courses encompasses almost the same dimensions as those measured for lecture except for the dimension “didactical structure”, which could be identified as “didactical structure of the course and involvement of the lecturer”.
Scale reliabilities were estimated using Guttman's Lambda 6 coefficient as the amount of variance in each item that can be accounted for the linear regression of all the other items belonging to that scale given through
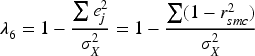
Guttman's λ6 was used as the reliability estimator for multi-item scales. λ6 estimates the proportion of variance in a composite score attributable to true-score variance by exploiting the multiple correlation of each item with the remaining items (Guttman, 1945). Because item covariances within several scales were heterogeneous, Cronbach's α, which assumes homogeneous inter-item covariances, was not appropriate. λ6 is more suitable under such conditions. λ6 coefficients are reported in Table 1 and can be judged as fair to good.
As for the outcome measure, students were asked to rate overall teaching quality on a six-categorical rating scale ranging from 1: “Very good” to 6: “Insufficient” corresponding to the German grading scale being used at schools. Mean scores obtained for each of the four dimensions were then calculated for the statistical analyses as described below.
Statistical Analyses
Due to the ordered-categorical nature of the outcome variable, we employed a Bayesian mixed-effects location–scale probit model that jointly models the mean (location) and variability (scale) of latent responses. The Bayesian formulation is not used solely to accommodate random effects, but to enable joint probabilistic estimation of all components of the model, including latent location and scale parameters, hierarchical random effects, and predictors corrected for measurement error. Prior distributions are specified for fixed effects, variance components, and latent true scores underlying observed composite predictors, and inference is based on the joint posterior distribution of all parameters, allowing uncertainty arising from hierarchical dependence, response-style heterogeneity, and measurement error to be propagated coherently through the analysis.
In principle, individual components of the proposed model, such as ordinal mixed-effects models for the mean structure, could be formulated within a frequentist framework. However, the present analysis requires the simultaneous estimation of (a) hierarchical location–scale effects for an ordinal outcome, (b) random effects in both the location and scale components, and (c) predictors subject to measurement error, with coherent uncertainty propagation across all components. In principle, individual components of the proposed model have been considered in frequentist mixed-effects settings (e.g., heterogeneous variance components or separate location–scale formulations), but standard frequentist implementations do not readily support the joint estimation of hierarchical location–scale effects with random effects in both mean and variance and measurement-error-corrected predictors, especially for ordinal outcomes. The frequentist literature on flexible location–scale models remains rather limited to specialized formulations (e.g., Li & Hedeker, 2012; Nakagawa et al., 2025). The Bayesian framework therefore provides a practical and broader model-assisted inferential strategy by stabilizing estimation through prior regularization and by yielding full posterior distributions for all parameters, which is essential for the inferential goals of the present study.
In general, a mixed-effects location-scale model estimates the relationship between predictors and the latent continuous variable underlying the ordinal outcome (location), while also modeling heterogeneity in the variance of this latent variable (scale) across subjects and other grouping factors. Specifically, the location component models how predictors influence the latent propensity that determines the probability of an observation falling into each ordered category. The scale component allows for variability in the latent variance, which can depend on predictors or vary across groups (e.g., students, lecturers), thereby capturing individual or contextual differences in the precision of the latent trait.
Importantly, we introduce a latent location-scale model that accounts for individual differences in students’ response styles when evaluating course quality. Response styles refer to consistent patterns in how individuals use rating scales, such as a tendency toward extreme or moderate responding, independent of item content (Paulhus, 1991), and are known to bias questionnaire-based inference(e.g., De Jong et al., 2008; Dolnicar & Grün, 2009)In the present model, such differences are captured by allowing the scale parameter to vary across individuals and contextual factors, thereby modeling heterogeneity in the latent variance of responses. As shown by Hedeker et al. (2016), this location-scale formulation separates effects on the latent evaluation level from systematic differences in response precision, leading to more accurate estimation of predictor effects.
The mixed-effects location-scale model, as extended by Quansah et al. (2024), incorporates both fixed effects, representing general relationships between predictors and the latent evaluation propensity, and random effects, capturing residual variability among students, lecturers, and courses. These random effects allow the model to represent multiple sources of variability inherent in the evaluation process. First, students differ in their general severity or leniency when evaluating courses and lectures. This variability reflects not only individual differences in evaluation tendencies but may also be influenced by response styles, such as extreme responding or acquiescence (Dolnicar & Grün, 2009). Second, even after accounting for predictors, lecturers may still receive systematically different ratings from students, suggesting that unmeasured lecturer characteristics (e.g., teaching style, charisma) influence evaluations. Third, substantial variation in course evaluations indicates that course-specific factors impact ratings beyond the included predictors. Additionally, interactions between predictors, such as lecturer likeability moderating the effect of course difficulty on evaluations, are incorporated into the model to account for complex relationships.
Measurement error in questionnaire data can bias regression slope estimates and undermine the validity of model conclusions (e.g., Luijken et al., 2019, 2022). Aggregation of individual questionnaire items was therefore performed using arithmetic means rather than medians. Although medians are sometimes preferred for ordinal items, in the present analysis the choice of aggregation function does not affect substantive inference. This is because aggregated scores are not treated as observed predictors, but as noisy indicators of latent true scores within a measurement-error framework. Specifically, the observed mean score enters the model only as an error-prone measurement of an underlying latent variable, with uncertainty explicitly modeled and propagated through posterior inference. As a result, differences between means and medians at the observed scale level are absorbed by the measurement-error component of the model, and inference is driven by the latent predictors rather than by distributional properties of the observed aggregates.
Building on the 4-parameter mixed-effects location-scale probit model (MELSCPM) by Hedeker et al. (2016), we introduced measurement error corrections for predictors and interactions within a Bayesian framework (Bürkner, 2021). Our model incorporates four item parameters: difficulty, discrimination, scale, and scale discrimination. The difficulty parameter determines the threshold at which an individual is likely to endorse a higher response category. The discrimination parameter reflects how well an item differentiates between individuals at different levels of the latent trait. The scale parameter captures variability in response precision across individuals, while the scale discrimination parameter represents how strongly this variability differs across individuals.
Simultaneously, the model estimates both the location (µ) and scale (σ) parameters within a single Bayesian inferential framework. The location parameter (µ) represents an individual's level on the latent trait, while the scale parameter (σ) accounts for heterogeneity in response precision by modeling differences in latent variance across individuals.
To provide an overview before discussing the detailed formulation, the general structure of the MELSCPM is as follows: Item Parameters Difficulty: Captures the relative position of each item on the latent scale. Discrimination: Represents how strongly each item distinguishes between subjects on the latent location parameter. Scale: Represents the residual variance of the latent response variable for a given item. Items with larger scale parameters exhibit greater variability in response precision, meaning participants’ latent responses are more spread out. Scale Discrimination: Captures how strongly an item is influenced by individual differences in response variability. Higher scale discrimination means the item is more sensitive to variations in response precision among participants. Measurement Error Correction
Measurement error is explicitly modeled for selected predictors to obtain unbiased slope estimates and reduce attenuation bias. Random Effects
Random effects are included at two levels: Student-level: Random intercepts and slopes capture individual-level variability in both location and scale, with location and scale random effects allowed to be correlated. Instructor- and session-level effects: Random intercepts account for clustering effects, capturing systematic differences across instructors, classes, or lectures. Interaction terms Fixed effects include interactions between the predictor ‘likeability’ and latent predictors from the student questionnaire, allowing the effect of these predictors to depend on perceived likeability.
The latent 4-parameter probit location-scale model for ordinal data is given by:


Regarding the measurement error correction, we define the following:
Let 
The random effects are assumed to follow normal distributions:


Covariance Matrix for Random Student Location Effects (
The covariance matrix for student-specific random location effects is defined as:
The diagonal elements The off-diagonal elements Covariance Matrix for Random Lecturer Effects (
The covariance matrix for lecturer-specific random effects is given by:
The diagonal elements The off-diagonal elements Variance of Random Student Scale Effect (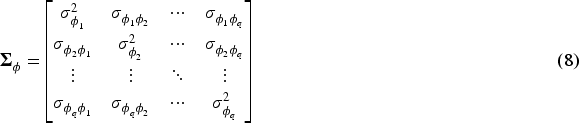
The variance
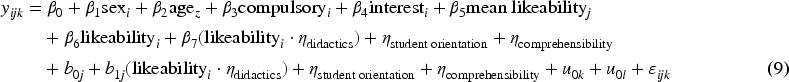
The fixed effects of the model included: Likeability of the lecturer. Mean didactics score (with measurement error). Mean perceived student-centered approach score (with measurement error). Mean perceived comprehensibility score (with measurement error). Interaction between likeability of the lecturer and the above three scores.
The random effect's structure was specified as: Random intercept for lecturer. Random intercept for course. Random intercept and random slopes for raters to account for individual differences in mixed effects. Random scale intercept for raters: Representing the discrimination parameter in the probit model.
Perceived lecturer likeability was considered a relevant variable in predicting course and lecture ratings (e.g., Clayson, 2022; Feistauer & Richter, 2018). Unlike in previous studies, we hypothesized that perceived likeability would moderate the relationship between evaluation scale scores and overall course ratings. Specifically, we expected the association between scale scores and course evaluations to be stronger when lecturers were rated as more likable. To test this hypothesis, we included pairwise interaction terms between likeability scores and the evaluation scale scores in the model. In addition, the average likeability score for each lecturer across courses and lectures was included as a predictor to account for between-lecturer variance in evaluation outcomes.
The complete model can be represented as follows:
Regarding the measurement error component correction we estimated scale reliability using Guttman Lambda 6 from the “psych” package (Revelle, 2023). Based on this reliability estimate, the standard error of measurement σɛ was computed as
The model was estimated using Stan via the “brms” package. Stan utilizes the No-U-Turn Sampler (NUTS), a variant of the Hamiltonian Monte Carlo method, to sample from the joint posterior distribution defined by the model. Four independent chains were run, each with 2,000 iterations, including 1,000 warm-up iterations, resulting in a total of 4,000 post-warmup samples. Posterior diagnostics indicated convergence, as all R^ values were approximately 1 and no divergences were reported.
Results are discussed separately for courses and lectures, although fixed-effect estimates are summarized jointly in Table 2. All results reported below are posterior summaries derived from the joint posterior distribution of the Bayesian location-scale model.
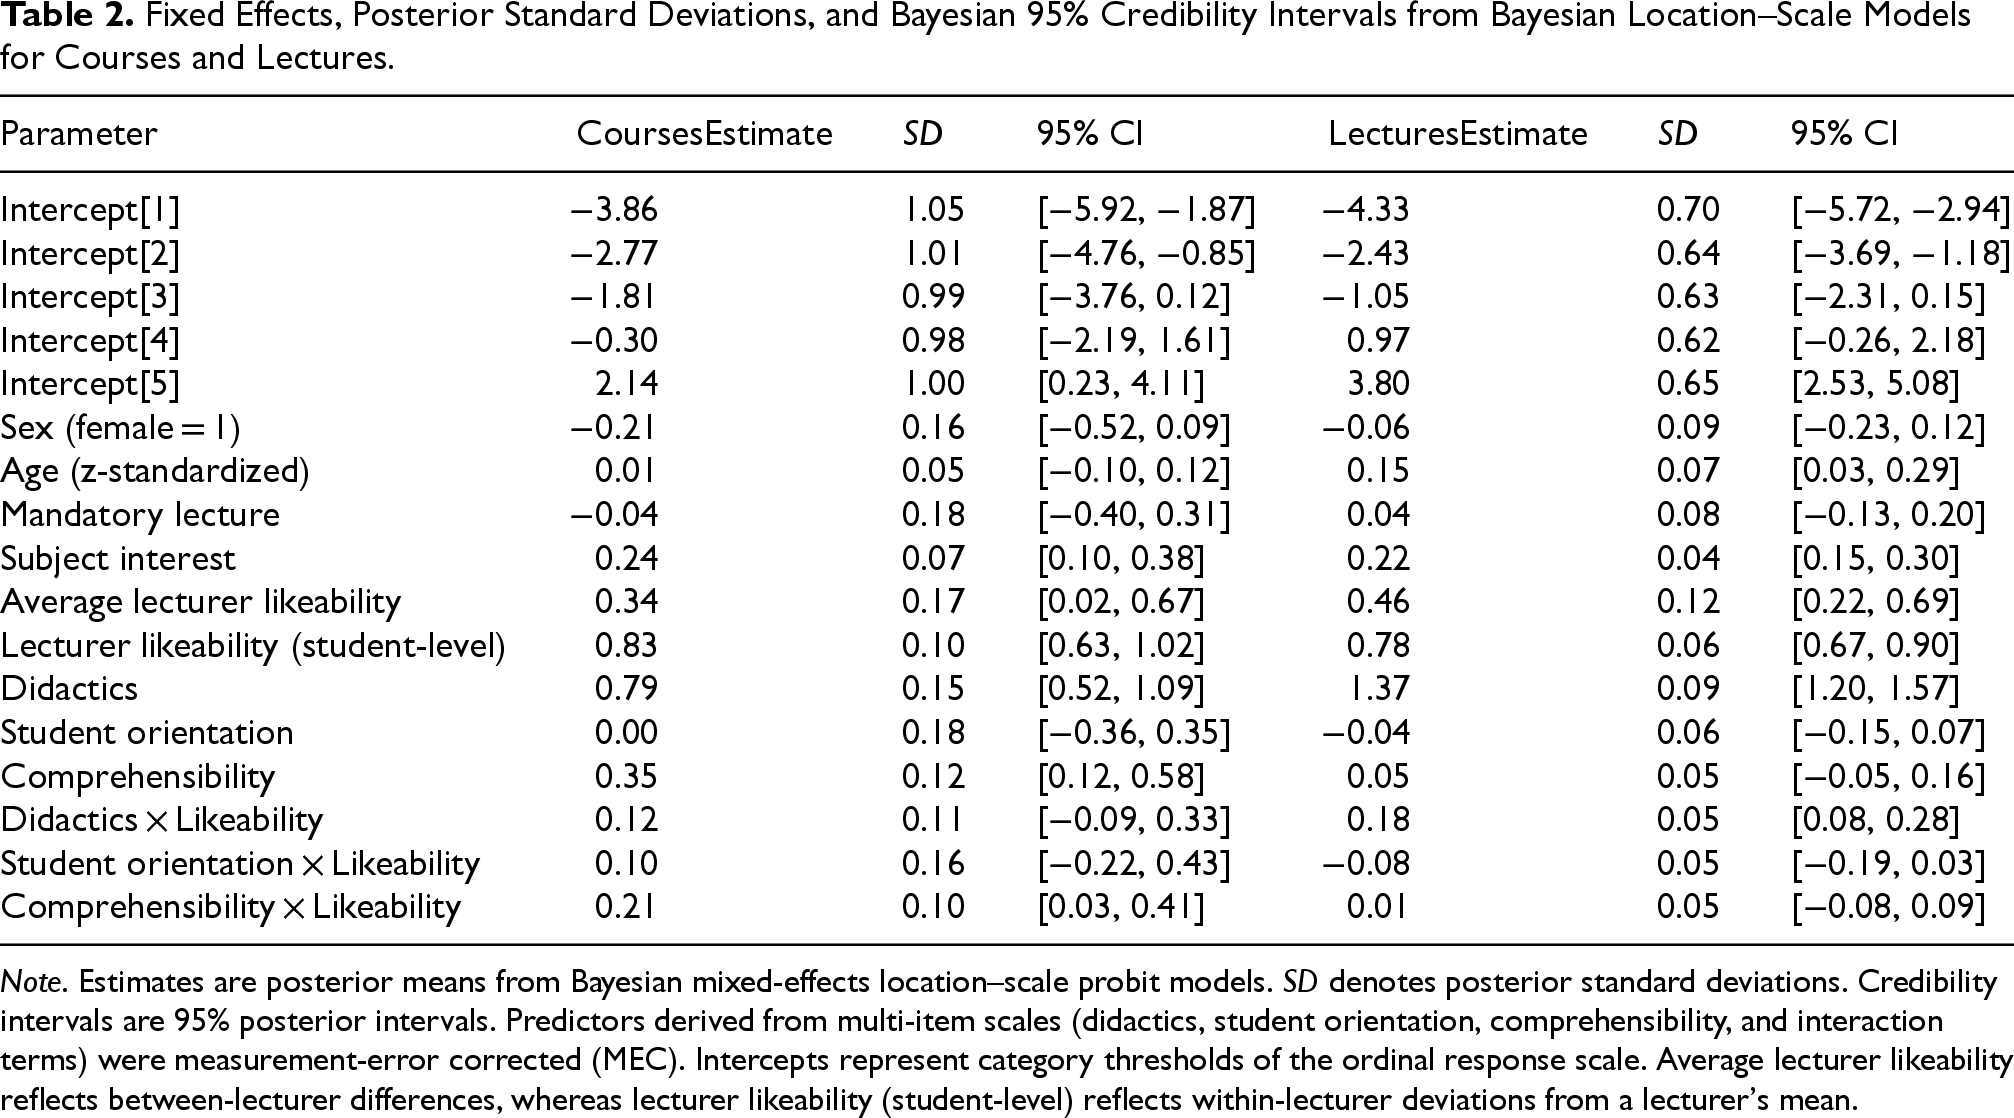
Fixed Effects, Posterior Standard Deviations, and Bayesian 95% Credibility Intervals from Bayesian Location–Scale Models for Courses and Lectures.
Fixed Effects, Posterior Standard Deviations, and Bayesian 95% Credibility Intervals from Bayesian Location–Scale Models for Courses and Lectures.
Note. Estimates are posterior means from Bayesian mixed-effects location–scale probit models. SD denotes posterior standard deviations. Credibility intervals are 95% posterior intervals. Predictors derived from multi-item scales (didactics, student orientation, comprehensibility, and interaction terms) were measurement-error corrected (MEC). Intercepts represent category thresholds of the ordinal response scale. Average lecturer likeability reflects between-lecturer differences, whereas lecturer likeability (student-level) reflects within-lecturer deviations from a lecturer's mean.
Sample Description
Data were collected from 198 unique courses, with a total sample of n = 2,721 students. Of these, 40% were enrolled in a Bachelor's program, 21% in a Master's program, and 39% in a state examination program. The sample consisted of 85% women and 15% men, mirroring the typical gender distribution in the study programs. This imbalance could introduce some bias and should be kept in mind when interpreting the results. Importantly, the present data are used primarily to illustrate the proposed modeling framework rather than to support population-level generalizations about student evaluations of teaching.
Description of Missing Values
The proportion of missing values across variables used in the model analysis included ranged from 0 to 10.03% (M = 2.81%, SD = 2.05%), with a median proportion of missing data of 2.29%, and 75% of the variables having missing proportions below 3.31%. We imputed missing values for non-identifier predictor variables used in the regression model. Predictive mean matching (e.g., Little, 1988) was applied to impute missing values in mean response scores, while polytomous regression imputation was used for categorical single items related to the interest in the subject and the lecturer's likeability, as implemented in the R package “mice” (Buuren & Groothuis-Oudshoorn, 2011).
Fixed Effects Summary: Course and Lecture Evaluations
The model yielded posterior estimates for fixed effects for intercepts and covariates for both course and lecture evaluations. Results for the two models are reported jointly in Table 2, allowing direct comparison of parameter estimates across instructional formats.
The results, presented in Table 2, highlight strong posterior evidence for an effect of lecturer likeability (posterior mean β = 0.83, 95% CI [0.63, 1.02]), didactics (β = 0.79, 95% CI [0.52, 1.09]), and comprehensibility (β = 0.35, 95% CI [0.12, 0.58]) on overall course ratings. Likeability also showed a notable interaction with comprehensibility (β = 0.21, 95% CI [0.03, 0.41]), indicating that the slope of either predictor with the overall course evaluation increased by 0.21 for higher levels of the other predictor. It is important to note that statistical interactions are symmetrical unless there is strong evidence to suggest a directional causal influence (e.g., from likeability to comprehensibility). Given our research design, in which students rated course likeability alongside other predictors and provided the overall evaluation at the end of the semester, we consider such a causal interpretation unlikely in this context. Interactions with other predictors were minimal, and variables such as sex, age, and course type (mandatory vs. elective), as well as their interactions, did not show meaningful effects.
Random Effects Summary
The model estimated random effects for intercepts, slopes, and the scale component in the course evaluations. Due to its length, the complete mixed-effects model output is reported in the electronic appendix at https://osf.io/emd42/overview. Detailed results are summarized below:
Random Intercepts
Lecturer-Level Variability: The standard deviation at the lecturer level (σ = 0.21, 95% CI [0.01, 0.52]) suggests that lecturers differed systematically in their baseline evaluations. Specifically, some lecturers consistently received higher ratings, whereas others received lower ratings, independent of the other predictors included in the model.
Participant-Level Variability: The intercept standard deviation at the participant (student) level (σ = 0.19, 95% CI [0.01, 0.48]) reflects individual differences in overall rating tendencies. This indicates that some students were generally more lenient, whereas others were more severe in their evaluations.
Course-Level Variability: The substantial standard deviation at the course level (σ = 0.54, 95% CI [0.33, 0.78]) further indicates that evaluations varied according to specific course contexts. Factors such as course content or structure likely contributed to these differences in baseline ratings.
Implications of Random Slopes
Likeability: The slope standard deviation for likeability (σ = 0.10, 95% CI [0.00, 0.29]) reflects heterogeneity in the influence of lecturer likeability across students. While for some students likeability constituted a substantial predictor of course evaluations, for others its effect was comparatively negligible, indicating variability in the weight attributed to this characteristic.
Didactics: The random slope variance for didactics (σ = 0.14, 95% CI [0.01, 0.38]) indicates heterogeneity in students’ sensitivity to the didactic quality of teaching. For some students, variation in didactic quality exerted a strong influence on their evaluations, whereas for others its effect was comparatively limited.
Other Predictors: Additional predictors showed similar heterogeneity: Comprehensibility: The standard deviation (σ = 0.187, 95% CI [0.006, 0.500]) reflects moderate variability in its importance across students. Student Orientation: The standard deviation (σ = 0.209, 95% CI [0.008, 0.574]) indicates that the perceived importance of student orientation also differs among students.
Interaction Effects: The slopes for the interaction terms, such as didactics × likeability (σ = 0.07, 95% CI [0.00, 0.19]) and student orientation × likeability (σ = 0.12, 95% CI [0.01, 0.32]), were smaller but not negligible. This suggests that the extent to which the effects of didactics or student orientation vary with different levels of likeability differs across students.
Scale Factor: In addition to intercept and slope variations, the model's scale component revealed substantial variability in response precision among students (σ = 0.54, 95% CI [0.39, 0.71]). This indicates that, independent of all other predictors and random effects, students employed the rating scale in idiosyncratic ways. Some students exhibited a wide dispersion in their responses, reflecting an “extreme” or variable response style, whereas others applied the scale more consistently.
Sample Description
Data were collected from 40 unique lectures. The sample comprised 2,631 participants enrolled in various programs: 48% were pursuing a Bachelor's degree, 14% were enrolled in a Master's program, and 37% were enrolled in a state examination program. The sex distribution was 15% male and 85% female.
Description of Missing Values
The proportion of missing values across variables used in the model analysis included ranged from 0 to 8% (M = 2%, SD = 2%), with a median proportion of missing data of 2%, and 75% of the variables having missing proportions below 3%. We imputed missing values for non-identifier predictor variables used in the regression model. Predictive mean matching (e.g., Little, 1988) was applied to impute missing values in mean response scores, while polytomous regression imputation was used for categorical single items related to the interest in the subject and the lecturer's likeability, as implemented in the R package “mice” (Buuren & Groothuis-Oudshoorn, 2011).
Fixed Effects Summary: Course and Lecture Evaluations
Fixed effects for intercepts and covariates were estimated separately for course and lecture evaluations. For conciseness and comparability, parameter estimates from both models are reported jointly in Table 2.
The results highlight the strong positive effects of likeability for the lecturer (β = 0.78, 95% CI [0.67, 0.90]) and didactics ratings (β = 1.37, 95% CI [1.20, 1.57]) on the outcomes. A small positive effect of age (β = 0.15, 95% CI [0.03, 0.29]) and a positive interaction between didactics and likeability (β = 0.18, 95% CI [0.08, 0.28]) were also observed. The interaction indicates that the slope of either “likeability” or “didactics” with the overall lecture evaluation score increased by 0.18 for a one-unit increase in the other predictor. As in the previous analysis, we emphasize that this interaction should not necessarily be interpreted causally. Other predictors, such as sex (β = −0.06, 95% CI [−0.23, 0.12]), mandatory course status (β = 0.04, 95% CI [−0.13, 0.20]), and their interactions with likeability, did not show substantial effects. Comprehensibility (β = 0.05, 95% CI [−0.05, 0.16]) and its interaction with likeability (β = 0.01, 95% CI [−0.08, 0.09]) showed small and uncertain effects.
Random Effects Summary
The model estimated random effects for intercepts, slopes, and the scale component in the course evaluations. Due to its length, the complete mixed-effects model output is reported in the electronic appendix at https://osf.io/emd42/overview. Detailed results are summarized below:
Random Intercepts
Lecturer-Level Variability (doz.code): The between-lecturer variability in intercepts (σ = 0.33, 95% CI [0.18, 0.50]) indicates systematic differences in baseline evaluations across lecturers. Specifically, some lecturers consistently received higher ratings, whereas others received lower ratings, independent of the other predictors in the model.
Participant-Level Variability (pers.code): The random intercept variance at the participant level (σ = 0.32, 95% CI [0.03, 0.56]) captures heterogeneity in overall rating tendencies across students. This suggests that some students systematically provided more lenient ratings, whereas others were consistently more severe, independent of the observed predictors in the model.
Course/Session-Level Variability (veranstaltungsnr): Although smaller in magnitude (σ = 0.19, 95% CI [0.04, 0.36]), the random intercept variance at the course/session level indicates that contextual factors, such as course content or delivery style, also contributed to variability in baseline ratings across lecture sessions.
Implications of Random Slopes
Likeability: The random slope variance for likeability (σ = 0.14, 95% CI [0.01, 0.33]) reflects heterogeneity in the effect of lecturer likeability across students. This suggests that for some students, likeability functioned as a decisive predictor of evaluations, whereas for others its influence was relatively limited.
Didactics: The random slope variance for didactics (σ = 0.20, 95% CI [0.01, 0.43]) captures heterogeneity in students’ sensitivity to instructional quality. For some students, didactic quality exerted a strong influence on their overall evaluations, whereas for others its effect was comparatively limited.
Other Predictors: The random slope variances for student orientation (σ = 0.14, 95% CI [0.01, 0.37]) and comprehensibility (σ = 0.12, 95% CI [0.00, 0.33]) indicate heterogeneity in how these predictors influenced evaluations across students. Although smaller in magnitude compared to the variance for didactics, these components nonetheless capture meaningful differences in the extent to which individual
Interaction Effects: The random slope variances for the interaction terms, didactics × likeability (σ = 0.06, 95% CI [0.00, 0.18]) and student orientation × likeability (σ = 0.09, 95% CI [0.00, 0.25]), were smaller but not negligible. These variance components indicate heterogeneity in how the effects of didactics and student orientation shifted with varying levels of likeability across students.
Scale Factor: Beyond these intercept and slope variations, the model's scale component revealed substantial heterogeneity in residual scale parameters (σ = 0.46, 95% CI [0.37, 0.55]). Within a multilevel heteroskedasticity framework, this indicates that, independent of all other predictors and random effects, students differed in the precision of their responses. Some students displayed greater residual dispersion (i.e., more variable ratings), whereas others demonstrated more uniform use of the response scale meaning that they used the rating scale in rather idiosyncratic ways.
Discussion
The present study examined student evaluations of teaching using a Bayesian mixed-effects location–scale probit model that jointly captures effects on the latent mean evaluation and heterogeneity in response precision. By explicitly modeling hierarchical dependence, response-style variability, and measurement error in key predictors, the analysis was designed to improve statistical inference for ordinal evaluation data rather than to re-evaluate substantive debates about the validity of student evaluations per se.
Across both course and lecture formats, didactic quality and lecturer likeability emerged as the strongest predictors of overall evaluations, with additional contributions from comprehensibility. For courses, we observed an interaction indicating that comprehensibility was rated more favorably when lecturers were seen as likeable. Similarly, in lectures, there was an interaction between likeability and didactic quality. These patterns align with research highlighting how both interpersonal and instructional factors shape students’ evaluations. Within the present modeling framework, however, these effects are interpreted as influences on the latent evaluation propensity, conditional on the explicit separation of mean structure and response variability.
A central finding of the study concerns the scale component of the model. Substantial heterogeneity in response precision was observed at the student level for both courses and lectures, even after accounting for observed predictors and random effects. This indicates that students differ systematically in how consistently they use rating scales, independent of their average evaluation tendencies. Such response-style heterogeneity implies that variation in observed ratings reflects not only differences in perceived teaching quality but also individual differences in rating behavior. Standard analyses based on mean scores or mean-based mixed models are unable to separate these sources of variation and therefore may conflate substantive effects with stylistic noise.
From a methodological perspective, the results illustrate how Bayesian location-scale modeling provides additional inferential information beyond conventional approaches. By jointly estimating location and scale parameters, the model distinguishes predictors that shift average evaluations from those associated with changes in response variability. In the present application, a nontrivial portion of heterogeneity in evaluations was attributable to differences in response precision rather than to differences in teaching-related characteristics. This finding underscores that modeling variability itself (not only mean effects) can be important for improving inference in ordinal data settings of similar hierarchical structure.
Although the empirical illustration is drawn from a single institution and a limited set of disciplines, the modeling approach is applicable to other settings involving ordinal ratings with heterogeneous response precision, such as peer review or performance appraisal. In these contexts, ignoring response-style variability can distort inference.
Several limitations should be noted. Likeability was measured only at the end of the semester and likely reflects a composite judgment incorporating both interpersonal and instructional aspects, complicating causal interpretation. Moreover, the data stem from a single institutional context, and generalization to other disciplinary cultures or evaluation systems should be made cautiously. Future research should apply location-scale modeling to broader institutional samples, incorporate repeated or longitudinal evaluations, and explore designs that allow clearer temporal separation of teaching-related and interpersonal factors. The gender imbalance in the sample, with a predominance of female respondents, represents a further limitation and may influence observed evaluation patterns. However, because the data are used primarily to demonstrate the usefulness and interpretability of the proposed location-scale modeling framework, this imbalance does not undermine the methodological illustration of the model's inferential properties.
In conclusion, valid inferences from student evaluation data (and data with similar structures) require models that account for both mean structure and response variability. The proposed latent Bayesian location–scale can offer a way to separate substantive effects from response-style and measurement-related variation in ordinal evaluation data.
Footnotes
Ethical Considerations
Formal approval from an ethics committee was not required for this study. The data were collected exclusively within the framework of the university’s mandatory teaching evaluation procedures, which are conducted for purposes of quality assurance in higher education. In line with German higher education regulations (e.g., § 5 Hochschulrahmengesetz and corresponding state-level university laws) and with the requirements of the EU General Data Protection Regulation (GDPR, Regulation (EU) 2016/679), such data are exempt from ethics review when they are gathered anonymously and without any possibility of re-identification. For the present study, all data were obtained in fully anonymous form, and no personal or identifiable information was collected or processed at any stage.
Funding
The authors received no financial support for the research, authorship, and/or publication of this article.
Declaration of Conflicting Interests
The authors declared no potential conflicts of interest with respect to the research, authorship, and/or publication of this article.