
Abstract
Background: Research on sleep disorders has gained significant attention in recent years, particularly within the diabetic population. This study aimed to assess sleep quality in patients with T2D and identify the factors associated with poor sleep quality. Methods: We conducted a cross-sectional descriptive observational study including adult patients with T2D. Sleep data were collected using the Pittsburgh Sleep Quality Index (PSQI) to assess the sleep quality. Results: A total of 156 patients were recruited with a mean age of 57.04 ± 9.49 years. The mean duration of diabetes was 13.12 ± 8.14 years. The mean total PSQI score was 8.42 ± 4.02, and poor sleep quality was observed in 70.5% of the study population. Our study revealed a significant association between poor sleep quality and diabetic neuropathy (P = 0.03), low levels of HDL cholesterol (P = 0.008) as well as the use of sulfonylurea (P = 0.02). The total PSQI score was positively correlated with the DN4 score (P = 0.04) and inversely correlated with the daily physical activity score (P = 0.019) as well as the total score of Ricci and Gagnon (P = 0.02). Poor sleep quality was independently associated with sulfonylurea use (P = 0.037; OR = 5.27). Conclusion: Our study highlights the importance of integrating sleep management into the care of diabetic patients.
Introduction
The prevalence of type 2 diabetes (T2D) continues to rise, making it a significant public health concern. According to the most recent data released by the International Diabetes Federation (IDF), 537 million people worldwide are living with T2D, and projections suggest this number will increase to 643 million by 2030. 1
The etiopathogenesis of T2D is complex and multifactorial, involving interactions between genetic, environmental and behavioral factors. Among these different factors, sleep disorders have become a topic with growing interest. Indeed, research on sleep disorders, extensively studied in obese individuals, has gained significant interest in recent years within the diabetic population.
Studies have shown that poor sleep quality increases insulin resistance, reduces acute insulin response to glucose, and elevates nocturnal cortisol secretion. 2 These effects lead to diabetes imbalance and a higher risk of complications. Additionally, sleep disorders may increase ghrelin levels, decrease leptin levels and disrupt appetite regulation, contributing to weight gain. 3 Other authors have demonstrated that poor sleep quality is associated with endothelial dysfunction, elevated inflammatory markers, and consequently the activation of low-grade systemic inflammation. 4
On the other hand, diabetes can significantly impair sleep quality. This phenomenon is primarily linked to glycemic instability, related to episodes of nocturnal hypoglycemia or nocturia secondary to hyperglycemia. 5 Furthermore, diabetes-related complications, such as pain from diabetic neuropathy or peripheral artery disease, can also influence sleep quality in these patients.
Thus, sleep disorders and diabetes imbalance act synergistically and mutually reinforce each other.
Addressing sleep disorders in diabetic individuals could play a crucial role in breaking this vicious cycle and lead to a significant improvement in diabetes management, quality of life, and a reduction in the risk of associated complications.
This study aimed to assess sleep quality in patients with T2D and identify the factors associated with poor sleep quality.
Methods
Study Design and Population
A total of 156 patients who sought care at the Department of Nutritional Diseases (D) of the Institute of Nutrition and Food Technology of Tunis, Tunisia from October 1, 2024 to December 30, 2024 were enrolled, including patients of both genders, aged between 18 and 70 years, followed for T2D and treated for at least 6 months were considered non-eligible patients working night shifts (any work performed between 9 PM and 6 AM), those with poorly controlled thyroid disorders, psychiatric illnesses, those taking antipsychotic medications, patients with alcohol and/or substance use disorders, patients with severe cognitive or mental disorders, patients with a personal history of respiratory diseases (asthma, chronic obstructive pulmonary disease, chronic respiratory failure), patients who had experienced a cardiovascular event in the previous two months (stroke, myocardial infarction), and patients who had undergone surgery in the previous two months.
All data concerning socio-demographic and economic characteristics, general medical history and co-morbid conditions were collected by interview.
Specific Characteristics of Diabetes
The specific characteristics of diabetes were recorded, including the patient’s age at the time of diabetes diagnosis, the duration of diabetes, and the diabetes treatment. Glycemic control was evaluated for each patient based on the target HbA1c specific to each individual, as defined by the ADA 2024 guidelines. 6 We considered follow-up to be regular if the patient consulted their primary care physician at least every 6 months. Early onset T2D was defined as occurring before the age of 40. 7 We identified the metabolic complications of diabetes, including the occurrence of ketosis or diabetic ketoacidosis in the past year, and episodes of hypoglycemia in the last month.
The diagnosis of diabetic retinopathy (DR) was based on the results of a fundus examination, as documented in the medical record. DR was then classified according to the American Academy of Ophthalmology’s classification: mild non-proliferative DR, moderate non-proliferative DR, severe non-proliferative DR, and proliferative DR. 8
Diabetic nephropathy was defined by a 24-hour albuminuria ≥30 mg/24 h or an albumin-to-creatinine ratio ≥30 mg/g, confirmed twice, and/or a persistent creatinine clearance ≤60 mL/min/1.73 m2 over a period of 3 months. 9
Peripheral diabetic neuropathy was assessed through the DN4 questionnaire, which was considered pathological if the score was 4 or higher. 10
Diabetic autonomic neuropathy was assessed based on the presence of gastric paresis (confirmed by a gastric scintigraphy), orthostatic hypotension (diagnosed if systolic blood pressure decreased by ≥ 20 mmHg and/or diastolic by ≥ 10 mmHg 3 minutes after standing up), resting tachycardia, erectile dysfunction. Other manifestations of autonomic neuropathy such as motor diarrhea, chronic constipation, neurogenic bladder, and sweating disorders were also assessed through questioning.
Macrovascular complications were investigated, including cerebrovascular accident, coronary artery disease, diagnosed if the patient had a known history of coronary artery disease. We also explored the presence of previous lower limb amputations, trophic disorders such as ulcers or gangrene, intermittent claudication, and absent peripheral pulses upon examination.
Every patient underwent a thorough physical examination, which was complemented with anthropometric measurements.
Biochemical analyses were conducted for all patients, as part of the routine management including glycemic parameters, lipidic parameters, hepatic and liver function tests. According to the 2019 recommendations of the European Society of Cardiology (ESC) and the European Atherosclerosis Society (EAS): Hypertriglyceridemia was defined as a triglyceride level greater than or equal to 1.5 g/L (1.7 mmol/l). Hypercholesterolemia was defined as a total cholesterol level greater than or equal to 2 g/L (5.2 mmol/l). Hypo-HDL cholesterolemia was defined as an HDL cholesterol level lower than 0.40 g/L (1.03 mmol/l) for men and 0.50 g/L (1.3 mmol/l) for women. 11
Patient’s Questionnaires
Ricci and Gagnon Questionnaire
The level of physical activity was assessed using the Ricci and Gagnon auto-questionnaire provided by the French National Authority for Health. 12 It consists of nine questions distributed across three dimensions: sedentary behaviors, leisure-time physical activities and daily physical activities. The total score is computed and classifies individuals into one of three categories: inactive (total score below 18), active (total score between 18 and 35), or very active (total score exceeding 35).
Pittsburgh Sleep Quality Index
The quality of sleep was assessed using the PSQI (Pittsburgh Sleep Quality Index) questionnaire in its validated Arabic version. This scale has 19 items and measures seven subcomponents of sleep quality: subjective sleep quality (C1), sleep onset latency (C2), sleep duration (C3), sleep efficiency (C4), sleep disturbances (C5), use of sleep medication (C6), and daytime dysfunction (C7). Each subcomponent is scored on a scale from 0 to 3, with higher scores indicating poorer sleep quality for that specific domain. The seven subcomponent scores are then summed to yield a global PSQI score, which ranges from 0 to 21. The total PSQI score was obtained by adding seven subscores. A PSQI score of 5 or lower classifies individuals as “good sleepers” (GS). A PSQI score strictly greater than 5 indicates sleep disturbance and classifies individuals as “poor sleepers” (PS).
Statistical Analysis
Data was collected and analyzed using the SPSS 25 program. Descriptive statistics are presented as means and standard deviations for continuous variables and frequencies and proportions for categorical variables. The student’s t-test was used to compare means and the chi-squared test for independence was employed for categorical variables. Paired t-test was used to compare means at baseline and after follow-up. In all analyses, a P value of <0.05 was considered statistically significant.
Sample Size
The required sample size was calculated using Cochran’s formula for estimating a single proportion, based on a previously reported prevalence of poor sleep quality of 23% among patients with type 2 diabetes. 13 The parameters used were: Z = 1.96 for a 95% confidence level, P = 0.23 (estimated prevalence) and d = 0.05 (margin of error). This yielded a minimum required sample size of 245 participants. However, due to time constraints and logistical limitations during the recruitment period, a total of 156 eligible patients were ultimately included in the study. Although the final sample size was lower than initially estimated, it remained sufficient to conduct relevant descriptive and exploratory analytical assessments.
Results
General Characteristics of the Study Population.
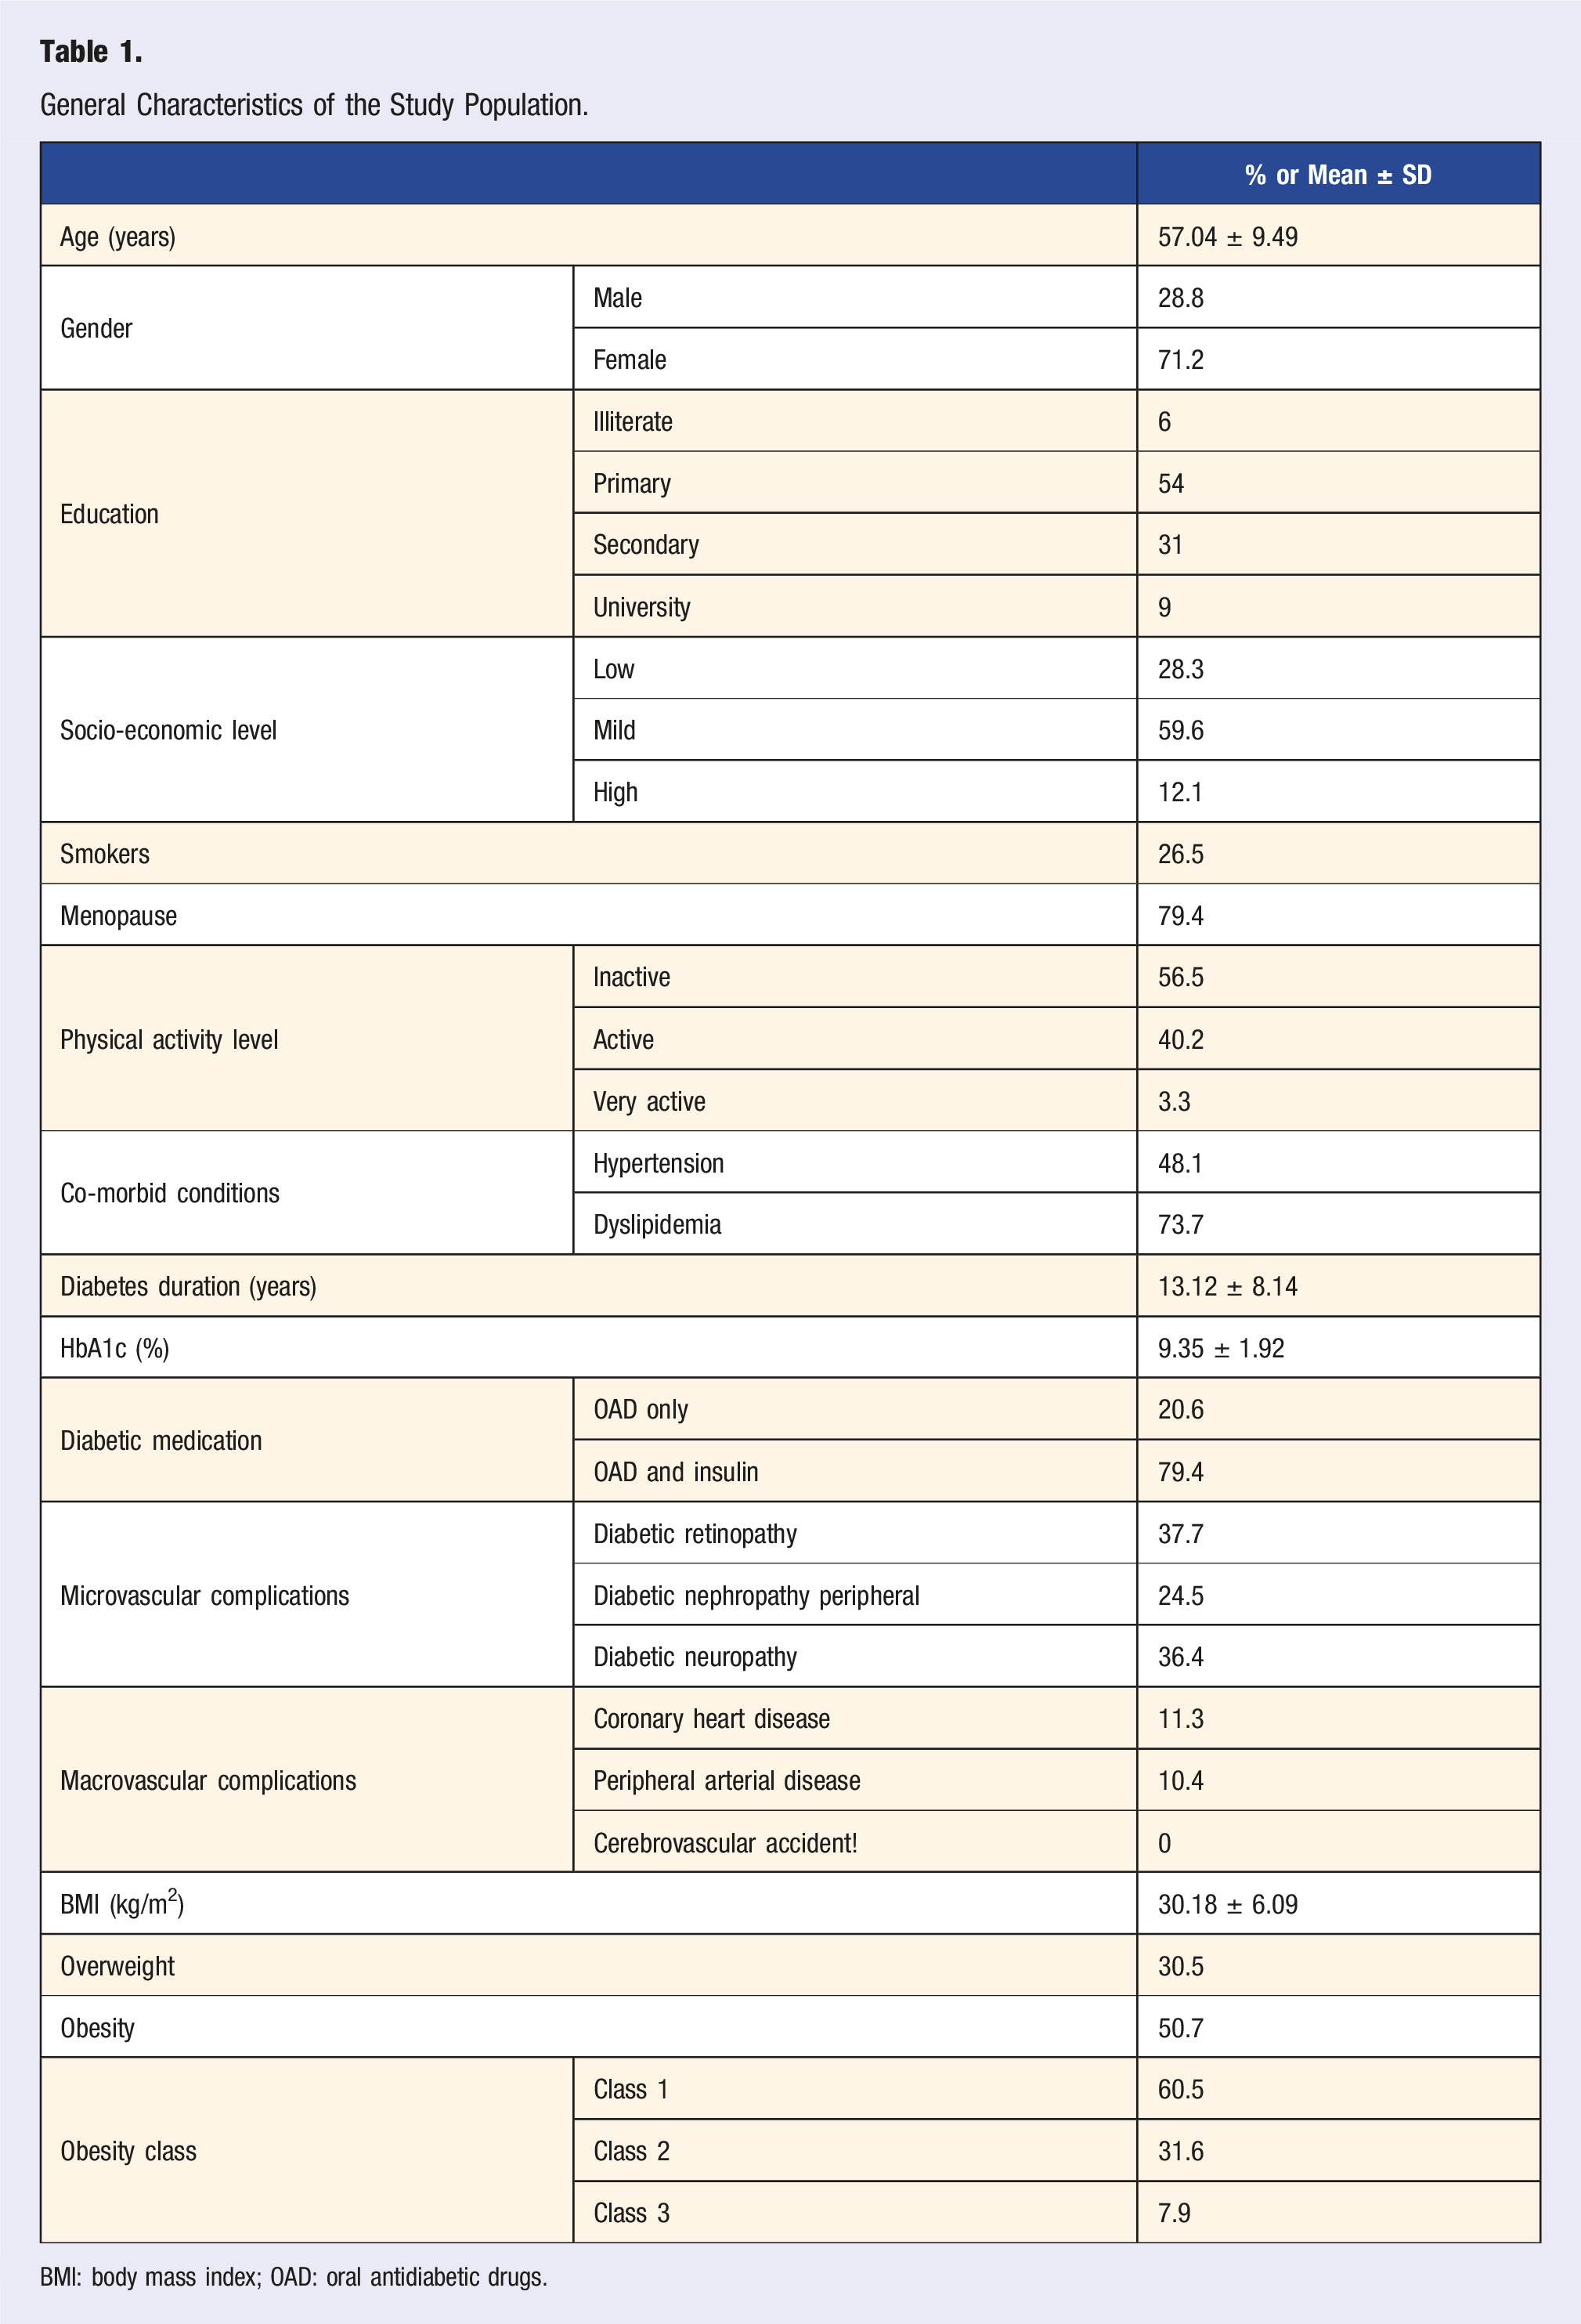
BMI: body mass index; OAD: oral antidiabetic drugs.
The mean total PSQI score was 8.42 ± 4.02 with extremes ranging from 1 to 19. Our study revealed that 70.5 % of patients had poor sleep quality.
Associations Between Clinical and Biological Factors and Sleep Quality.
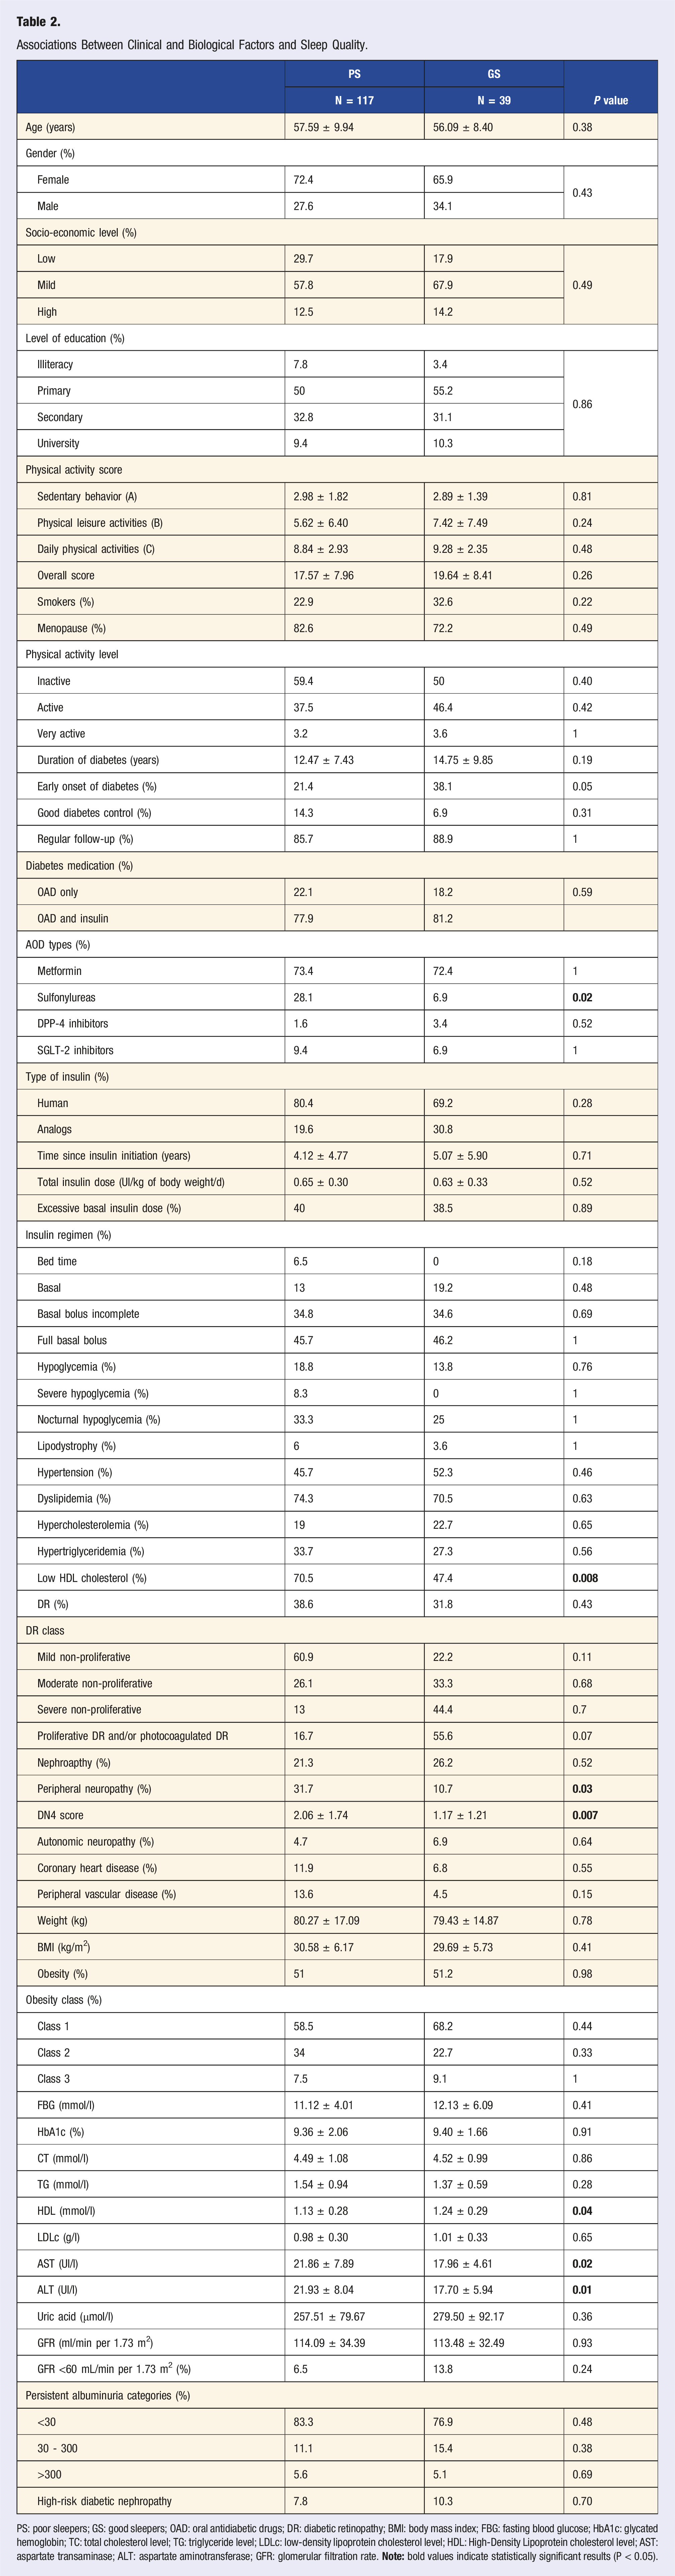
PS: poor sleepers; GS: good sleepers; OAD: oral antidiabetic drugs; DR: diabetic retinopathy; BMI: body mass index; FBG: fasting blood glucose; HbA1c: glycated hemoglobin; TC: total cholesterol level; TG: triglyceride level; LDLc: low-density lipoprotein cholesterol level; HDL: High-Density Lipoprotein cholesterol level; AST: aspartate transaminase; ALT: aspartate aminotransferase; GFR: glomerular filtration rate.
The total PSQI score was positively correlated with the DN4 score (P = 0.04), and inversely correlated with the score of daily physical activities (P = 0.019) as well as the total score of Ricci and Gagnon (P = 0.02).
Correlations Between Clinical and Biological Parameters and the Domains of the PSQI Score.
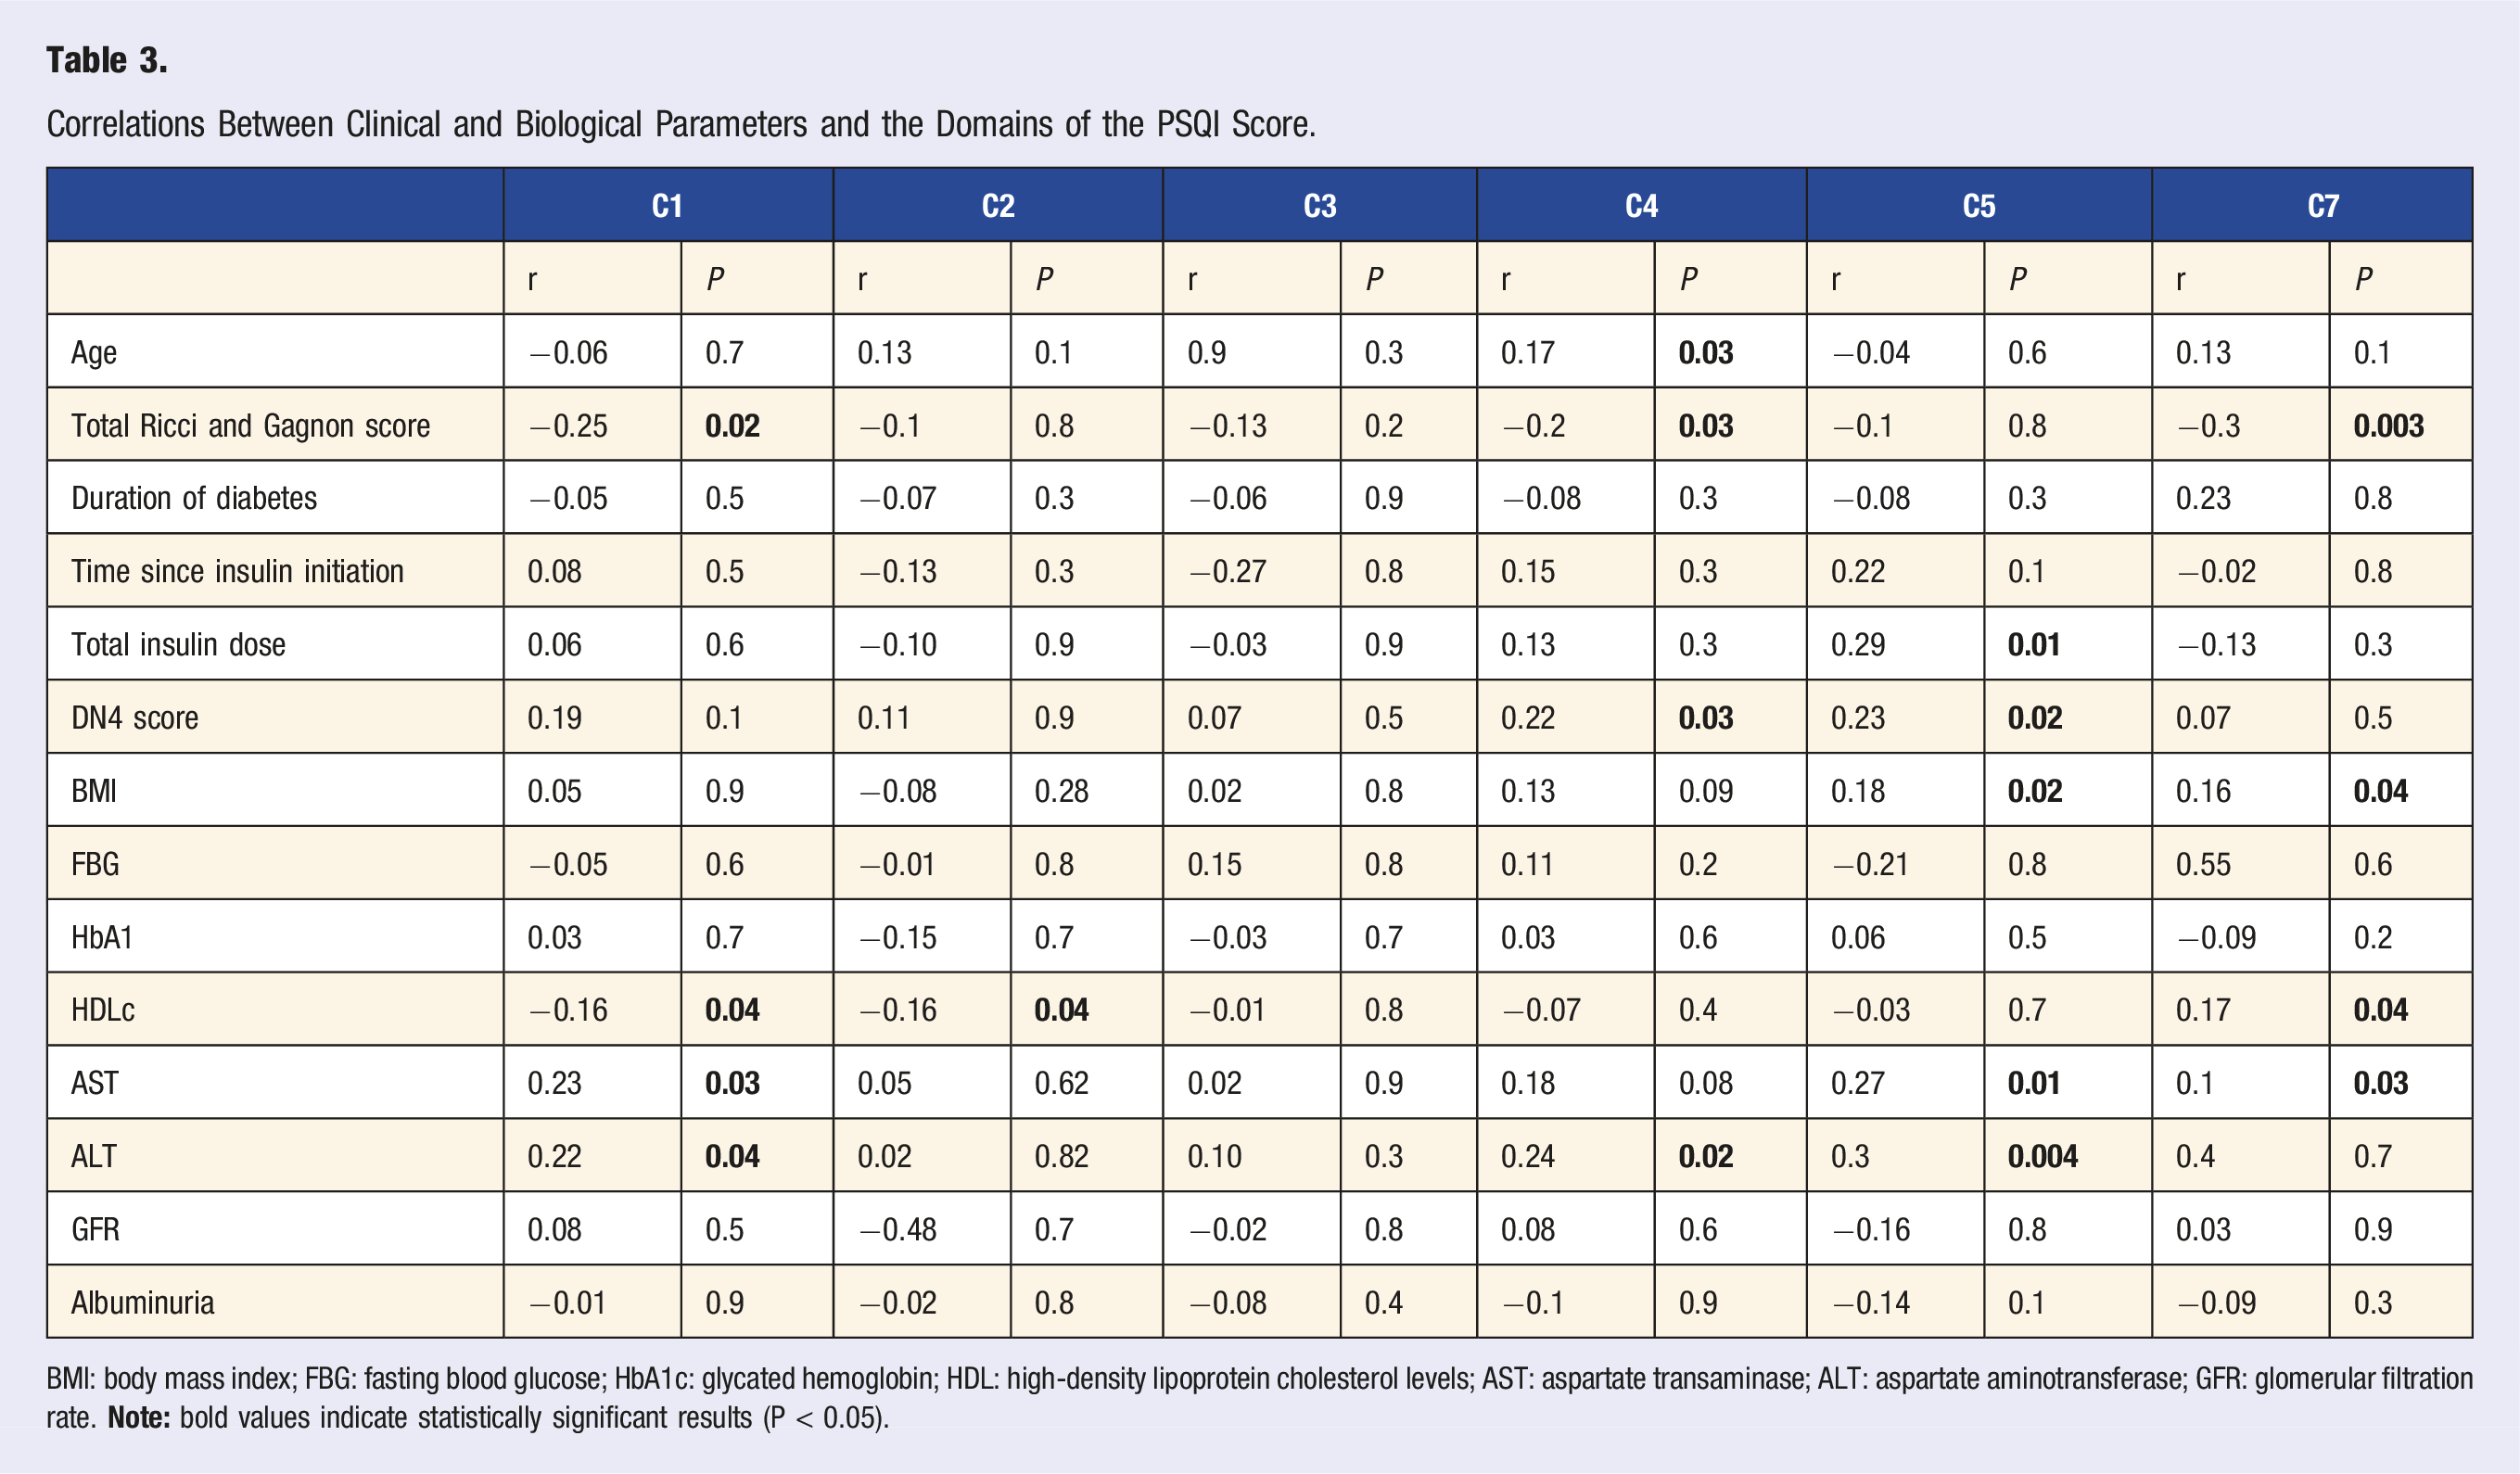
BMI: body mass index; FBG: fasting blood glucose; HbA1c: glycated hemoglobin; HDL: high-density lipoprotein cholesterol levels; AST: aspartate transaminase; ALT: aspartate aminotransferase; GFR: glomerular filtration rate.
Logistic regression analyses were performed to identify factors independently associated with sleep quality. The use of sulfonylureas was found to be independently associated with poor sleep quality (P = 0.037; OR = 5.27).
Discussion
While numerous international studies have primarily focused on sleep quality in populations with obesity, there has been a growing interest in recent years in studying sleep quality in individuals with type 2 diabetes. However, studies in Tunisia remain scarce.
Our study revealed that 70.5% of patients suffer from poor sleep quality as measured by the PSQI score. This rate was comparable to those reported by Ayaz et al and Ayinla et al as well as Barakat and al., which were 86%, 74% and 81%, respectively.14-16 However, other studies have reported lower prevalences, ranging from 34.8% to 47.1%.17,18 This could largely be explained by the use of different PSQI score thresholds to define poor sleep quality. Indeed, studies that used a threshold greater than 8 found lower prevalences. Additionally, differences in sample size and cultural factors may contribute to variations in sleep patterns and perceptions of sleep quality.
Our study revealed a statistically significant association between poor sleep quality and the use of sulfonylureas. In the multivariate analysis, patients using sulfonylureas had over a fivefold higher odd of reporting poor sleep quality (OR = 5.27). Based on the findings reported by Xue et al, involving over 11,000 T2D patients, non-metformin oral antidiabetic therapy, particularly sulfonylureas, was associated with a 1.24-fold higher likelihood of experiencing difficulty falling and staying asleep, compared to patients not on antidiabetic medications or those on metformin monotherapy. 19 Hypoglycemia due to the use of sulfonylurea may be the cause of this association. 20 In fact, episodes of low blood sugar can trigger stress hormone responses, including increased levels of adrenaline, growth hormone, and cortisol, leading to hyperarousal during the night. 21 This hyperarousal can significantly impair the ability to initiate and maintain sleep, particularly if hypoglycemic events occur close to bedtime or during sleep.
Regarding microvascular complications, our study showed that patients with poor sleep quality had a higher prevalence of peripheral diabetic neuropathy, with a significantly higher DN4 score in these patients. DN4 score was also correlated with less efficient sleep and more frequent sleep disturbances. The findings from our study validate earlier research in the literature.22,23 Diabetic neuropathy, a common complication of diabetes, is often associated with chronic pain, which has been linked to impaired sleep quality. This relationship has been widely discussed and involves numerous mechanisms. Chronic pain sensitizes the central nervous system, disturbing deep sleep stages, while both pain and diabetes interfere with circadian rhythms. 24 Furthermore, chronic inflammation and oxidative stress elevate pro-inflammatory cytokines, further disturbing sleep. 24 Finally, altered neurotransmitter regulation impairs pain management and sleep quality.
Moreover, our study revealed that patients with poor sleep quality had a significantly higher frequency of low HDL cholesterol levels. HDL cholesterol level was also inversely correlated with the score for subjective sleep quality, sleep latency, and poor daytime performance. These findings indicate a notable association between sleep quality and lipid profile in patients with type 2 diabetes. Several studies have highlighted a significant association between poor sleep quality and disturbances in the lipid profile, including a decrease in HDL cholesterol and an increase in total cholesterol and triglyceride levels.25-27 Various mechanisms may underlie this association. By raising triglycerides and decreasing HDL cholesterol, elevated cortisol levels caused by inadequate sleep may be a contributing factor to dyslipidemia. 28 Sleep deprivation also decreases insulin sensitivity, which exacerbates lipid abnormalities. 29 Additionally, chronic sleep disturbance can activate inflammatory pathways that negatively impact lipid metabolism, with inflammatory cytokines disrupting lipoprotein balance and increasing cardiovascular risk. 30
In the present study, significant negative correlations were found between the total score of the PSQI and the daily physical activity score, as well as the total score on the Ricci and Gagnon questionnaire. Additionally, the total score on the Ricci and Gagnon questionnaire was inversely correlated with subjective sleep quality, sleep latency, and poor daytime performance scores. In other words, lower levels of physical activity were associated with higher PSQI scores, indicating poorer sleep quality. Several interventional studies have been conducted with diabetic patients, demonstrating that physical and mind-body exercise interventions significantly improved sleep quality according to a recent systematic review of the literature. 31 Exercise affects sleep architecture by increasing non-rapid eye movement sleep, which is essential for restorative sleep, while decreasing rapid eye movement sleep, which lowers sleep onset latency. 32 Moreover, physical activity influences the regulation of hormones such as melatonin, cytokines, and serotonin, which play key roles in sleep-wake regulation and mood stabilization. 33 Furthermore, regular exercise also aids in the synchronization of circadian rhythms, improving sleep duration and quality. 34 Additionally, physical activity has been shown to reduce the prevalence of common sleep disturbances, including insomnia, daytime sleepiness and obstructive sleep apnea, which are frequently encountered in diabetic populations, promoting restorative sleep. 35
Our study demonstrated that patients with poor sleep quality exhibited significantly higher liver enzyme levels. This aligns with previous research reporting an association between poor sleep quality and non-alcoholic fatty liver disease.36,37 Current data have demonstrated that poor sleep can induce the production of pro-inflammatory cytokines, such as interleukin-6, which may contribute to liver inflammation and fat accumulation. 38 Additionally, lack of sleep can affect lipid metabolism and insulin sensitivity, which may result in increased hepatic fat deposition and insulin resistance. 39 Disruption of circadian rhythms, particularly through altered melatonin metabolism in patients with chronic liver disease, can further affect sleep quality and metabolic processes. 38
Study Limitations
This study provides valuable insights into the relationship between sleep quality and type 2 diabetes, contributing to a better understanding of how sleep disturbances affect diabetic patients.
Nevertheless, it has some limitations. First, the cross-sectional design precludes causal inference and does not allow determination of the directionality of associations. Second, although the sample size permitted exploratory analyses, it was smaller than the estimated requirement, potentially limiting the detection of some associations. Third, recruitment from a single tertiary care center may reflect a population with more severe diabetes, restricting the generalizability of the prevalence estimate. Finally, sleep quality was assessed only with the PSQI, a validated but subjective tool, without objective measures such as actigraphy or polysomnography or screening for sleep disorders like obstructive sleep apnea, which may have limited the accuracy of our findings.
Conclusion
Our study revealed a prevalence of poor sleep quality of 70.5% among middle-aged diabetic patients. These findings are consistent with data from the literature, which underscore the critical need to address sleep disturbances in individuals with T2D, as poor sleep quality is linked to multiple diabetes-related complications, including peripheral neuropathy, dyslipidemia, and liver dysfunction.
Our results suggest that the management of diabetes should also consider the impact of medications, such as sulfonylureas, on sleep quality and emphasize the importance of integrating strategies to improve sleep in the overall care plan for diabetic patients. Additionally, encouraging physical activity could be an effective approach to enhance the sleep quality and decrease its detrimental effects on metabolic health.
Future longitudinal studies are required to gain a better understanding of the mechanisms and causality behind the complex interactions between sleep, diabetes, and its complications.
Consent to Participate
Written informed consent was obtained from all participants.
Footnotes
Author’s contributions
Sana Khamassi and Emna Bornaz: study conception, data collection and analysis, manuscript drafting. Haifa Abdesselem, Fatma Boukhayatia, Kamilia Ounaissa: contributed to manuscript writing and interpretation of results. Chiraz Amrouche: supervised study design, implementation, and revised the final manuscript.
Declaration of conflicting interests
The authors declared no potential conflicts of interest with respect to the research, authorship, and/or publication of this article.
Funding
The authors received no financial support for the research, authorship, and/or publication of this article.
Ethical Consideration
Approval from the local ethics committee of the National Institute of Nutrition and Food Technology in Tunis was sought and granted on September, 17 (approval number 13/2924) This work has no conflicts of interest.
Data Availability Statement
The data that support the findings of this study are available upon request from the corresponding author. Contact details will be provided upon acceptance of the manuscript.