
Abstract
“Frailty, lower rest-activity rhythmic strength, intra-daily stability, and greater nighttime activity were significant independent predictors of all-cause mortality in older adults.”
Introduction
A decline in physiological functions and metabolic homeostasis accompanies aging. 1 The age-related alteration in metabolism is associated with unfavorable health outcomes, including neurodegenerative diseases, type II diabetes, and cardiovascular diseases (CVD).2,3 Metabolic syndrome (MetS) is a cluster of 5 metabolic abnormal conditions—abdominal obesity, hyperglycemia, hypertension, hypertriglyceridemia, and low high-density lipoprotein cholesterol (HDL-C) levels—individuals with at least 3 of these components are considered to have MetS. 4 According to the 2018 National Health and Nutrition Examination Survey (NHANES), the prevalence of MetS in the United States (U.S.) was 44.9% and 60.9% among middle-aged and older adults, respectively. 5 This suggests that MetS can develop earlier in life and become more prevalent with age. Given the well-established link between MetS and chronic diseases, 6 diagnosing MetS has become clinically crucial for predicting further morbidity and mortality in the growing aging population.
Metabolic changes are strong indicators of health risks, but their impact can differ among older adults due to variations in their rate of aging, leading to the concept of frailty. 7 Frailty is an age-related clinical syndrome marked by reduced physiological reserve, diminished resilience, and heightened susceptibility to stressors, and its process is known to accelerate with biological aging.8,9 Frail individuals are in a vulnerable state with a high risk of health problems, including cardiometabolic disease, falls, hospitalizations, disabilities, and mortality.10,11 Increasing evidence supports significant links between MetS and frailty, attributed to similar pathophysiological pathways that drive disease pathogenesis. 12 Indeed, frailty is highly prevalent among older adults with MetS,13,14 and their coexistence may exacerbate health risks such as accelerated inflammation or CVD.15,16 Yet, their complex interrelationship with future health risks, including mortality, remains underexplored and controversial, varying with population characteristics, measurement tools, or follow-up periods.13,17
With rising global life expectancy, 18 increasing attention has been given to non-pharmacological strategies to improve well-being and extend healthspan in older adults. Identifying modifiable risk factors is therefore critical for reducing morbidity and mortality risks in this population, who are particularly vulnerable to comorbidities and age-related health risks. One such factor is circadian rhythms, which regulate fundamental physiological, biological, and behavioral functions. Disruptions in these rhythms are associated with aging and impaired homeostasis across multiple systems, contributing to metabolic dysfunction. 19 Rest-activity rhythms (RAR), assessed through wrist-worn actigraphy, are an objective measure of 24-h circadian behavioral rhythmicity and are emerging as a clinical biobehavioral marker of health.20,21 Several studies have indicated that older adults exhibit disrupted RAR patterns (i.e., low rhythmic strength, stability, high fragmentation, or phase advance) associated with harmful health outcomes, including frailty, MetS, and mortality.22–25 Moreover, older adults with frailty or MetS exhibited dampened RAR patterns compared to their non-frail and non-MetS counterparts,23,26 suggesting the role of RAR as a possible modifiable marker of these age-related health outcomes and their potential shared mechanisms linked to mortality. 19 Collectively, it may be possible that independent associations of these age-related risk factors of MetS, frailty, and RAR with mortality can be moderated or compounded by their co-occurrence, particularly in older adults. However, little is known about their independent associations with mortality, particularly in the context of their complex interrelationships, as well as the effect of their coexistence.
This study aimed to (1) examine the independent associations of MetS, frailty, and RAR with all-cause mortality and (2) explore the interaction effects of these risk factors in predicting the risk of all-cause mortality among a nationally representative sample of US older adults. The findings from this study will provide evidence for identifying critical modifiable risk factors for all-cause mortality in older adults. Moreover, we anticipated offering valuable insights for public health and informing future intervention strategies to promote well-being and longevity in older adults.
Materials and Methods
Data Source
Data for this study were sourced from the U.S. Centers for Disease Control and Prevention’s (CDC) National Health and Nutrition Examination Survey (NHANES), an ongoing cross-sectional study designed to assess the health and nutritional status of the U.S. population in 2-year cycles. Utilizing complex multistage probability sampling methods, NHANES produced a weighted, nationally representative sample of the U.S. population. Participants’ demographic and lifestyle information were collected through household interviews by trained staff, and physical examinations were performed at the mobile examination center (MEC). NHANES study protocols received approval from the National Center for Health Statistics Research Ethics Review Board, with all participants providing written informed consent. Detailed protocols can be found elsewhere. 27
Study Population
The current study initially included 2531 older adults aged ≥ 60 years with valid MEC measures for the outcome of interest, including frailty and actigraphy data from the NHANES 2011-2014. To obtain valid MetS component biomarkers, we selected a subsample with accurate fasting measures and constructed a combined NHANES 2011-2014 survey cycle weight.
27
Among 1118 participants with valid fasting weight variables, 108 were further excluded due to missing values in major study covariates and mortality status. Therefore, 1010 participants were included in the final sample for survival analysis. The study sample selection process is shown in Figure 1. Flow diagram of the study sample selection in NHANES between 2011 and 2014.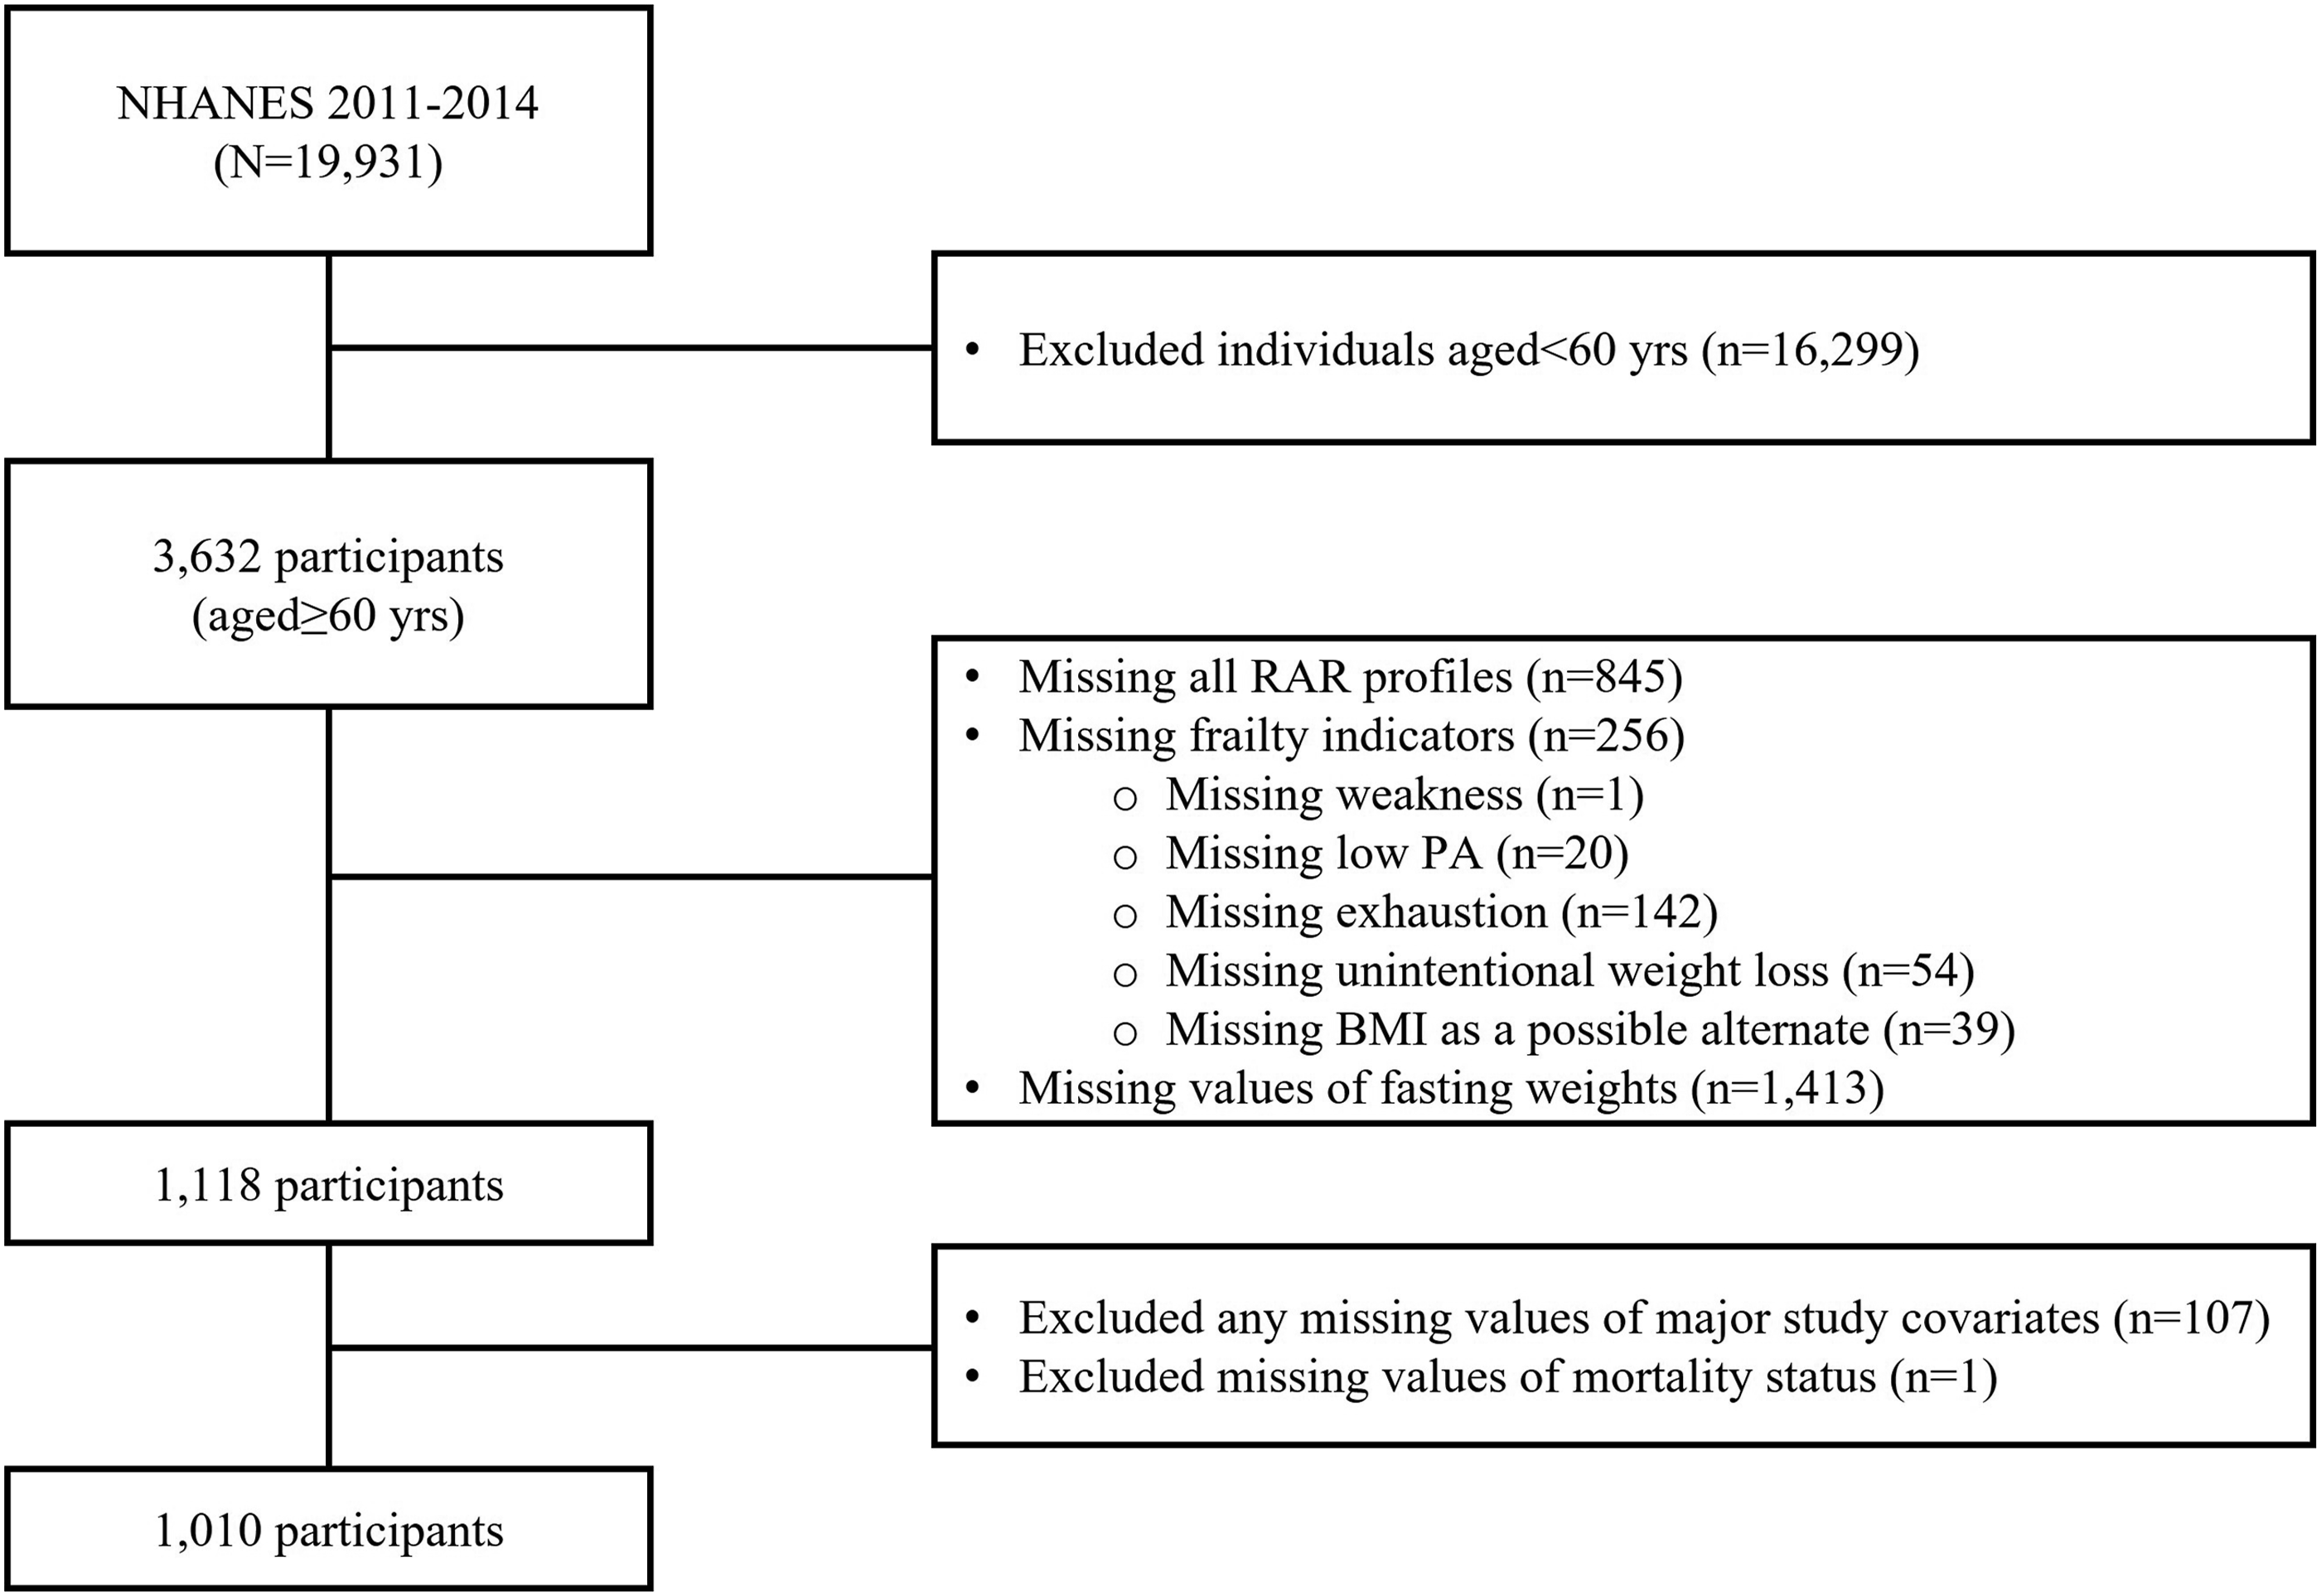
Metabolic Syndrome
MetS was defined by the National Cholesterol Education Program’s Adult Treatment Panel (NCEP ATP) III criteria, requiring the presence of at least 3 of the following 5 diagnostic criteria: (1) Abdominal obesity (waist circumference >102 cm in men or >88 cm in women); (2) High Triglycerides (>150 mg/dl); (3) Low HDL-C (<40 mg/dl); (4) Elevated Blood Pressure (systolic blood pressure ≥130 mmHg or diastolic blood pressure ≥80 mmHg or taking hypertension medications); (5) Elevated fasting blood glucose (≥100 mg/dl or taking diabetes medications).4,28
Frailty
Fried physical frailty phenotype has been widely utilized for assessing frailty status in older adults. 8 This study used a modified version of the frailty phenotype, consisting of 5 self-reported measures validated in large population-based studies, including the recent NHANES study.29–31 The following 5 frailty indicators were assessed to determine individuals’ frailty status: (1) Exhaustion: “Self-reported feelings of tiredness or having little energy”—participants meeting this criterion reported “more than half the days/nearly every day.”; (2) Weakness: “Self-reported lifting or carrying”—participants meeting this criterion reported “some difficulty/much difficulty/unable to do.”; (3) Walking disability: “Self-reported difficulty walking between rooms on the same floor”—participants meeting this criterion reported “some difficulty/much difficulty/unable to do.”; (4) Low physical activity (PA) levels: Participants meeting this criterion belong to the highest quintile of self-reported minutes of sedentary activity within their age group; (5) Unintentional weight loss: Participants meeting this criterion responded that they experienced unintentional weight loss (≥10 lbs) in the past year. Frailty status was classified into 3 groups based on the number of indicators met 8 : Frail (≥3), Pre-frail (1-2), and Non-frail (0).
Rest-Activity Rhythms
Actigraphy Data Processing
In the NHANES 2011-2012 and 2013-2014 cycles, a subset of MEC participants had 9 days of continuous 24-h actigraphy measurements using a triaxial wrist-worn accelerometer (GT3X+, ActiGraph, Pensacola, FL). The raw acceleration data were collected from 3 device axes at an 80 Hz sampling rate. Prior to the data release, NHANES researchers conducted comprehensive quality assurance and quality control checks on the raw acceleration data. They then summarized the data into minute-by-minute levels using the Monitor-Independent-Movement Summary (MIMS) unit, an open-source, device-independent summary metric of raw acceleration data. 32
From the participants’ 9 days of actigraphy data, we utilized the full 7 days of MIMS data to calculate RAR parameters (i.e., excluding measurement for the first and last partial days of the monitoring period). Then, we further conducted an additional quality assessment on the MIMS using 3 quality control flags, and the following were considered missing: (1) The number of data quality flags during the minute >0; (2) The estimated wake/sleep/wear status during the minute was coded as “non-wear”; (3) The MIMS unit was coded as “−0.01,” which could not be computed during the minute. Missing data with quality control flags were imputed by averaging the MIMS values at corresponding time points on different days of the week, using methodologies similar to those employed in GGIR. 33 Before imputation, we considered the monitoring day valid if the total valid wear time was >16 h. 34 Participants with <4 valid days of actigraphy data were also excluded. 35 The mean number of valid actigraphy days and daily wear time (i.e., valid wake wear + valid sleep wear) in our study sample were 6.72 (95% CI: 6.66−6.78) days and 22.83 (95% CI: 22.80−22.86) hours, respectively.
Non-Parametric Rest-Activity Rhythm Parameters
A non-parametric approach was used to quantify RAR characteristics, offering advantages such as reduced sensitivity to activity outliers and independence from the shape of the behavioral rhythmicity.25,36 The following non-parametric RAR parameters were computed using custom SAS codes (SAS, Institute, Cary, NC): (1) Inter-daily Stability (IS; ranges 0-1) assesses the day-to-day robustness of RAR. A higher IS value indicates greater day-to-day stability of RAR; (2) Intra-daily Variability (IV; ranges 0-2) quantifies the hour-to-hour variation of RAR. A higher IV value indicates greater RAR fragmentation; (3) M10 and L5: The mean MIMS during the most active 10-h (M10) and the least active 5-h (L5) within 24-h were computed. The onset time of M10 and L5 was also calculated; (4) Relative Amplitude (RA; ranges 0-1) was estimated as the relative difference between M10 and L5 within 24-h (i.e., [M10–L5]/[M10 + L5]). A higher RA value indicates greater overall rhythmic strength. Given the constrained ranges of IS, IV, and RA measurement units, we categorized them into 3 tertile groups (low/medium/high). M10 and L5 were used as continuous mean MIMS units for analysis.
All-Cause Mortality
All-cause mortality data were obtained through linkage with public-use National Death Index (NDI) records through December 31, 2019, provided by the National Center for Health Statistics (NCHS). Participants’ mortality status, date of death, and follow-up duration were derived from mortality data.
Covariates
Demographic and lifestyle factors—age (years), gender (male vs female), race/ethnicity (Non-Hispanic White vs Non-Hispanic Black vs Mexican American vs Others), body mass index (BMI; kg/m2), family income to poverty ratio (tertiles; low vs medium vs high), education (< vs ≥ high school), marital status (married or living with a partner vs others), smoking (current vs former vs non-smoker), alcohol consumption (≥4 drinks every day; yes vs no), caffeine intake (mg), the number of comorbidities (<3 vs ≥3 using self-reported chronic conditions; including cancer, arthritis, congestive heart failure, coronary heart disease, heart attack, stroke, and diabetes), 37 self-reported physician diagnosis of sleep disorders (yes vs no), times received healthcare over the past year (<10 vs ≥10 times), self-reported time spent in moderate-to-vigorous PA (MVPA; <150 vs ≥ 150 mins/week from the Global Physical Activity Questionnaire [GPAQ], categorized according to PA guidelines),37,38 screen-based sedentary behavior (<8 vs ≥8 hrs from the GPAQ, categorized based on the recommended sedentary time),39,40 and self-reported sleep duration (7−8 hrs vs <7 or >8 hrs, following sleep guidelines) 41 were considered for as potential confounders in the initial analysis, aligning with existing evidence.25,29 Final study covariates—gender, race, family income, smoking status, alcohol consumption, number of comorbidities, MVPA, sedentary time, and sleep duration—were retained in the main final models through existing evidence or individual variable selection process, using a significance level of P < .05, to develop the most efficient model-data fit. 29
Statistical Analysis
Descriptive characteristics, prevalence of MetS and frailty, and characterization of RAR parameters in the study population were reported as weighted means with 95% confidence intervals (CIs) for continuous variables and as weighted percentages (%) with 95% CIs for categorical variables. We performed general linear models for continuous variables and the Rao-Scott chi-square test for categorical variables to compare the group differences between non-MetS individuals and older adults with MetS, accounting for the complex sampling design of the NHANES.
The Cox proportional-hazard (PH) regression models were used to examine the associations of frailty, MetS, and RAR with all-cause mortality in older adults. To assess the robustness of the associations of interest, we performed sensitivity analyses and provided the results in separate models: unadjusted model (Model 1), mutually unadjusted model (Model 2; i.e., MetS + covariates, Frailty + covariates, RAR + covariates), and fully adjusted model (Model 3). The final covariate set was adjusted for in Cox PH regression models 2 and 3. Additional sensitivity analyses were conducted by further adjusting for other relevant potential confounders (i.e., self-reported sleep disorder and caffeine intake) in addition to the final covariate set, to assess the robustness of the observed associations. However, the models with the original final covariate set were considered the primary analyses, given concerns with the self-reported sleep disorder, particularly the possible bidirectional relationship between sleep disorder and RAR, which may present a mediating pathway and obscure the true association between RAR and mortality. 42 The PH assumption was checked for all covariates in the final models using Schoenfeld residuals by including an interaction term with follow-up time (i.e., each covariate × follow-up time). If the assumption was violated (i.e., significant interaction terms), the interaction term was added to the model to account for time-dependent effects. Only the race variable had an assumption violation; thus, we added the interaction term of race × follow-up time in the models. Due to the high correlations among RAR parameters (r’s = 0.4-0.8, P’s<.001), separate Cox PH models were fitted for each RAR parameter model. Specifically, the tertile groups of RA, IS, and IV were used to predict the all-cause mortality risk. In contrast, the association between one-unit changes in mean MIMS of M10 and L5 and all-cause mortality was estimated.
Additionally, we identified whether MetS or frailty moderates the associations of interest with all-cause mortality by adding interaction terms (i.e., frailty × MetS, frailty × RAR, MetS × RAR, frailty × MetS × RAR) to the final model. If a significant interaction was observed, further stratified analysis was conducted by MetS status, frailty status, and combined statuses of frailty + MetS (i.e., both/frailty only/MetS only/neither). In the stratified analyses by frailty status, frail and pre-frail individuals were combined (i.e., frail/pre-frail) to compare with the non-frail individuals as the reference group. The predicted risk of all-cause mortality from Cox PH regression models was presented as hazard ratios (HRs) and 95% CIs. All statistical analyses accounted for NHANES 4-year fasting subsample weights using the SURVEY procedure in SAS v9.4 (SAS, Institute, Cary, NC), with statistical significance at P < .05. To account for multiple comparisons in the primary stratified analyses (i.e., MetS vs non-MetS), Bonferroni correction was further applied, with an adjusted significance level of P < .025 (
Results
Study Population
Descriptive Characteristics of the Study Population From the NHANES 2011-2014.
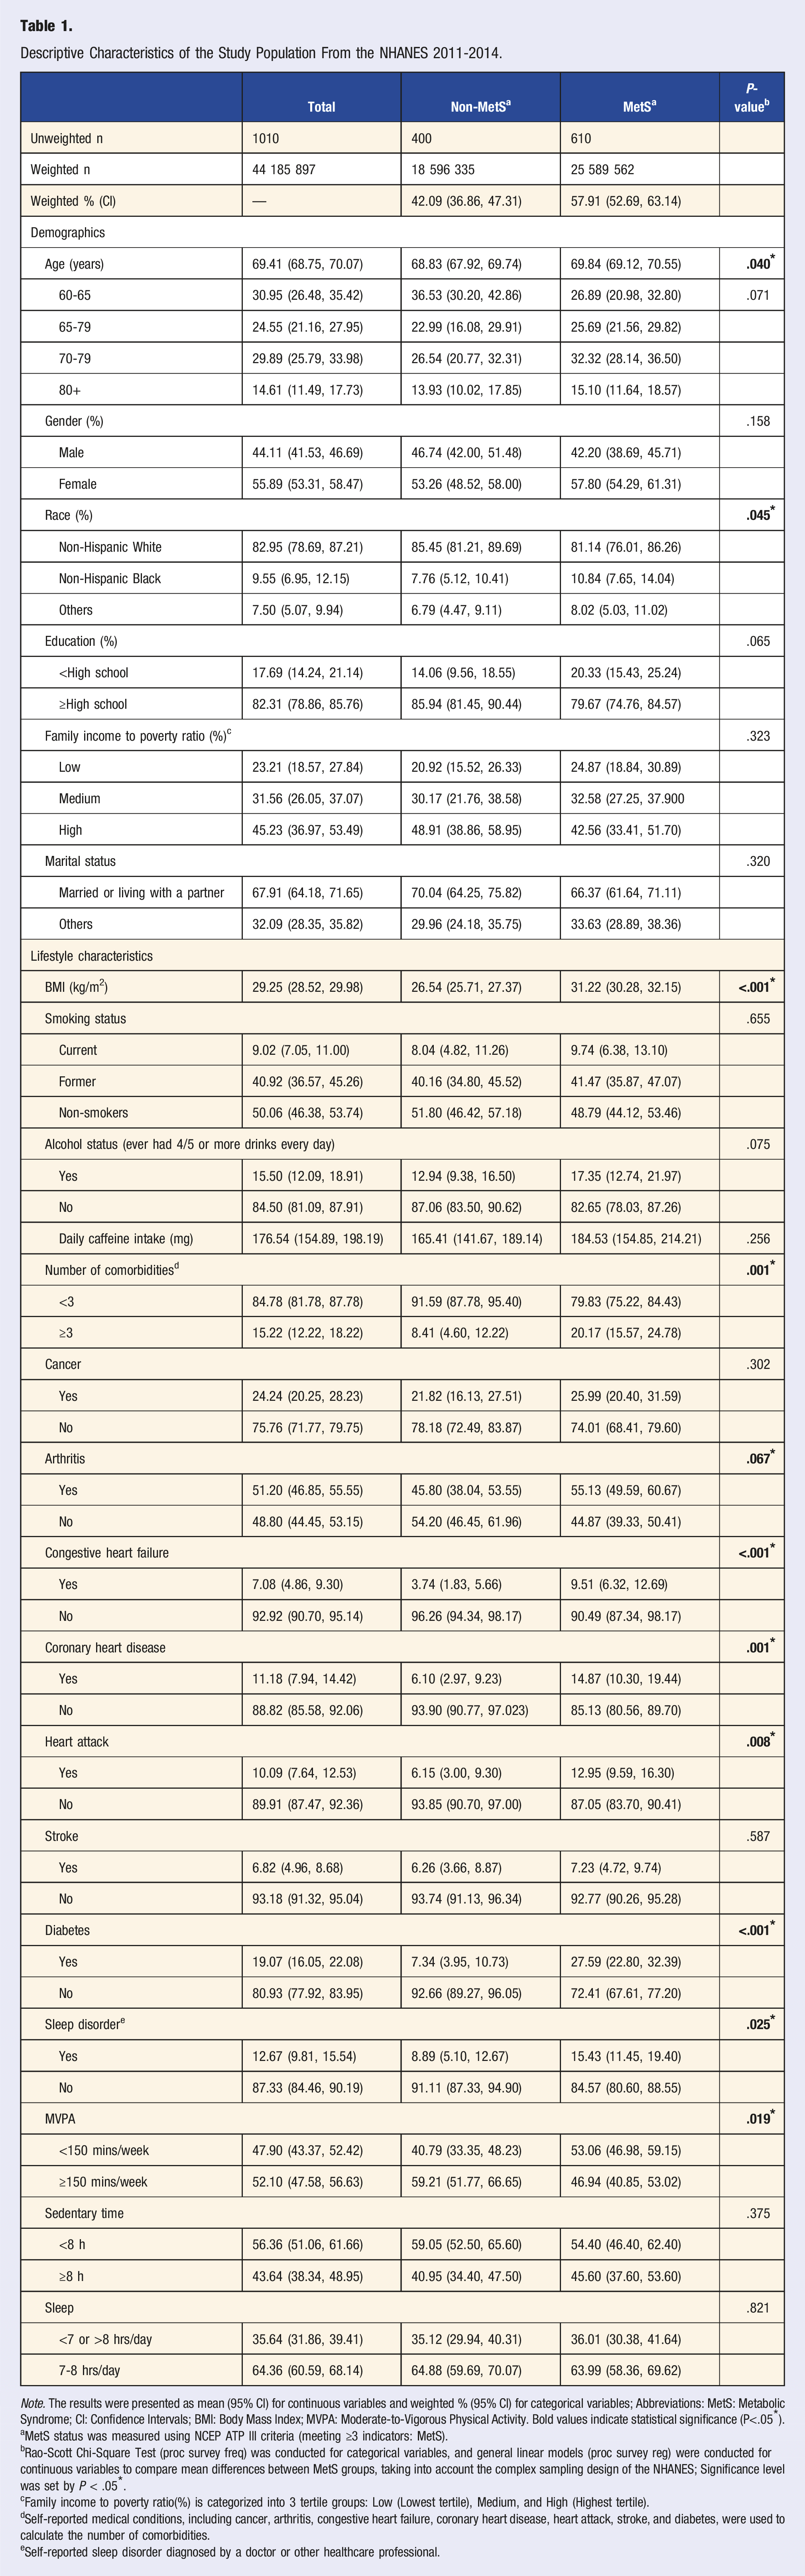
Note. The results were presented as mean (95% CI) for continuous variables and weighted % (95% CI) for categorical variables; Abbreviations: MetS: Metabolic Syndrome; CI: Confidence Intervals; BMI: Body Mass Index; MVPA: Moderate-to-Vigorous Physical Activity. Bold values indicate statistical significance (P<.05*).
aMetS status was measured using NCEP ATP III criteria (meeting ≥3 indicators: MetS).
bRao-Scott Chi-Square Test (proc survey freq) was conducted for categorical variables, and general linear models (proc survey reg) were conducted for continuous variables to compare mean differences between MetS groups, taking into account the complex sampling design of the NHANES; Significance level was set by P < .05*.
cFamily income to poverty ratio(%) is categorized into 3 tertile groups: Low (Lowest tertile), Medium, and High (Highest tertile).
dSelf-reported medical conditions, including cancer, arthritis, congestive heart failure, coronary heart disease, heart attack, stroke, and diabetes, were used to calculate the number of comorbidities.
eSelf-reported sleep disorder diagnosed by a doctor or other healthcare professional.
Frailty, Metabolic Syndrome, and Rest-Activity Rhythms
Comparison of Prevalence of the Components of Metabolic Syndrome, Frailty, and Rest-Activity Rhythms Characteristics Between Non-MetS Individuals and Older Adults With MetS.
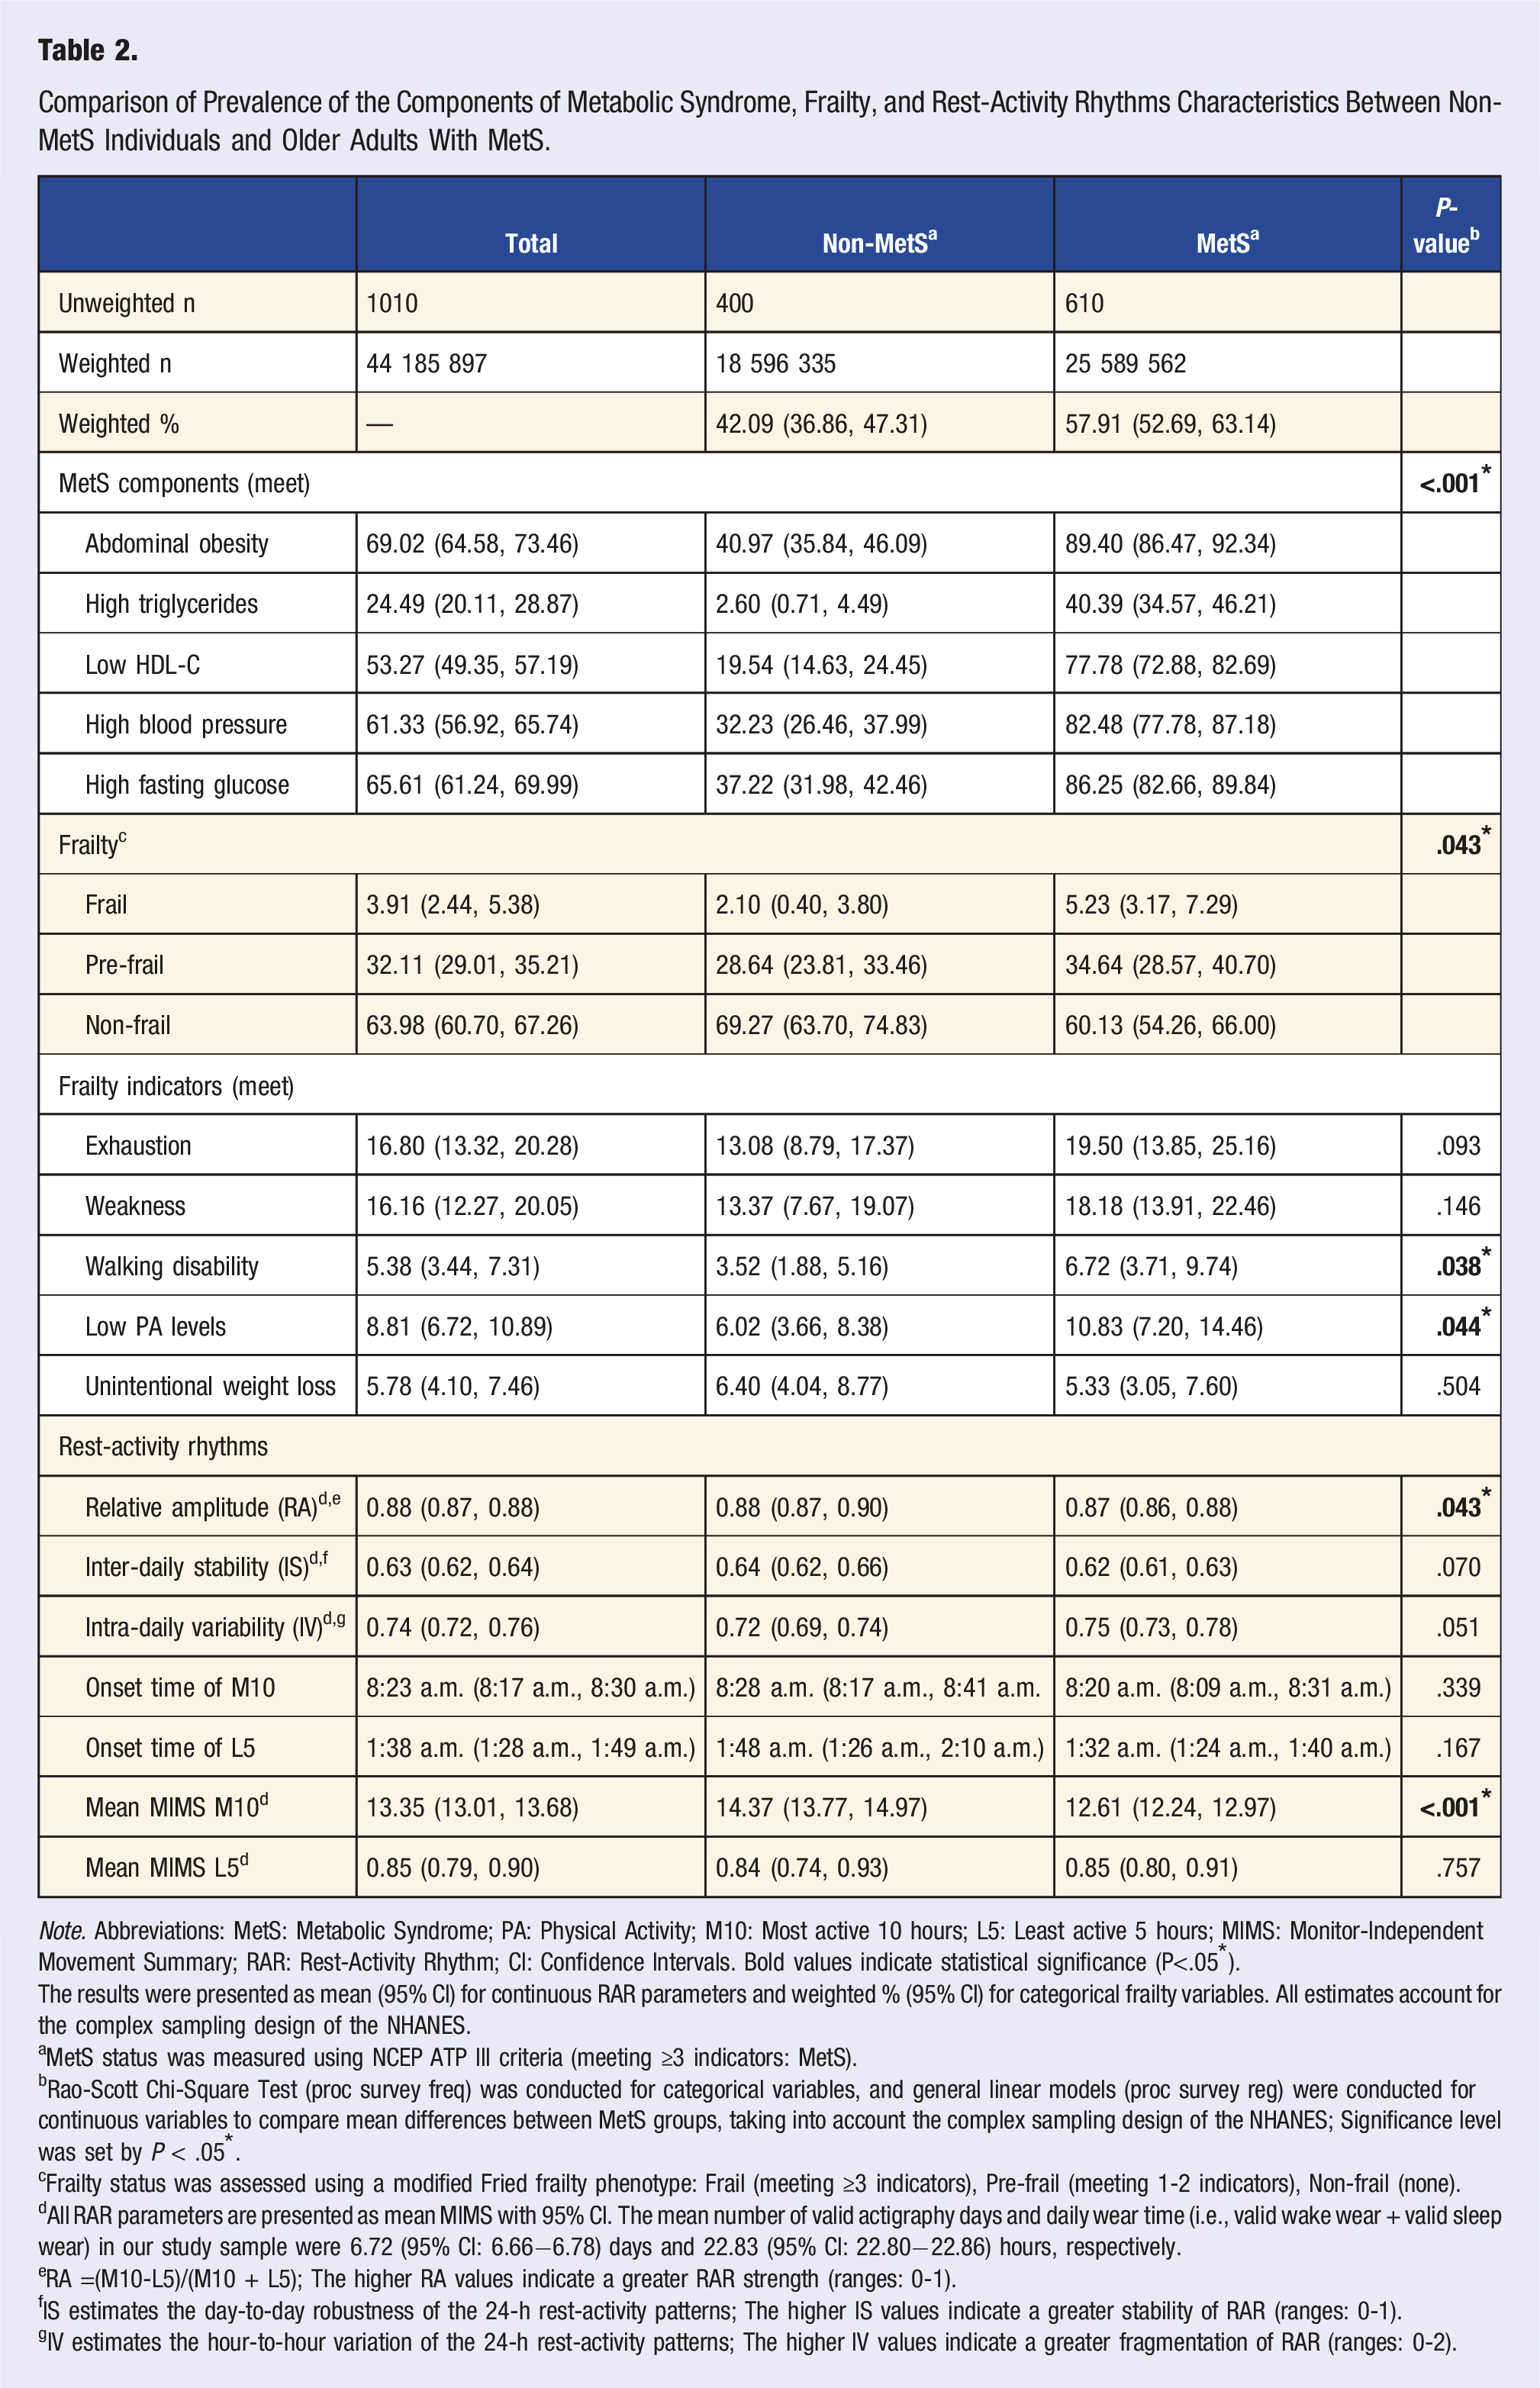
Note. Abbreviations: MetS: Metabolic Syndrome; PA: Physical Activity; M10: Most active 10 hours; L5: Least active 5 hours; MIMS: Monitor-Independent Movement Summary; RAR: Rest-Activity Rhythm; CI: Confidence Intervals. Bold values indicate statistical significance (P<.05*).
The results were presented as mean (95% CI) for continuous RAR parameters and weighted % (95% CI) for categorical frailty variables. All estimates account for the complex sampling design of the NHANES.
aMetS status was measured using NCEP ATP III criteria (meeting ≥3 indicators: MetS).
bRao-Scott Chi-Square Test (proc survey freq) was conducted for categorical variables, and general linear models (proc survey reg) were conducted for continuous variables to compare mean differences between MetS groups, taking into account the complex sampling design of the NHANES; Significance level was set by P < .05*.
cFrailty status was assessed using a modified Fried frailty phenotype: Frail (meeting ≥3 indicators), Pre-frail (meeting 1-2 indicators), Non-frail (none).
dAll RAR parameters are presented as mean MIMS with 95% CI. The mean number of valid actigraphy days and daily wear time (i.e., valid wake wear + valid sleep wear) in our study sample were 6.72 (95% CI: 6.66−6.78) days and 22.83 (95% CI: 22.80−22.86) hours, respectively.
eRA =(M10-L5)/(M10 + L5); The higher RA values indicate a greater RAR strength (ranges: 0-1).
fIS estimates the day-to-day robustness of the 24-h rest-activity patterns; The higher IS values indicate a greater stability of RAR (ranges: 0-1).
gIV estimates the hour-to-hour variation of the 24-h rest-activity patterns; The higher IV values indicate a greater fragmentation of RAR (ranges: 0-2).
Older adults with MetS exhibited disrupted RAR with significantly lower levels of RA (P = .043) and M10 (P < .001) compared to their non-MetS counterparts. IS, IV, the onset time of M10 and L5, and the mean MIMIS of L5 were not significantly different between MetS groups. The characterization of categorical RAR parameters (i.e., RA, IS, and IV) between MetS groups is displayed in eTable 1.
Independent Effect of Predictors on All-Cause Mortality
Associations of Frailty, Metabolic Syndrome, and Rest-Activity Rhythms Parameters With All-Cause Mortality.
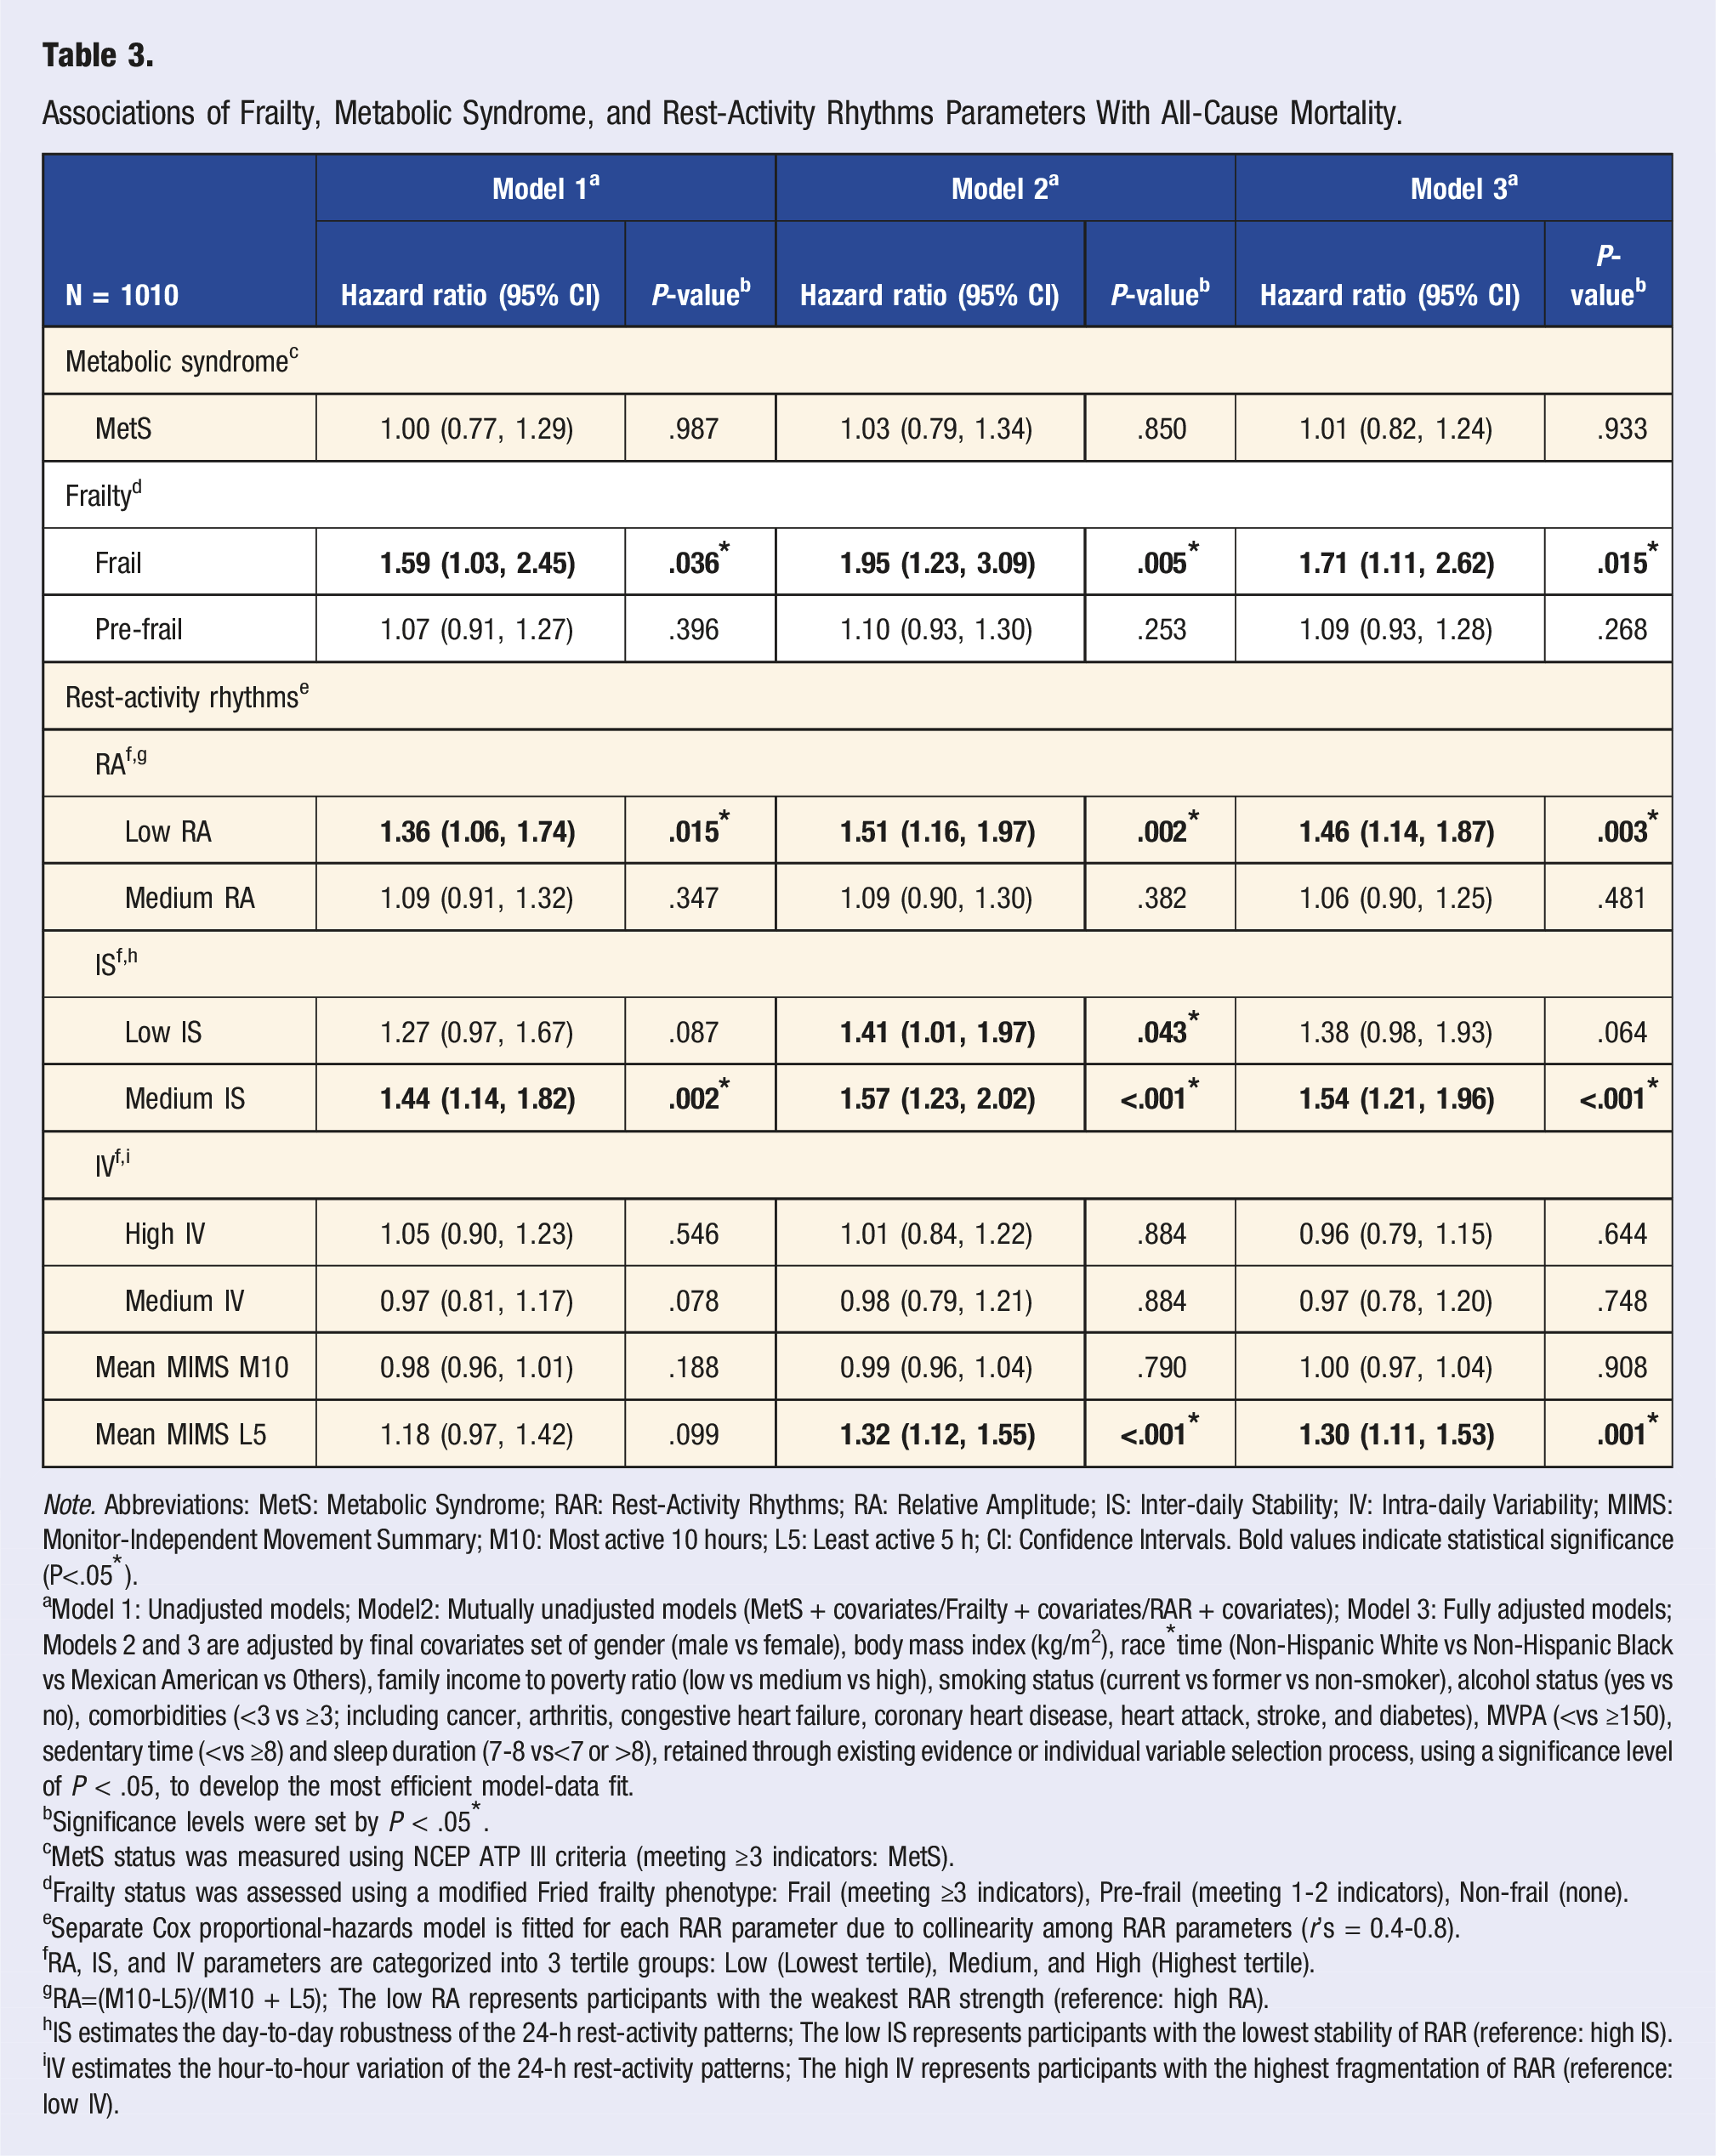
Note. Abbreviations: MetS: Metabolic Syndrome; RAR: Rest-Activity Rhythms; RA: Relative Amplitude; IS: Inter-daily Stability; IV: Intra-daily Variability; MIMS: Monitor-Independent Movement Summary; M10: Most active 10 hours; L5: Least active 5 h; CI: Confidence Intervals. Bold values indicate statistical significance (P<.05*).
aModel 1: Unadjusted models; Model2: Mutually unadjusted models (MetS + covariates/Frailty + covariates/RAR + covariates); Model 3: Fully adjusted models; Models 2 and 3 are adjusted by final covariates set of gender (male vs female), body mass index (kg/m2), race*time (Non-Hispanic White vs Non-Hispanic Black vs Mexican American vs Others), family income to poverty ratio (low vs medium vs high), smoking status (current vs former vs non-smoker), alcohol status (yes vs no), comorbidities (<3 vs ≥3; including cancer, arthritis, congestive heart failure, coronary heart disease, heart attack, stroke, and diabetes), MVPA (<vs ≥150), sedentary time (<vs ≥8) and sleep duration (7-8 vs<7 or >8), retained through existing evidence or individual variable selection process, using a significance level of P < .05, to develop the most efficient model-data fit.
bSignificance levels were set by P < .05*.
cMetS status was measured using NCEP ATP III criteria (meeting ≥3 indicators: MetS).
dFrailty status was assessed using a modified Fried frailty phenotype: Frail (meeting ≥3 indicators), Pre-frail (meeting 1-2 indicators), Non-frail (none).
eSeparate Cox proportional-hazards model is fitted for each RAR parameter due to collinearity among RAR parameters (r’s = 0.4-0.8).
fRA, IS, and IV parameters are categorized into 3 tertile groups: Low (Lowest tertile), Medium, and High (Highest tertile).
gRA=(M10-L5)/(M10 + L5); The low RA represents participants with the weakest RAR strength (reference: high RA).
hIS estimates the day-to-day robustness of the 24-h rest-activity patterns; The low IS represents participants with the lowest stability of RAR (reference: high IS).
iIV estimates the hour-to-hour variation of the 24-h rest-activity patterns; The high IV represents participants with the highest fragmentation of RAR (reference: low IV).
Interaction Effect of Predictors on All-Cause Mortality
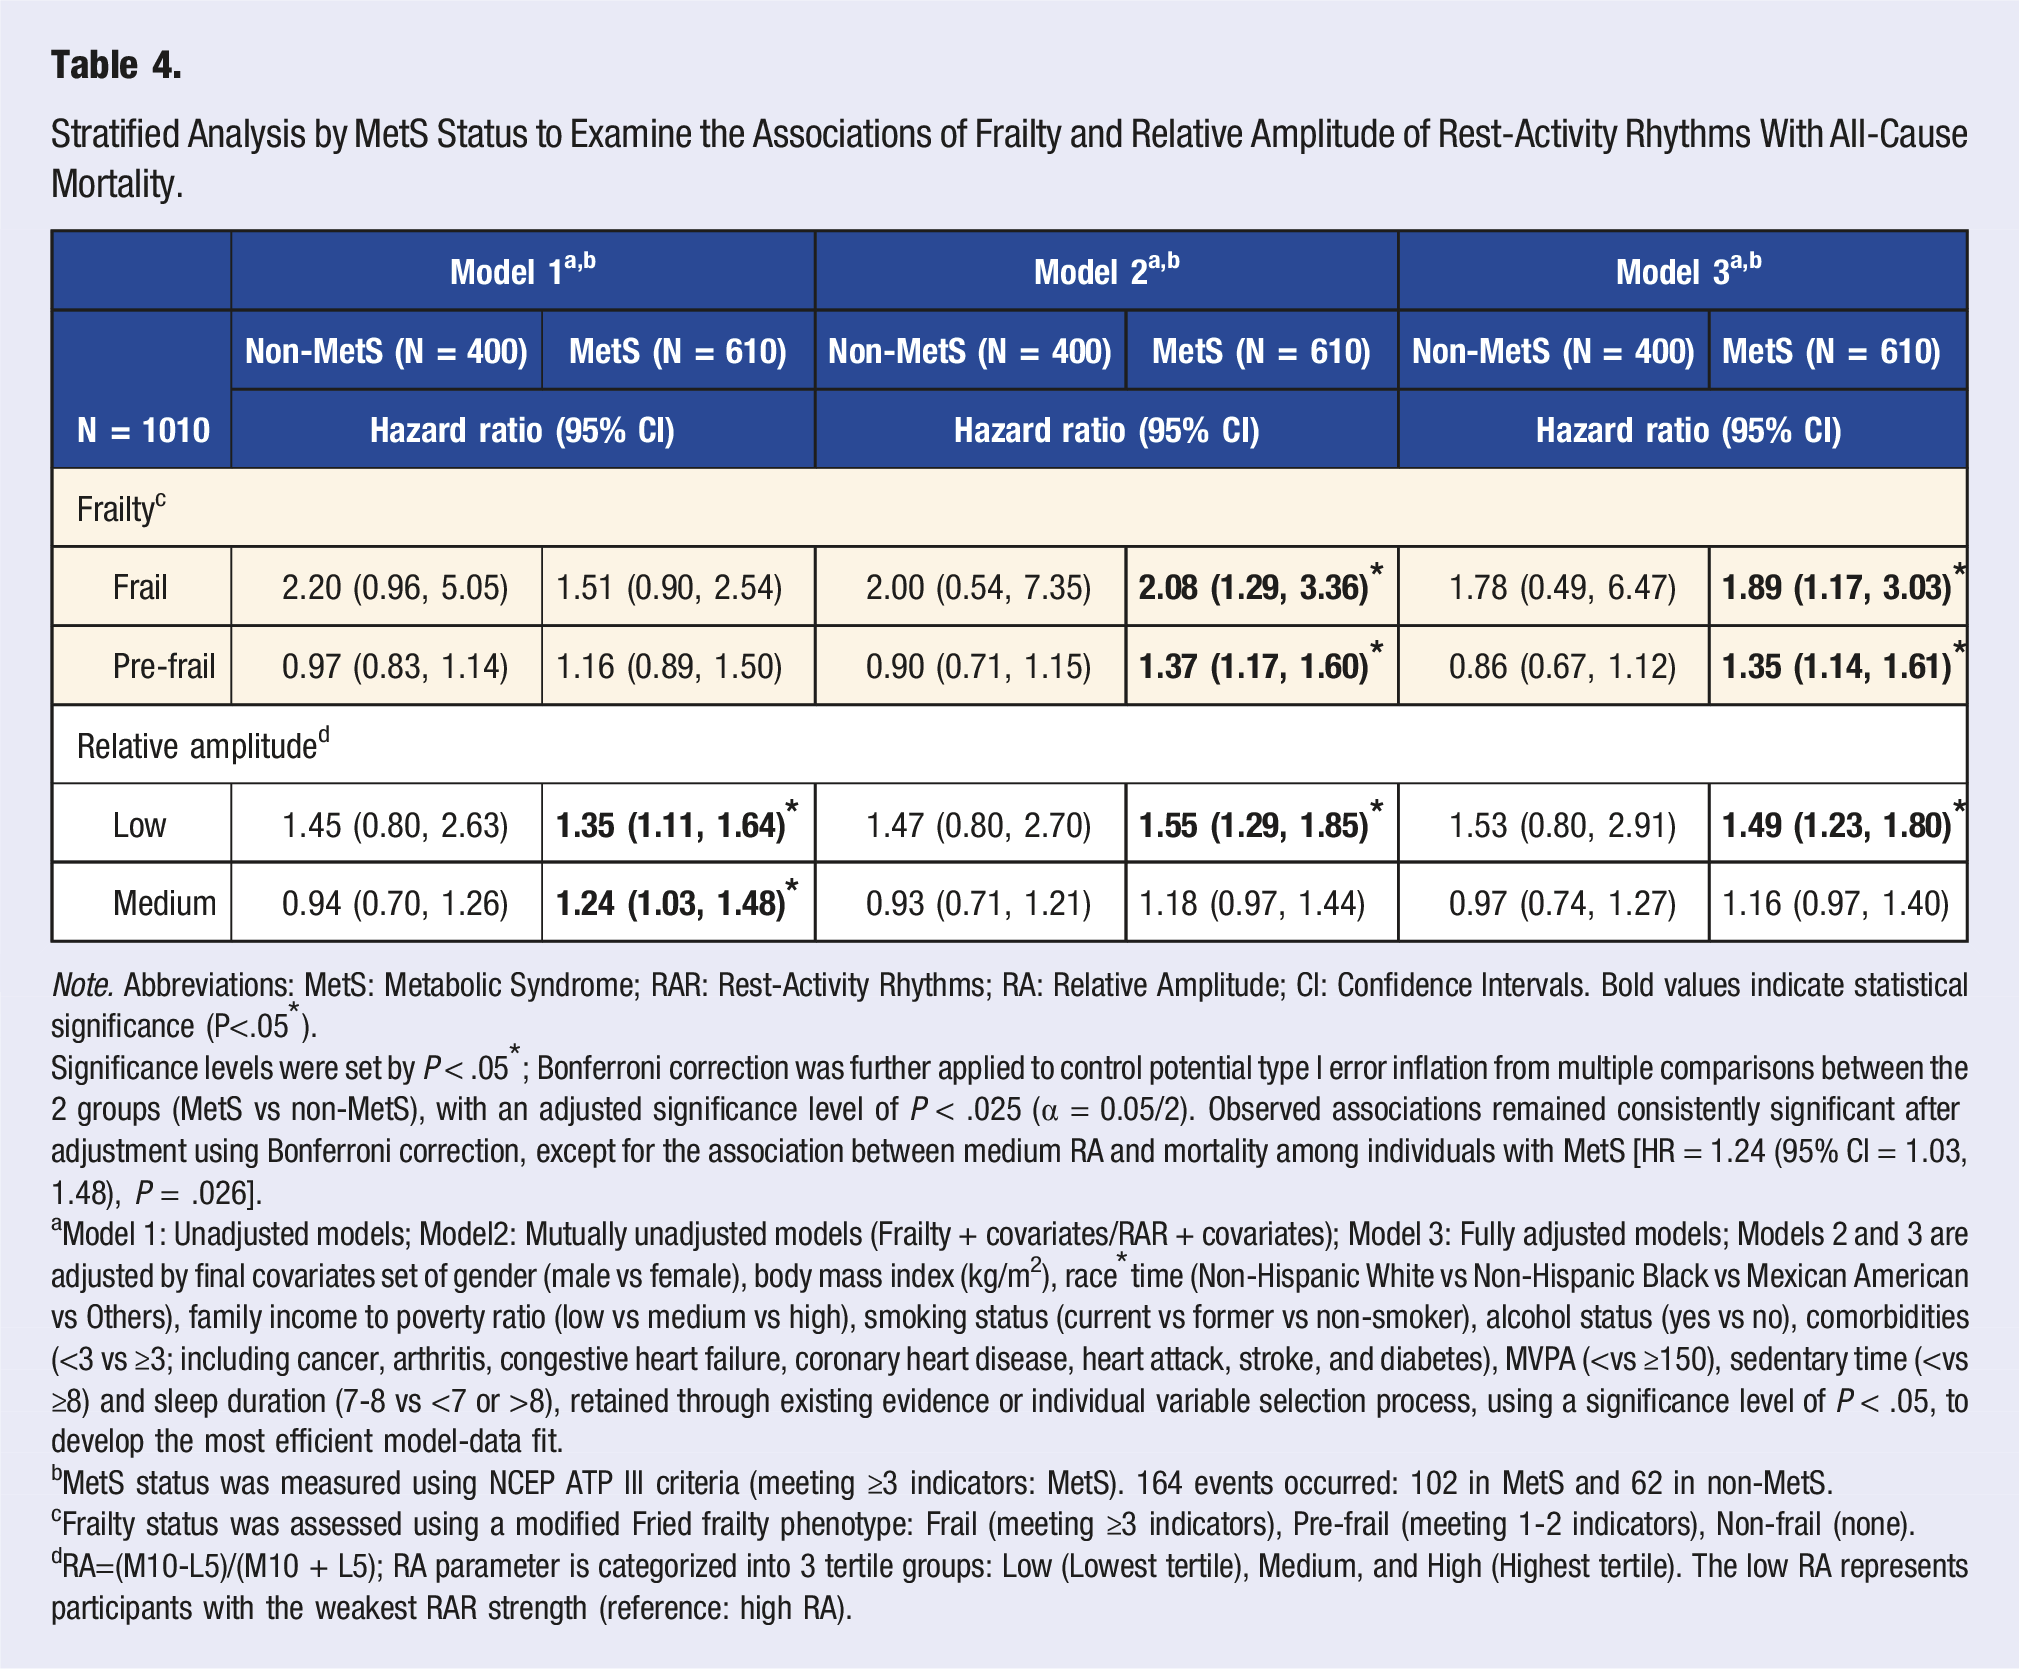
Stratified Analysis by MetS Status to Examine the Associations of Frailty and Relative Amplitude of Rest-Activity Rhythms With All-Cause Mortality.
Note. Abbreviations: MetS: Metabolic Syndrome; RAR: Rest-Activity Rhythms; RA: Relative Amplitude; CI: Confidence Intervals. Bold values indicate statistical significance (P<.05*).
Significance levels were set by P < .05*; Bonferroni correction was further applied to control potential type I error inflation from multiple comparisons between the 2 groups (MetS vs non-MetS), with an adjusted significance level of P < .025 (α = 0.05/2). Observed associations remained consistently significant after adjustment using Bonferroni correction, except for the association between medium RA and mortality among individuals with MetS [HR = 1.24 (95% CI = 1.03, 1.48), P = .026].
aModel 1: Unadjusted models; Model2: Mutually unadjusted models (Frailty + covariates/RAR + covariates); Model 3: Fully adjusted models; Models 2 and 3 are adjusted by final covariates set of gender (male vs female), body mass index (kg/m2), race*time (Non-Hispanic White vs Non-Hispanic Black vs Mexican American vs Others), family income to poverty ratio (low vs medium vs high), smoking status (current vs former vs non-smoker), alcohol status (yes vs no), comorbidities (<3 vs ≥3; including cancer, arthritis, congestive heart failure, coronary heart disease, heart attack, stroke, and diabetes), MVPA (<vs ≥150), sedentary time (<vs ≥8) and sleep duration (7-8 vs <7 or >8), retained through existing evidence or individual variable selection process, using a significance level of P < .05, to develop the most efficient model-data fit.
bMetS status was measured using NCEP ATP III criteria (meeting ≥3 indicators: MetS). 164 events occurred: 102 in MetS and 62 in non-MetS.
cFrailty status was assessed using a modified Fried frailty phenotype: Frail (meeting ≥3 indicators), Pre-frail (meeting 1-2 indicators), Non-frail (none).
dRA=(M10-L5)/(M10 + L5); RA parameter is categorized into 3 tertile groups: Low (Lowest tertile), Medium, and High (Highest tertile). The low RA represents participants with the weakest RAR strength (reference: high RA).
In Table 4, after stratification by MetS status, the associations between low RA and all-cause mortality remained significant across all models and were observed exclusively among older adults with MetS, based on the Bonferroni correction (Models 1-3; HRs = 1.35-1.55, P’s = .000–.004). In Model 2, the associations of frailty and pre-frailty with all-cause mortality became significant, exclusively among MetS-individuals, after adjusting for covariates [HR (95% CIs); Frailty: 2.08 (1.29-3.36), P = .004; Pre-frailty: 1.37 (1.17-1.60), P < .001]. In the fully adjusted models (Model 3), the significant association with all-cause mortality was consistently observed with frailty, pre-frailty, and low RA, only among older adults with MetS [HR (95% CIs); Frailty: 1.89 (1.17-3.03), P = .010; Pre-frailty: 1.35 (1.14-1.61), P = .001; Low RA: 1.49 (1.23-1.80), P = <.001]. Further sensitivity analyses controlling for additional covariates are also provided in eTable 3.
Stratified analysis by frailty status also showed significant associations of MetS and low RA with all-cause mortality, exclusively among frail/pre-frail individuals (Models 2-3; eTable 4). In Model 2, the associations of MetS and low RA with all-cause mortality became significant only in frail/pre-frail individuals after adjusting for covariates [HR (95% CIs); MetS: 1.37 (1.05-1.77), P = .020; Low RA: 1.52 (1.06-2.18), P = .025]. In the fully adjusted models (Model 3), significant associations of MetS and low RA were consistently observed with all-cause mortality, exclusively among frail/pre-frail older adults [HR (95% CIs); MetS: 1.39 (1.06-1.82), P = .018; low RA: 1.55 (1.10-2.18), P = .015].
Discussion
Our findings revealed that older adults with MetS exhibited a higher prevalence of frailty and disrupted RAR patterns, characterized by low levels of RA and M10, compared to those without MetS. Frailty, lower rhythmic strength, intra-daily stability, and greater nighttime activity were significant independent predictors of all-cause mortality in older adults. MetS and frailty moderated these associations, with the coexistence of frailty, MetS, and low RA showing a significantly heightened risk of all-cause mortality. These findings underscore the importance of identifying MetS, frailty, and disrupted RAR to provide tailored strategies for addressing health issues and reducing mortality risk in older adults.
Frailty, Metabolic Syndrome, and All-Cause Mortality in Older Adults
We demonstrated that frailty significantly predicted all-cause mortality, whereas MetS alone did not contribute to mortality risk in older adults. Although the evidence regarding the relationship between frailty, MetS, and mortality is unclear, some previous studies align with our findings. Kane et al (2017) and Espinoza et al (2023) found that MetS was not associated with mortality in older adults. In contrast, frailty was associated with an increased mortality risk during 10-year and 4.7-year follow-up periods, respectively.17,43 In comparison, Hoogendijk et al (2017) conducted a 19-year follow-up study and found a robust association between MetS and mortality, with frailty contributing minimally to this relationship in older adults. 13 These mixed findings suggest that MetS may be a more long-term condition, which is developed in earlier stages of life and results in chronic conditions, like CVD or diabetes, which contribute to mortality. 44 In this regard, our study’s 5-8 years of follow-up may be insufficient to detect the independent relationship between MetS and mortality. On the other hand, frail older adults from our study had a higher risk of all-cause mortality than their non-frail counterparts. This indicates that being frail drives older adults to an increased risk of mortality in the relatively short term compared to having MetS.
MetS and frailty share several pathophysiological pathways, such as excessive oxidative stress, chronic inflammation, dysregulated glucose-insulin dynamics, or physical disabilities attributed to muscle loss or malnutrition.13,45,46 These metabolic alterations often occur with aging and contribute to the development of frailty, MetS, or both, leading to greater vulnerability to other health risks, including mortality, in older adults. 12 However, the shared underlying mechanisms between MetS and frailty make it challenging to understand their independent effect on health risk. Some evidence underscores that MetS and frailty involve distinct inflammatory markers in metabolic pathways, resulting in MetS reflecting metabolic/physiological health and frailty reflecting physical function 47 ; still, more experimental studies are needed to establish the mechanisms that explain their complex relationship.
Rest-Activity Rhythms and All-Cause Mortality in Older Adults
Growing evidence suggests that disrupted RAR, particularly low RA, is a strong indicator of mortality.25,48 Similarly, we observed that low RA, medium IS, and reduced L5 were significantly associated with a higher mortality risk. A recent study targeting older adults in Brazil revealed that a relationship between RAR, characterized by IS and IV, and all-cause mortality was no longer significant after adjusting for accelerometer-derived MVPA. 49 Although our study adjusted for subjective measures of MVPA levels, we observed inconsistent findings, where low and medium IS were significantly associated with all-cause mortality after adjusting for covariates, including subjective MVPA levels. Interestingly, low IS was no longer a significant predictor of all-cause mortality risk after adjusting for frailty and MetS. However, given the large deviations and overlapped confidence intervals observed between the low and medium IS groups, we suspect there may be no significant differences between these groups. Nevertheless, our findings of substantial and consistent associations between RA, IS, L5, and all-cause mortality in older adults suggest that maintaining a robust and stable rest-activity rhythmic pattern, especially with lowering nighttime activity (i.e., enhanced sleep), can be a crucial strategy for reducing mortality risk in older adults. Future studies incorporating objectively measured PA levels and sedentary behaviors are needed to validate this relationship.
One possible underlying mechanism may involve age-related impairments in the suprachiasmatic nucleus (SCN) of the hypothalamus, which orchestrates circadian physiology through downstream humoral and nervous signaling. 50 Age-related SCN impairments, such as neuronal degeneration and reduced arginine vasopressin release51–53 for example, can lead to dysregulation in overall circadian rhythms, including an earlier dim light melatonin phase onset. 54 At the level of peripheral organs and tissue beds, pre-clinical studies have demonstrated a significant age-related reduction in rhythmic gene expression, indicative of diminished circadian control. 55 The resultant disruption in circadian physiological function may contribute to impaired circadian behavior, as evidenced by disrupted RAR, which partially contributes to an increased susceptibility to disease and mortality. Taken together, disrupted RAR may serve as an essential pre-prognostic indicator of chronic age-related diseases such as MetS and frailty, and a predictor of mortality. RAR could also serve as a therapeutic target to improve the health span of older adults. Future experimental studies in this area are warranted.
Interaction Effects of Frailty, MetS, and RAR on the All-Cause Mortality Risk
We observed that MetS and frailty status moderated the associations of MetS, frailty, and RAR with all-cause mortality risk. Frail/pre-frail older adults with MetS had a higher risk of all-cause mortality compared to frail individuals without MetS, emphasizing the need to address MetS, particularly in frail/pre-frail older adults. Espinoza et al (2023) reported similar results showing a significant link between frailty and mortality, but the coexistence of MetS didn’t significantly contribute to this relationship. 17 Similarly, in our sensitivity analysis including additional relevant covariates (i.e., sleep disorders and caffeine intake), the previously significant association between frailty and mortality in the MetS group was attenuated [HR (95% CI) = 1.67 (0.97−2.86); Model 3, eTable 3]. However, the trend remained evident, with the estimate only slightly deviating from the statistical significance level, and the association between pre-frailty and mortality remained significant only in the MetS group. This inconsistency in the interrelationship between frailty, MetS, and mortality may be explained by the healthy survivor effect among older people, whereby healthy lifestyle behaviors potentially mask the impact of diseases. For instance, non-MetS individuals in our study tended to engage in more MVPA, exhibited healthier RAR characteristics, and experienced fewer sleep disorders than those with MetS. This healthy and active lifestyle may reduce the effect of frailty on mortality among non-MetS individuals. For better understanding, future studies are needed to incorporate objectively measured PA data to examine their interactions with frailty and MetS in predicting mortality risk. Not only for the moderating role of MetS, but frailty also played a significant role in the associations of MetS and low RA with all-cause mortality (eTable 4). We found that frail/pre-frail individuals with MetS or low RA had a significantly higher risk of mortality than their non-frail counterparts with MetS or low RA. Given that MetS alone did not significantly predict mortality risk, this finding provides critical insights into the comorbid risk of MetS in older adults, reiterating the need to manage frailty in older adults with MetS.
The association between low RA and mortality was consistently robust, exclusively among older adults with MetS or frail/pre-frail older adults, suggesting that low RA is a strong predictor of mortality among at-risk populations. Moreover, we confirmed that low RA was still a robust predictor of all-cause mortality among individuals with both frailty and MetS (eTable 5). Considering that circadian rhythms are closely associated with the human physiological/biological cycles and regulate metabolism,6,56 the coexistence of MetS, frailty, and disrupted RAR might exacerbate the dysregulation of the metabolic system and contribute to an increased risk of mortality. Further experimental and longitudinal studies are needed to better understand their complex relationship and the underlying mechanisms.
Strengths and Limitations
To the best of our knowledge, this is the first study investigating the associations of frailty, MetS, and RAR with all-cause mortality to identify the significant risk indicators among older adults. Our study included a nationally representative sample of US older adults. It explored the comprehensive associations of the prevalent health outcomes in older adults (i.e., frailty, MetS) and modifiable risk factors (i.e., RAR) with mortality risk by adjusting for various potential confounders at the population level. We identified notable findings with crucial public health implications, underscoring the importance of screening and addressing MetS, frailty, and RAR to reduce mortality risk, particularly in at-risk older populations, as an essential step toward improving their well-being.
Nevertheless, it is essential to acknowledge certain limitations. We used modified Fried physical frailty criteria, consisting of self-reported measures, which may potentially introduce bias when defining frailty status. However, each modified frailty indicator has been validated in large population-based studies.29,57 Additionally, our study relied on a non-parametric approach to characterize RAR profiles. Due to the lack of gold-standard measures for both frailty and RAR, further research using various assessment tools for frailty and RAR is needed to validate our findings and identify better methods for the older adult population. The cross-sectional design of NHANES prevents us from inferring the possible bidirectional relationships and temporal sequence between frailty, MetS, and disrupted RAR. Although we accounted for a range of covariates that could influence the associations of interest, certain unmeasured confounders relevant to our study outcomes (e.g., psychiatric conditions, use of psychiatric or sleep medication) may not have been fully addressed due to the inherent limitations of covariate selection. Moreover, the self-reported nature of some covariates, such as comorbidity status, may limit our ability to fully adjust for their potential confounding effects on the observed associations among RAR, frailty, and MetS, with mortality. Future studies incorporating a broader range of potential confounders, including clinically validated or laboratory-based measures, would be valuable for evaluating the robustness of the observed associations. More longitudinal and experimental studies are necessary to elucidate their dynamic relationships and develop tailored intervention strategies for vulnerable older adults.
Conclusion
Frailty and disrupted RAR, particularly low RA, IS, and L5, are significant short-term indicators of all-cause mortality in older adults. The coexistence of frailty and MetS, along with low RA, exacerbates the risk of all-cause mortality. Thus, monitoring frailty, MetS, and RAR is critical for identifying health risks in older adults. Strategies to enhance RAR by improving its stability and robustness, especially by reducing nighttime activity, may be effective for older adults’ long-term health. Considering individuals’ RAR patterns, as well as their frailty and MetS status, could be beneficial for developing personalized intervention strategies in older adults.
Supplemental Material
Supplemental Material - Identifying Risk Factors for All-Cause Mortality in Older Adults: Rest-Activity Rhythm, Frailty, and Metabolic Syndrome
Supplemental Material for Identifying Risk Factors for All-Cause Mortality in Older Adults: Rest-Activity Rhythm, Frailty, and Metabolic Syndrome by Jisu Kim, Jonathan Kenyon, Lana Sargent, Danielle L Kirkman, and Youngdeok Kim in American Journal of Lifestyle Medicine
Consent to Participate
All NHANES participants provided informed consent.
Footnotes
Author Contributions
Data curation: JisuK; Formal analysis: JisuK and YK; Investigation: JisuK, JonathanK, DLK, LS, and YK; Methodology: JisuK.and YK; Project administration: JisuK. and YK; Writing original draft: JisuK; Writing review and editing: JisuK, JonathanK, DLK., LS, and YK.
Declaration of Conflicting Interests
The authors declared no potential conflicts of interest with respect to the research, authorship, and/or publication of this article.
Funding
The authors received no financial support for the research, authorship, and/or publication of this article.
Ethical Approval
The NHANES was approved by the NCHS IRB (NCHS IRB/ERB Protocol#2011-17).
Supplemental Material
Supplemental material for this article is available online.
References
Supplementary Material
Please find the following supplemental material available below.
For Open Access articles published under a Creative Commons License, all supplemental material carries the same license as the article it is associated with.
For non-Open Access articles published, all supplemental material carries a non-exclusive license, and permission requests for re-use of supplemental material or any part of supplemental material shall be sent directly to the copyright owner as specified in the copyright notice associated with the article.