
Abstract
Introduction: An acidic urine pH may be protective against urinary tract infections (UTI) by inhibiting bacterial growth. We investigated whether dietary acid load (DAL) and macronutrient intake are associated with changes in urine pH in postmenopausal (PM) women with recurrent UTI (rUTI). Methods: Following Institutional Review Board (IRB) approval, we collected 3-day food diet records (FDR) and urine pH measurements from non-neurogenic PM women with a history of rUTI and normal renal function from 2019-2023. FDR were analyzed for nutrient content using Nutritionist Pro software (Axxya Standalone Version 7.9). Results: Fifty-seven participants (median age 71, predominantly Caucasian) supplied 504 meal records and 674 urine pH readings. Carbohydrate intake varied: 30 women consumed a moderately low-carbohydrate diet (<44% of calories), and 27 consumed an unrestricted carbohydrate (CHO) diet (≥44% of calories). Dietary intake varied between the two CHO groups for protein, fat, and the percentage of calories, but no significant differences were found in number of calories, other nutrients (potassium, phosphorus, magnesium, calcium, sodium), or DAL scores. No significant associations were found between DAL scores and urine pH. Conclusion: In this age group, carbohydrate intake did not affect DAL scores, indicating a discrepancy between DAL measurements and urine pH findings.
“Protein intake is one of the main predictors of the PRAL score, and other micronutrients (potassium, magnesium, calcium, and phosphorus) also influence PRAL.”
Introduction
Urinary tract infections (UTI) are the most common bacterial infection in women, with 50%–60% experiencing at least one in their lifetime. 1 Among women aged 55-75 years old, UTI are a common condition, with 7% affected each year. 2 Of those women who develop a UTI, up to 53% will experience a relapse within a year. 3
Treatments for UTI can become costly, with medical costs estimated at 2.3 billion in 2012 for managing UTI in 22 million USA patients. 4 Although uncomplicated UTI usually require only a short course of antibiotics, current guidelines on the management of rUTI indicate that these women may require antibiotic self-therapy, long-term daily antibiotic prophylaxis, or further treatment. 5 Methods for preventing rUTI include: vaginal estrogen, low-dose antibiotics, postcoital antibiotics, cranberry juice, probiotics, methenamine hippurate, and/or D-Mannose.6-8
It is known that acidic environments are unfavorable for bacterial growth, possibly leading to decreased UTI frequency and recurrence.9,10 Acidic urine is thought to be protective against UTI, since low pH generally hinders the growth of common uropathogens, like E. coli and Klebsiella.9-11 Low pH inhibits bacterial growth due to cellular damage caused by acidic stress on bacteria, including uropathogens. Abnormal proton gradients lead to protein unfolding, membrane breakdown, and DNA strand breaks, which ultimately lead to the demise of the bacteria. 9 This concept, however, has not been well studied with regard to urine acidity. Although low urine pH may be detrimental to bacterial growth, a study by Shields-Cutler et al. found an increase in bodily production of siderocalin (an antimicrobial protein) at higher urine pHs, which may be the body’s way of adapting to a urinary environment less harmful to bacteria. 12 In a recent study examining the 3-day variations of urinary pH at home before meals, and correlating these findings with a dietary recording, we observed distinct urine pH behaviors in PM women with rUTI, with one group exhibiting a sustained low pH (<6) trend. 13
Diet impacts the body’s acid-base balance, which is partially maintained by the kidney’s excretion or reabsorption of acids in urine. The potential renal acid load (PRAL) of different foods can be calculated from their chemical compositions to measure daily net acid excretion (NAE), which is related to the pH of the urine.14,15 For over two decades, the PRAL has been the standard calculation associated with urine pH.15,16 Most fruits and vegetables have a negative PRAL, while meat, poultry, seafood, animal products, and grains have a positive PRAL. 15 Acidic diets often are higher in protein, saturated fat, sugar and cholesterol, and lead to more risk factors for disease. Dietary PRAL and urine pH have been studied to understand how this may affect several health conditions such as bone density, metabolic disorders, and kidney stones.17-21
Changes in urine pH after dietary intervention have been observed in all age categories. Such changes were often found seven days following specific dietary patterns: increasing fruits and vegetables led to a more alkaline pH, 18 and increasing protein (2 g/kg) was associated with a more acidic urine pH.19,20 Trends in following a high-protein, low-carbohydrate diet to increase metabolic acidosis/ketosis have increased in the past decade. Often these diets are followed by athletes to gain muscle mass, diabetics to control glucose, and many individuals trying to lose weight. A large sample of adult-derived data taken from the National Health and Nutrition Examination Survey (NHANES) were compared based on total energy from carbohydrate (CHO from the three chemical components of carbohydrates: carbon, hydrogen, and oxygen) intake: very low (<26% total energy from CHO), moderately low (26%–44% total energy from CHO), and no CHO restriction diets. 22 They found that there was a significant association between PRAL and CHO intake group, with the lower CHO intake groups exhibiting higher PRAL than those with no CHO dietary restriction.
For elderly and PM women, the relationship between NAE, PRAL, and urine pH suggests that the kidney’s urinary excretion in this age group may be more sensitive to changes in dietary intake.23-25 When comparing diets of omnivores, lacto-ovo vegetarians, and vegans, Ausman and colleagues found that NAE was a relevant predictor of urine pH. 23 Gunn and colleagues found similar results related to bone health (reduced bone turnover) in PM women, noting that the urine pH was significantly increased in participants who changed to a diet with increased fruits, vegetables, and herbs, as compared to the control group who had no change in diet (P < 0.001). 24 They also observed that calcium excretion was associated with the dietary sources of potassium.
Our goal was to study the association of PRAL, macronutrient intake, and nutrients that influence PRAL and their effects on urinary pH in PM women with a history of rUTI. Our hypothesis was that those who consumed lower CHO diets and higher protein diets would have significantly higher PRAL and lower urine pH.
Methods
Study Population and Ethics
Following Institutional Review Board (IRB) approval, women under the care of a single URPS (urogynecology and reconstructive pelvic surgery) physician practicing at a tertiary care urology clinic were recruited and consented from February 2019 to April 2023. Postmenopausal women (>55 years old) with a documented history of uncomplicated rUTI
26
(
Demographics, clinical characteristics (including height and weight), UTI history, and urine culture information were gathered from their electronic medical records (EPIC) and reviewed by a third-party investigator not involved in the care of these patients.
Urine and Dietary Data Collection
During the enrollment visit, all women provided a baseline urine sample, which was sent for culture, and they each received 100 11-panel QTEST urinalysis reagent strips (Medimpex United Inc, Bensalem, PA). Participants were given standardized charts and forms (See Appendix A and Chavez 27 ) to record urine pH and urine glucose content at each collection time. They were also provided with a 3-day FDR for documenting food, beverage, and dietary supplement consumption on the same days urine pH measurements were obtained. Urine pH dipstick measurements occurred before each meal and prior to going to sleep. Verbal and written instructions on how to keep the FDR were given along with two examples of how to fill out the food diary chart (sample food diary). Patients were asked to refrain from taking any over-the-counter, non-prescribed supplements (vitamin/mineral) during the 3-day intake period.
Dietary Intake and Analysis
A registered dietitian not involved in the care of these women analyzed macro- and micro-nutrients reported from the FDR using Axxya Systems Nutritionist Pro™ software Version 7.9.0, independently licensed by the analyzer, to compute the energy and nutrient composition of all foods, beverages, and supplements. This system was selected because it has been well-established in the market, operates independently of a system network, allows manual input of food items and nutrient templates, and includes international databases of nutritional information. Documented food diary information was entered manually into the software system, and the database reported nutrient information referenced from either the United States Department of Agriculture (USDA) database or from reported nutrient information from the food product brand. When information from both sources was available, the USDA database was preferred.
Estimations of Dietary Acid Load
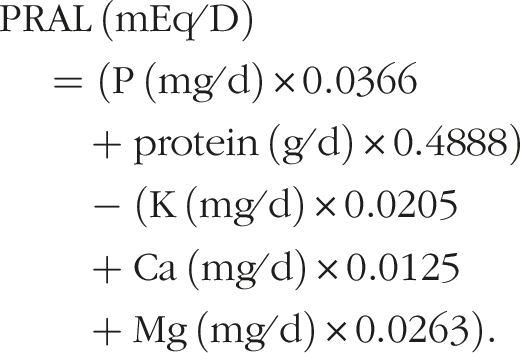
Dietary acid load (DAL) consists of the three calculations: PRAL, NEAPR and NEAPF. PRAL was calculated as a daily total using the following equations.
28
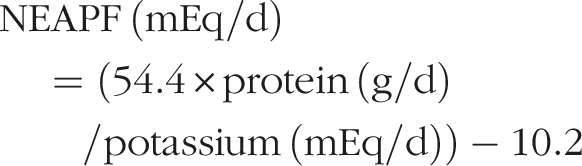
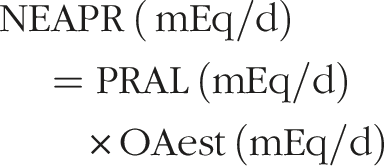
Net Endogenous acid production (NEAPF and NEAPR) were calculated using formulas proposed by Frasetto
29
and Remer,
30
respectively:
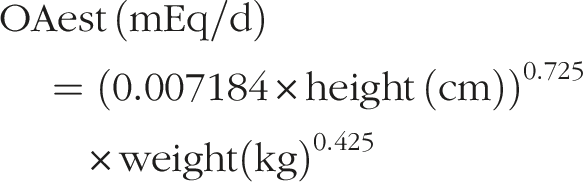
Organic acid excretion (OAest), was calculated for the formula above using the individual’s body surface area:
Per meal PRAL was similarly calculated, replacing the per day parts of the equations (“/d”) with per meal.
Statistical Analysis
As a quality control metric, we compared the nutrients and the calculated PRAL from the FDRs in our study group and manually matched to the same foods as reported in a reference study. 15 See Appendix B. We used a mixed-model analysis to look for associations between PRAL intake at a given meal and either change in urine pH or exact urine pH at the next measurement. We also analyzed this data while controlling for the CHO intake group, with reference to a dietary study of a national cohort from NHANES data, including men and women 18 years and older. 22 The daily PRAL total was computed and compared to urine pH throughout the following day. Women were stratified into a predominantly low urine pH group (at least 10/12 measurements ≤6) or high/fluctuating (three or more measurements >6) urine pH. 27 The diet composition of macronutrient intake per 1000 calories (protein, CHO, fat, calcium, potassium, magnesium, phosphorus, and sodium), macronutrient intake as a percent of total calories (protein, CHO, fat), and stratified percent of CHO intake (“CHO restricted”: <44%; “no CHO restriction”: ≥44%), 22 were also computed compared to PRAL and stratified between groups of women who had predominantly low or high urine pH trends. Scatter plots were visually assessed for major outliers; if any outliers were found, the analysis was completed both with and without the outliers. All analyses were completed at the P < 0.05 significance level without adjustment for multiple comparisons using SAS 9.4 (SAS Institute Inc Cary, NC).
Results
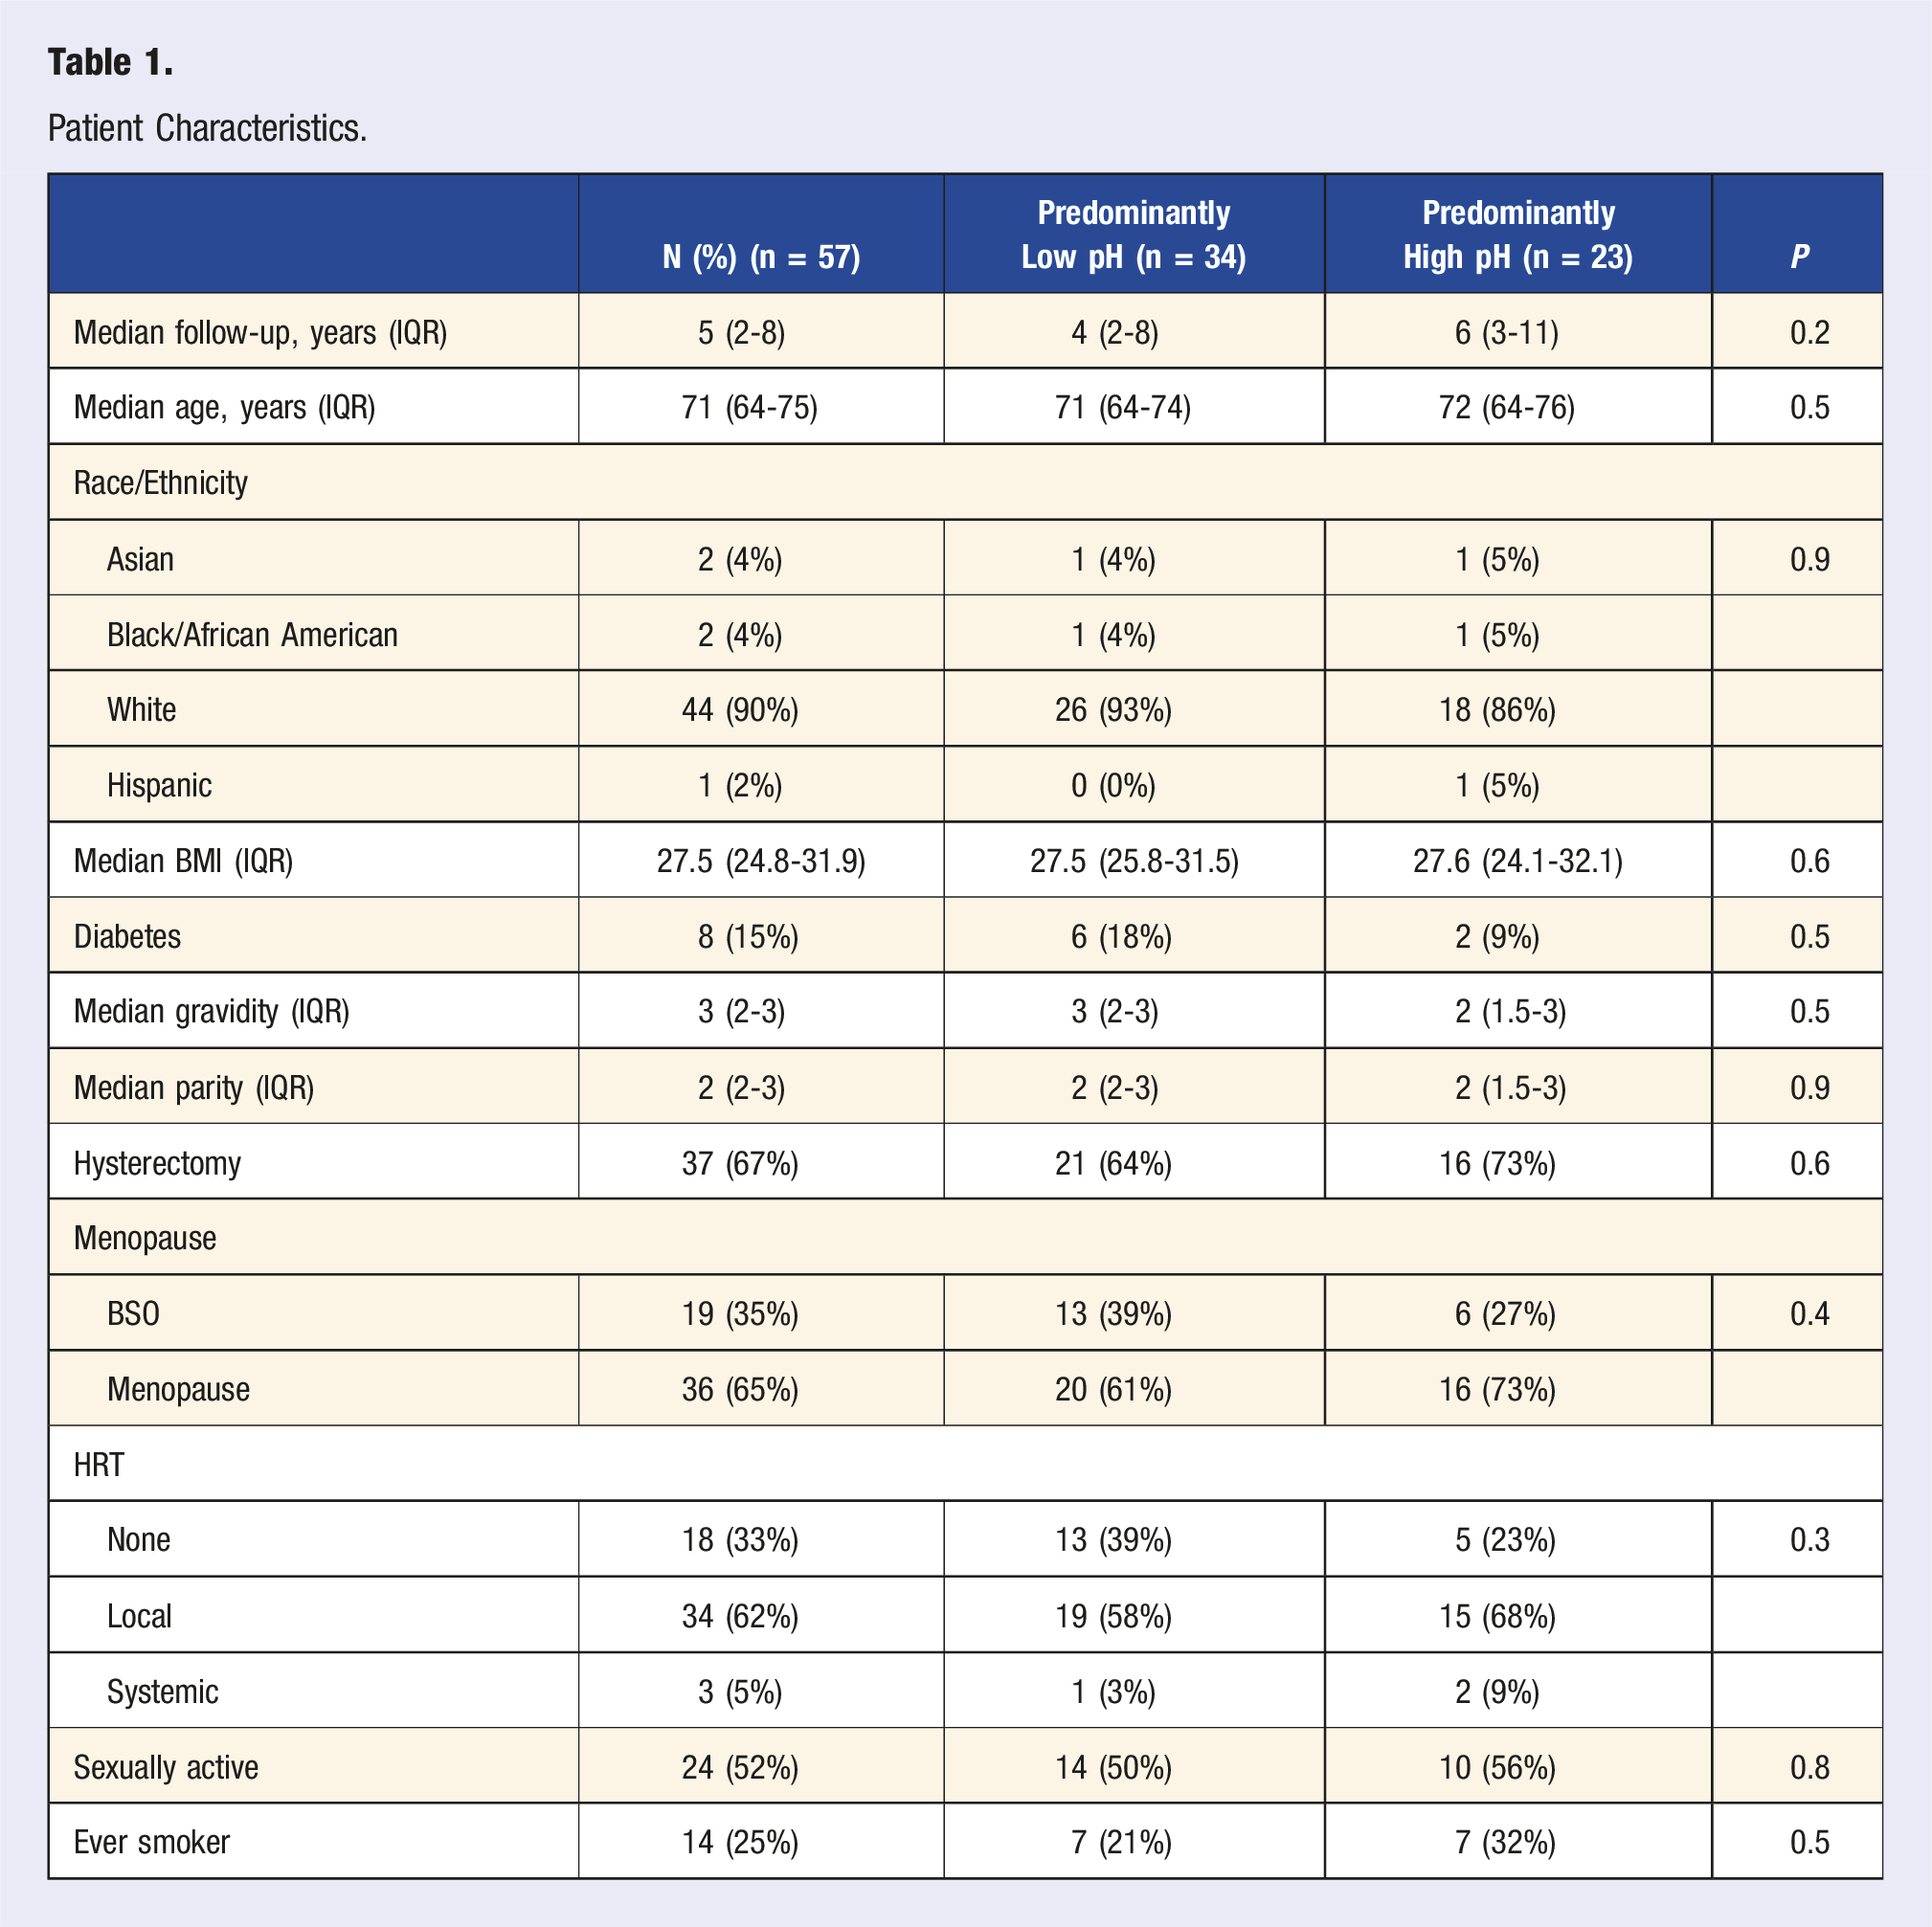
Patient Characteristics
Patient Characteristics.
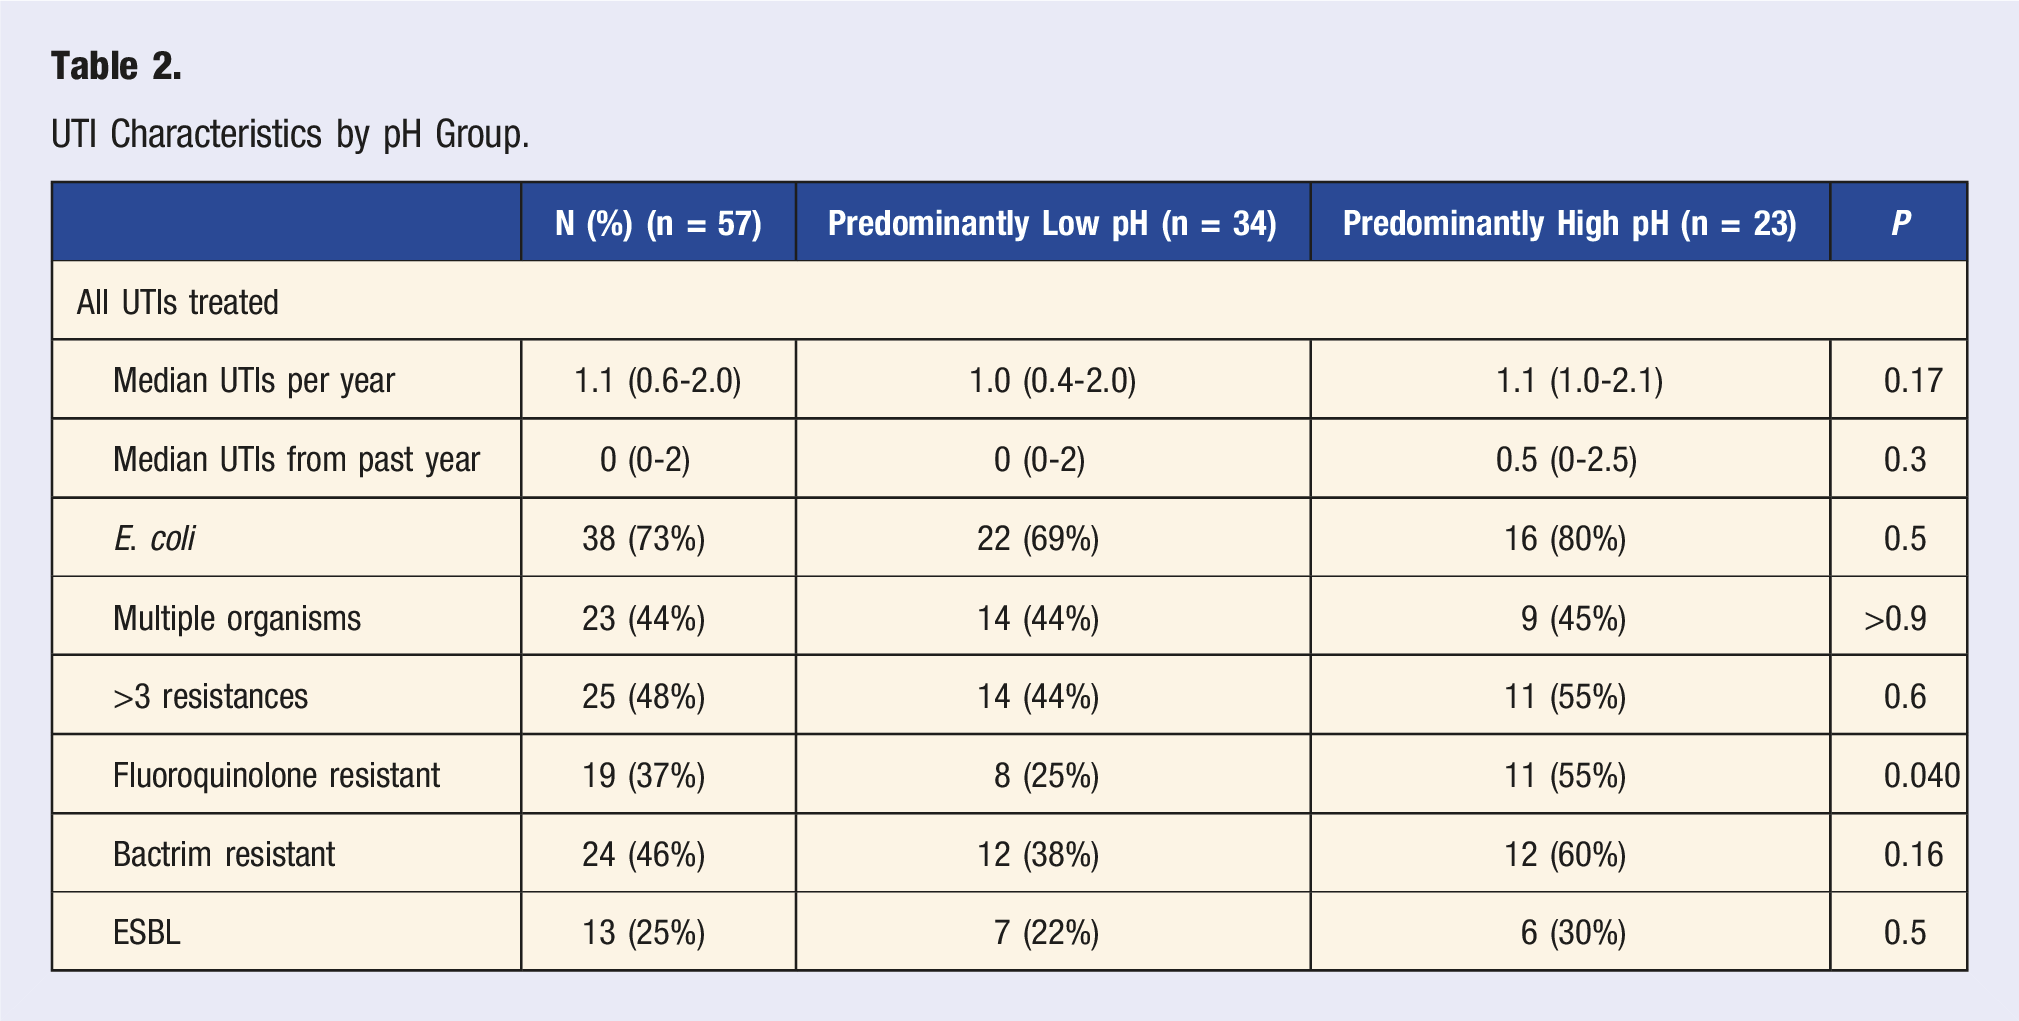
UTI Characteristics by pH Group.
Fifty-seven participants supplied 168 breakfasts, 167 lunches, and 169 dinners for diet analysis and 674 urine pH readings. We could not calculate PRAL for five meals, due to all foods from a single subject’s meal having the same missing nutrient(s).
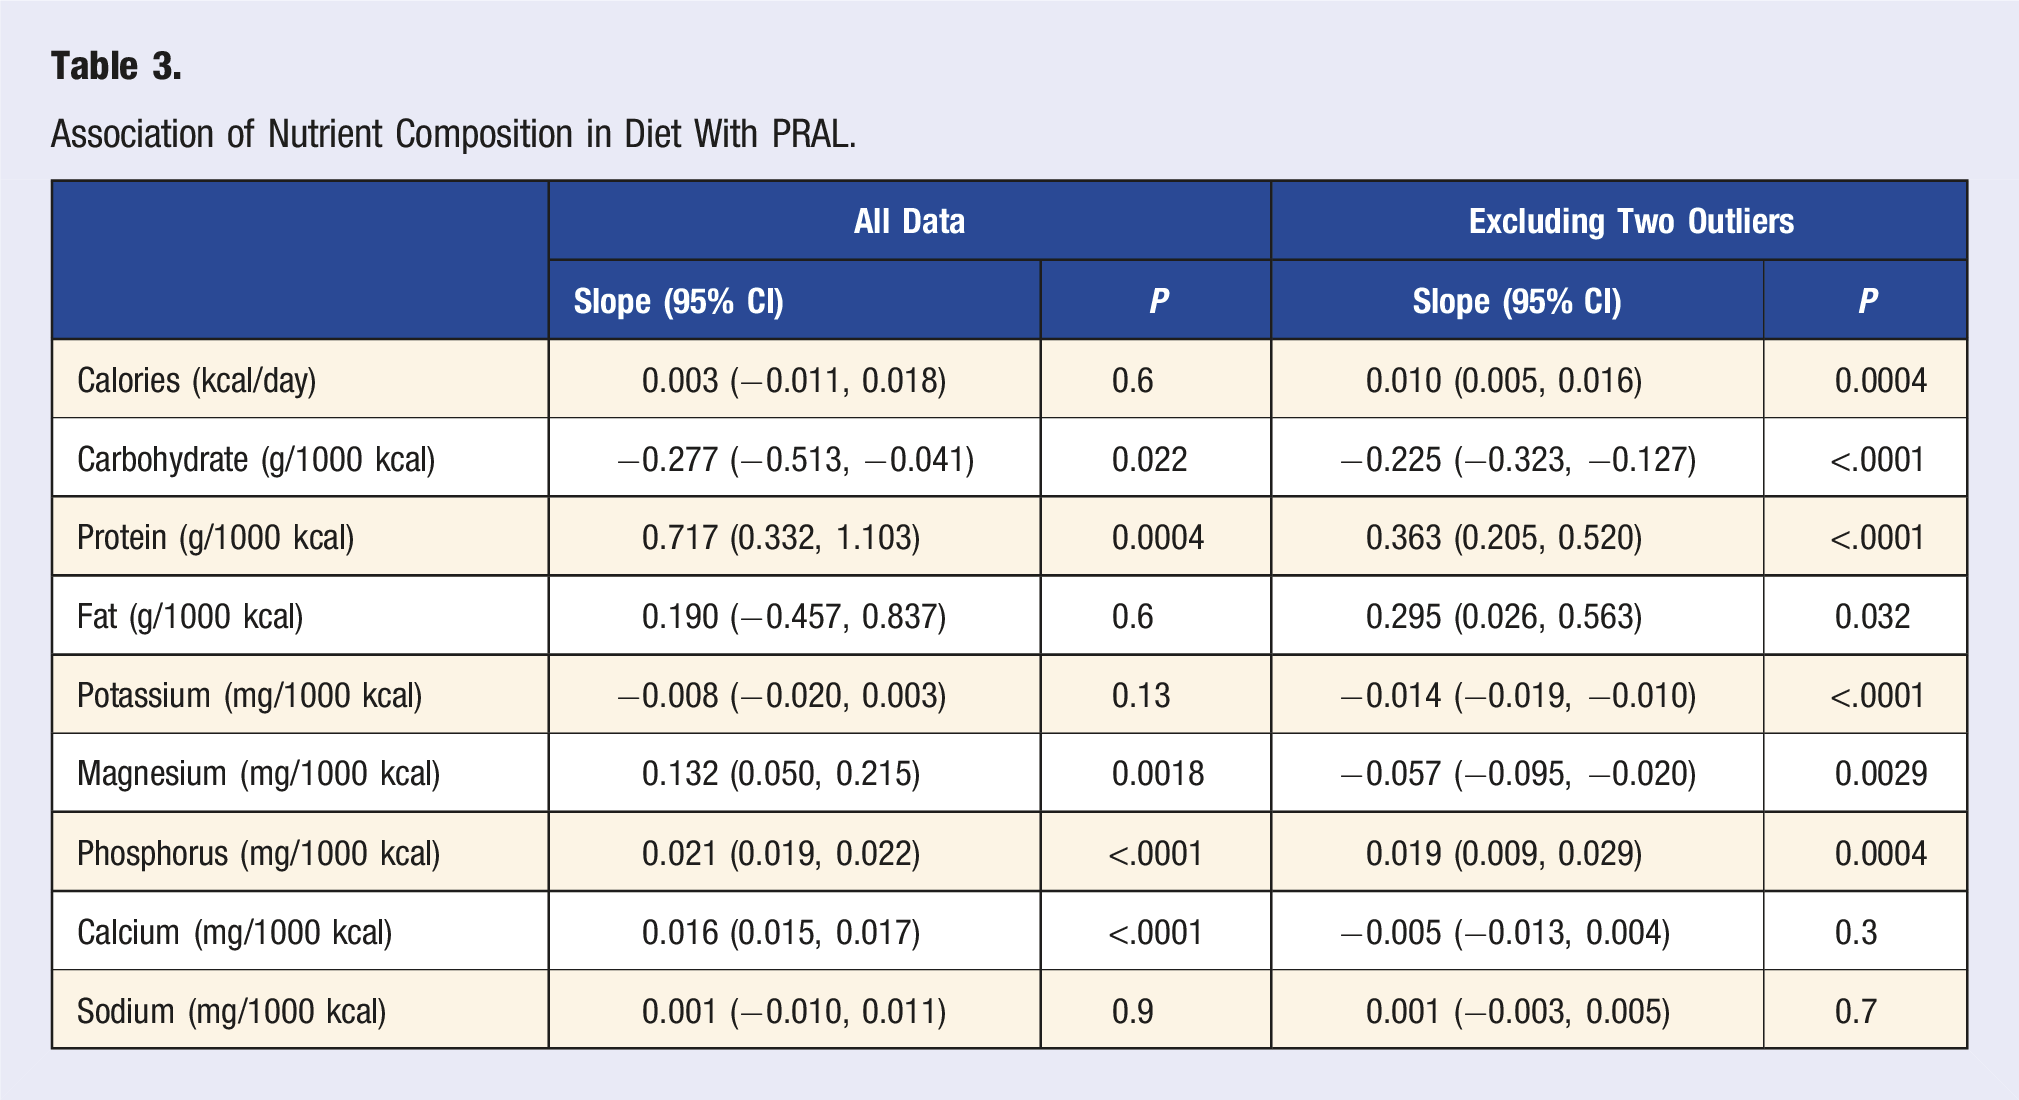
Nutrient Intake and PRAL
Analysis of the foods matched those reported by Remer 15 for PRAL, with most nutrients having 90% confidence intervals that overlapped zero (full description Appendix B), meaning that there was no difference in the reported nutrients between the two sources. The exceptions were all within a reasonable range of difference that would not be clinically meaningful.
Association of Nutrient Composition in Diet With PRAL.
Diet Composition Comparison in Our Study and a Reference NHANES Study.
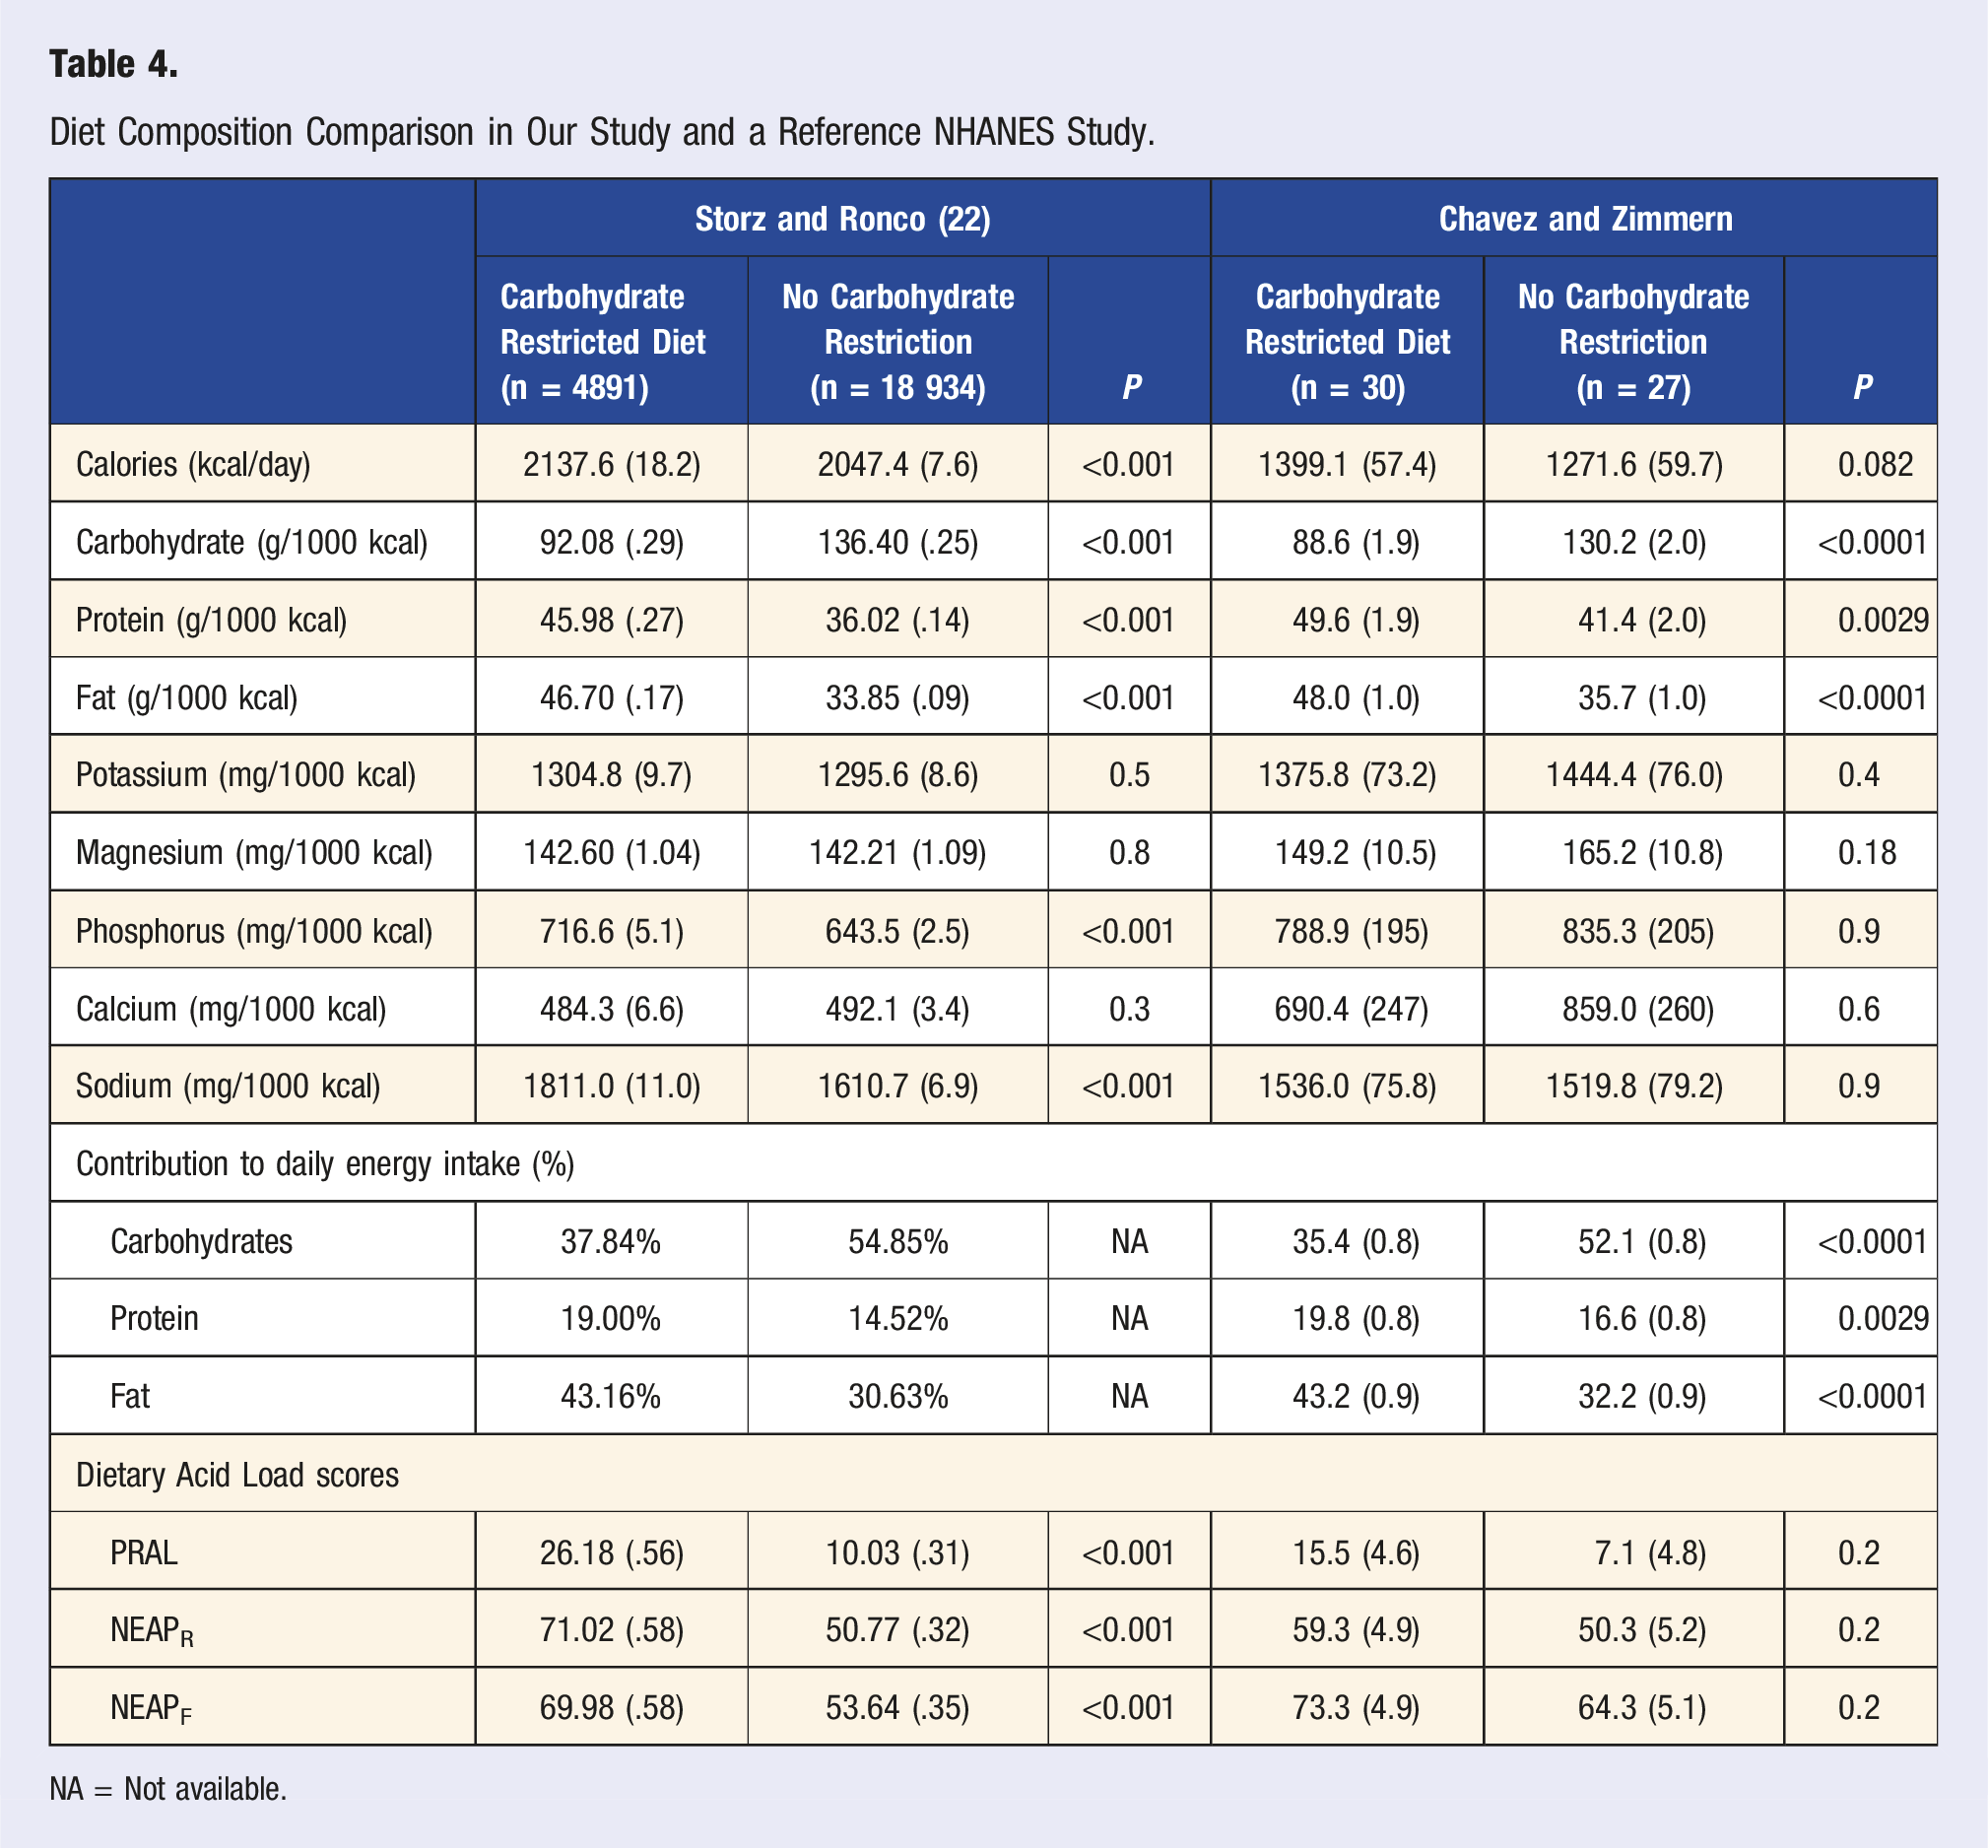
NA = Not available.
PRAL and Urine pH
Association of Change in Urine pH or Actual Urine pH With PRAL (by Daily Total or per Meal; Change per 10 mEq/D of PRAL).
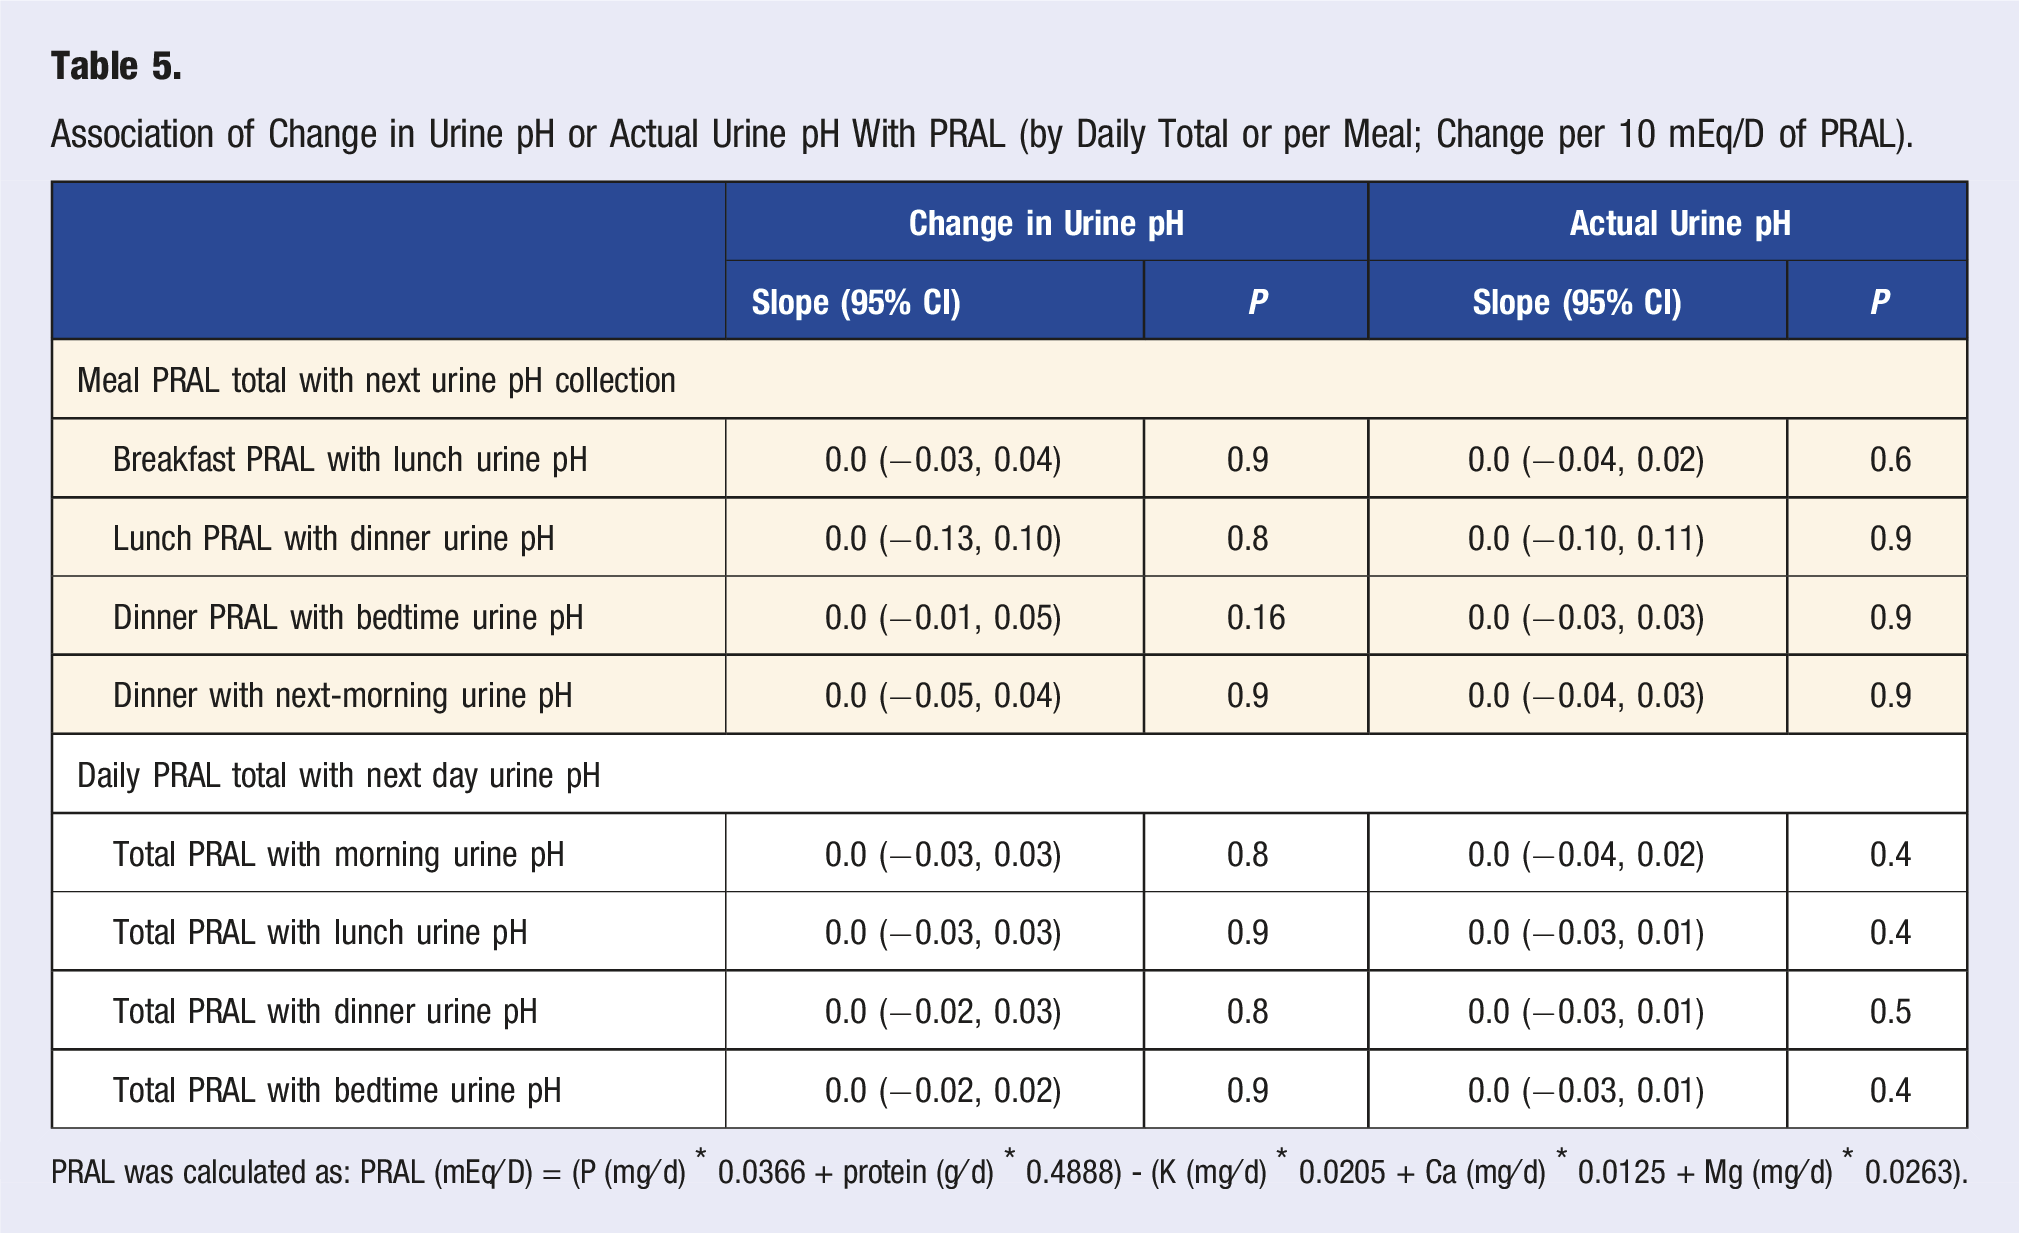
PRAL was calculated as: PRAL (mEq⁄D) = (P (mg⁄d) * 0.0366 + protein (g⁄d) * 0.4888) - (K (mg⁄d) * 0.0205 + Ca (mg⁄d) * 0.0125 + Mg (mg⁄d) * 0.0263).
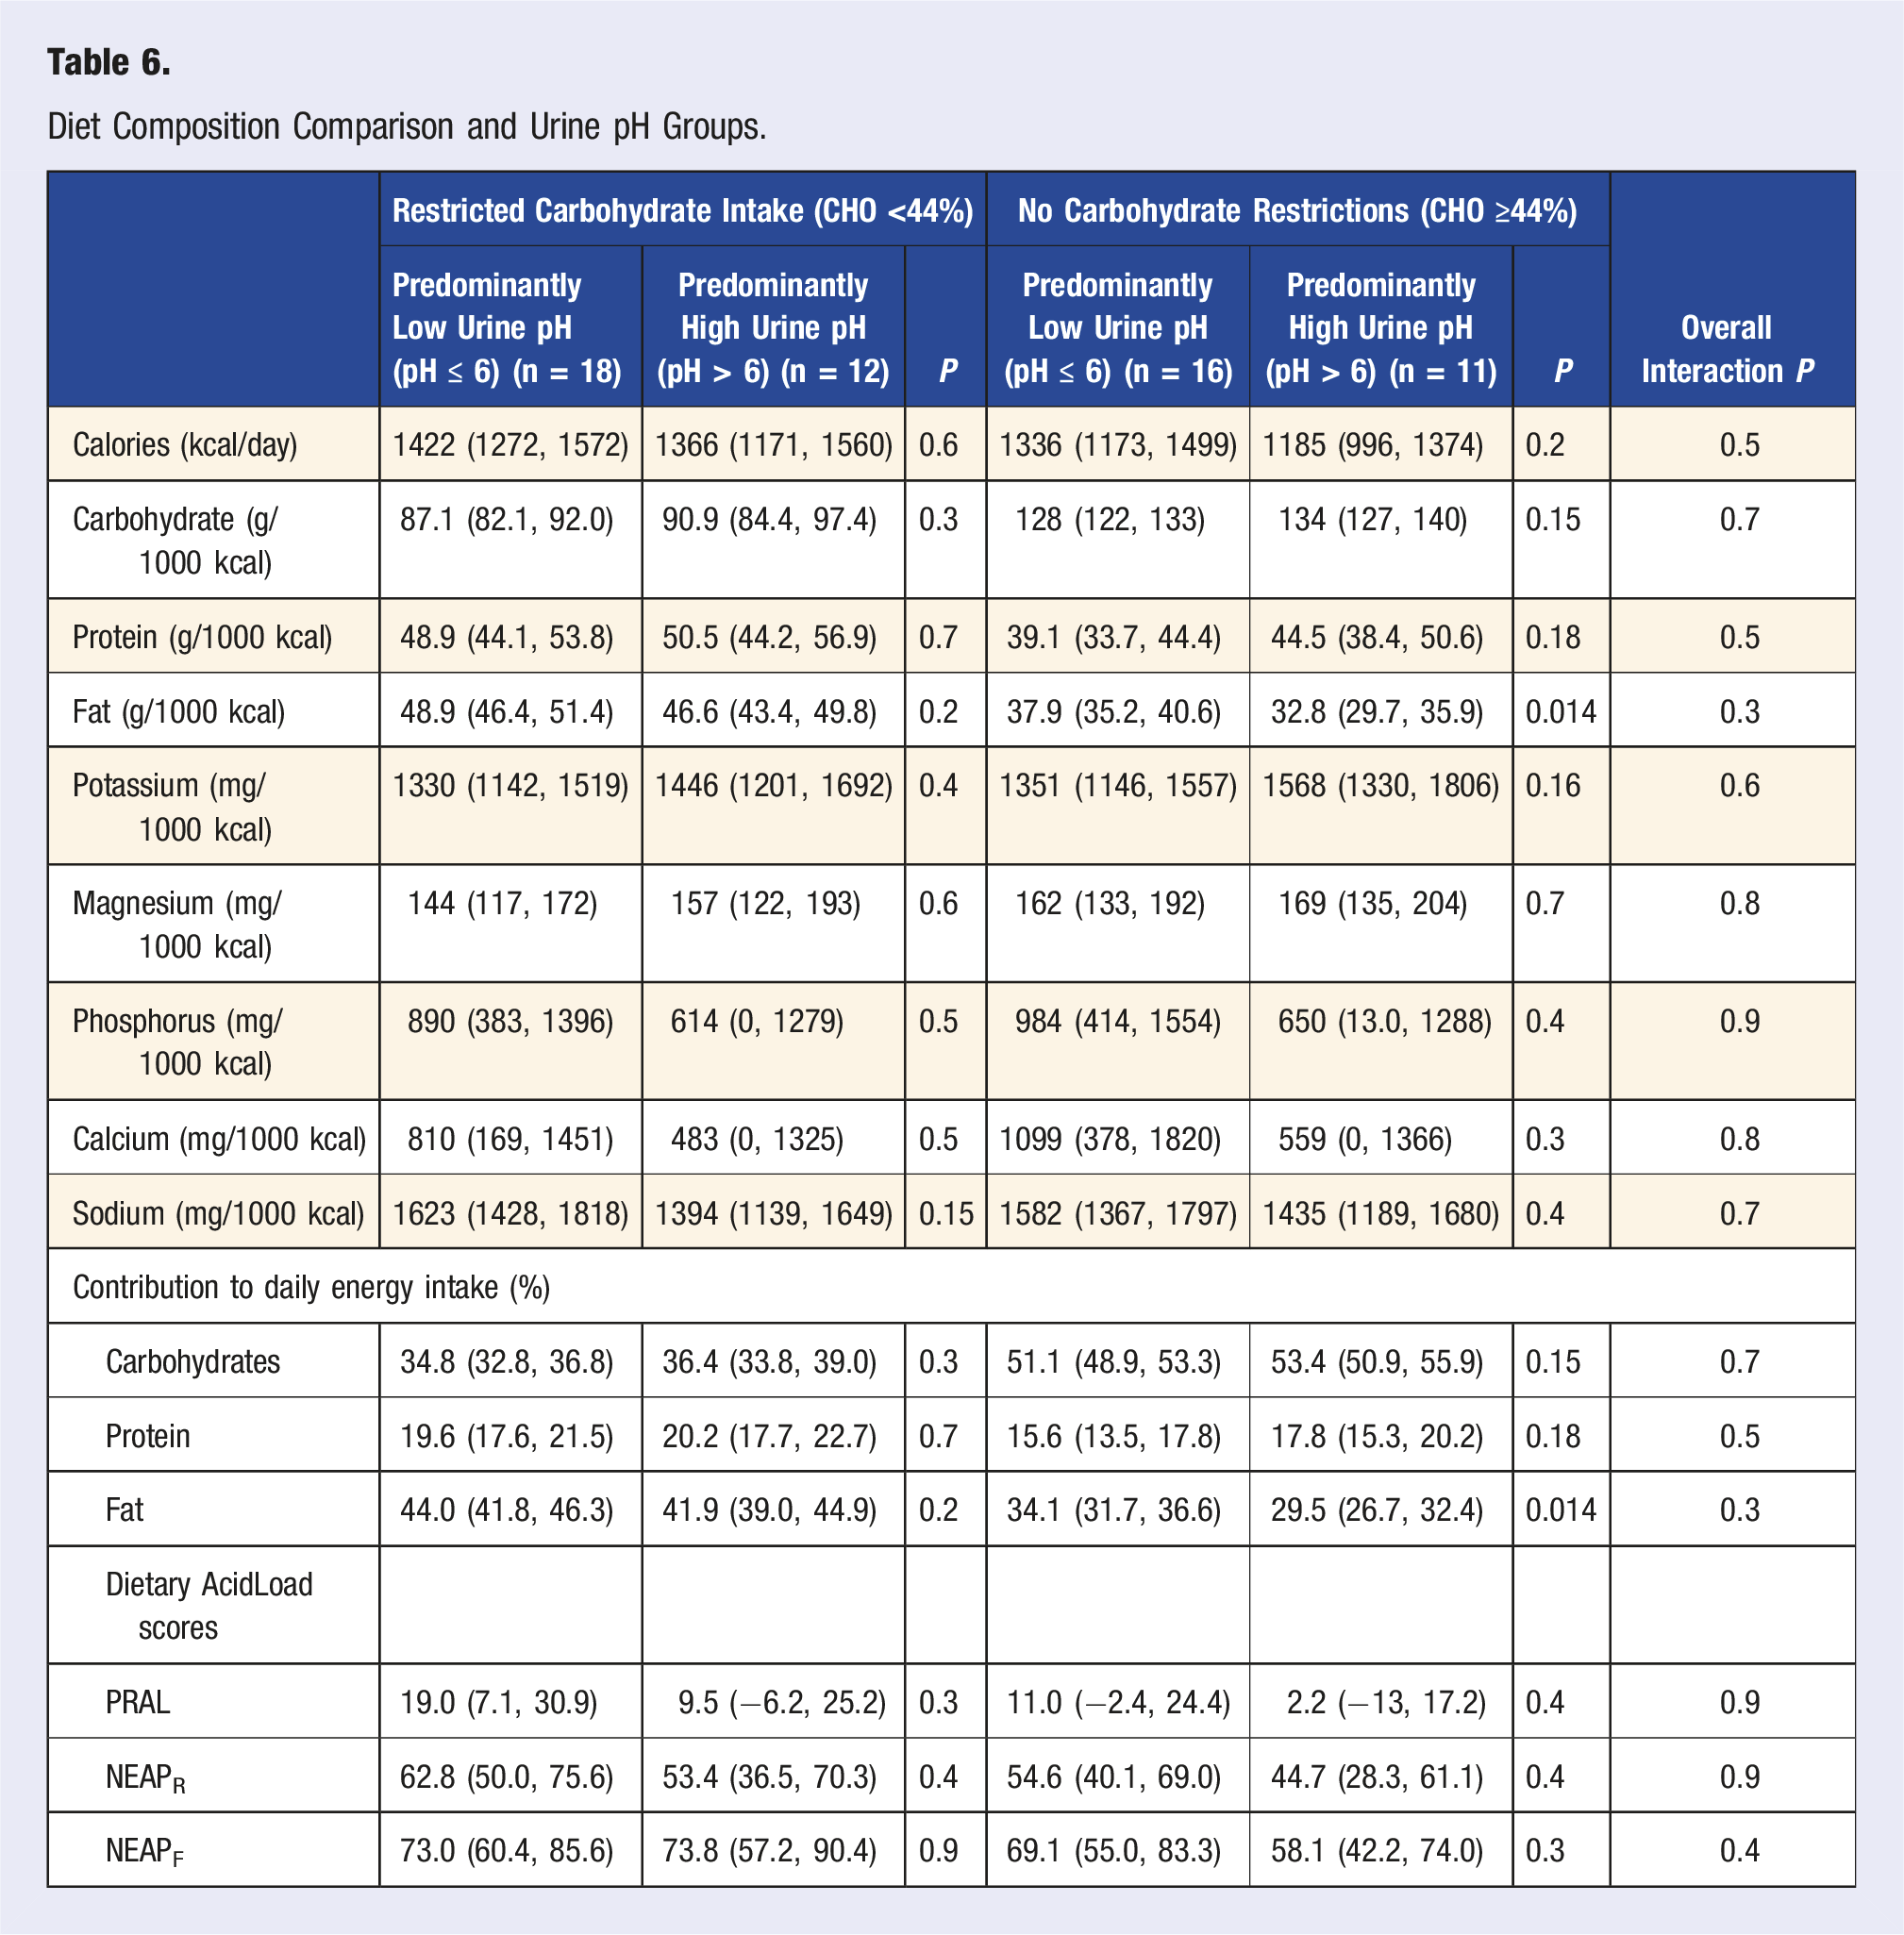
Diet Composition Comparison and Urine pH Groups.
Discussion
Our goal was to study the association of PRAL, macronutrient intake, and nutrients that influence PRAL and how they might affect the urinary pH in PM women with a history of rUTI. This study focused on dietary intake analysis for this specific population, and was driven by the hope to find alternative non-pharmacological interventions for these women eager to reduce their likelihood of another episode of UTI.
Dietary intake analysis for macronutrients (protein, CHO, and fat) were computed as a percent of calorie intake, specifically looking at CHO intake that was low, moderate, or unrestricted. 22 While there were no women in our cohort who had a very low CHO diet, we did not find the expected associations between moderate CHO restriction and lower urine pH or higher PRAL as compared to no CHO restriction. Without requesting individuals to follow a specific diet or adjust food preferences, we found it interesting that the number in both CHO groups were similar (n = 30 and n = 27, respectively). As expected, significant associations were found with the intake of protein, magnesium, phosphorous and calcium, and PRAL, verifying that all nutrients involved in the calculation were represented in the diet, as well as to identify the PRAL outliers. Significant associations were found with the intake of protein, magnesium, phosphorous and calcium, and PRAL. After excluding two outliers, all nutrients—except calcium and sodium—were associated with PRAL scores. The outliers we found were attributed to those who were consuming over-the-counter vitamin/mineral supplements that contained one or more of the nutrients included in the PRAL calculation.
We compared our results to a larger national dataset 22 to determine if similar patterns existed for all populations or if the PM group being studied varied. While the results from the national dataset found a difference in phosphorus and sodium intake based on CHO intake group, we did not see a similar difference in our study with PM women. Our findings also revealed no significant differences in CHO intake and any of the DAL scores, whereas the reference study did find significantly higher DAL scores in subjects consuming an unrestricted CHO diet compared to restricted CHO intake. Their cohort also had a subgroup with very low CHO intake, which had the lowest DAL scores of the three CHO intake groups. Storz and Ronco’s study included a larger data set (NHANES), with larger populations in both CHO intake groups, but also included pre-menopausal women as well as males.
One of the interesting findings was that fat contributed to the makeup of calories for those consuming lower CHO intake, which varied from recent trends where protein is the macronutrient that increases as carbohydrates decrease. This may be the factor that explains why the DAL scores were not affected. Since micronutrient intakes were not varied among groups, this leads to investigating if specific food sources in low vs no CHO diets may affect urine pH and DAL.
Another fascinating finding was that when comparing nutrient density in our population with the Storz and Ronco study, 22 we found that while intake of calories compared to the reference population was lower, the relative intake of other macronutrients of interest (g/1000 kcal) was comparable. The average intake of nutrients consumed for the PM women met the nutrient density reference intake for this age group, 31 but mean caloric intake (mean ± standard error = 1339 ± 47.3) was below the U.S. average of women aged 60-69 years old (1789 ± 63.5), as well as those women aged 70 years and older (1662 ± 38.5). 32
Furthermore, we were interested in the relationship between urine pH, PRAL, and dietary intake. After stratifying for individuals whose urine pH was predominantly below 6 (acidic) and those whose urine pH was predominantly above 6, as well as CHO intake, the only significant difference was found in fat intake and urine pH for those consuming an unrestricted CHO diet. This finding is consistent with results from our previous studies, where fat intake has been associated with higher urine pH.27,33,34
In this study, we validated our nutrient analysis to the standard measures of PRAL values found in foods (Appendix B). Similar correlations were identified in four of the five nutrients used in the PRAL calculation, with only calcium not being correlated. However, none of these nutrients were significant between the CHO intake groups and the two urine pH groups. Protein intake is one of the main predictors of the PRAL score, and other micronutrients (potassium, magnesium, calcium, and phosphorus) also influence PRAL. Unlike the significant differences between CHO groups found by Storz and Ronco, our study group of PM women exhibited no significant differences for the nutrient density of micronutrients. Moreover, when comparing the nutrient intake of our cohort of PM women to those reported in the study by Gunn et al with PM women, 24 and to the dietary reference intake, 31 our group had lower caloric, potassium, and magnesium intakes, and greater calcium and sodium intakes.
The Gunn study also revealed an association between increased intake of fruits and vegetables, and lower PRAL and calcium conservation, which in turn, was protective for bone density. 24 These authors noted that the influence of a decreased calcium excretion, rather than an increase in potassium intake, was significant and suggested a possible relationship between kidney function and older individuals becoming more sensitive to dietary changes. The influence of lower CHO intake and high fruit and vegetable intake provides a segue to exploring the consumption of specific types of food group servings in our population, as well as differentiating between intake of saturated and unsaturated fats, and how this may affect both urine pH and PRAL values.
Strengths/Limitations
Strengths of this study included access to a detailed electronic medical record and long-term follow-up data on urine cultures and susceptibilities in a well-characterized group of PM women for whom urine pH trends were available from a prior study investigating the relationship of urine pH to dietary intake. 27 We purposefully have not requested these women to change dietary intake nor usual intake, providing with more real-world daily dietary habits and intake patterns.
A limitation of this study is that the patients may have incorrectly interpreted their urine pH dipsticks or omitted foods/beverages from the FDR, which would introduce errors to the data. Despite close follow-up of these women over time, it is always possible that some treated UTI episodes at outside facilities were overlooked if not included in our electronic medical record system. Finally, while our sample size of 57 PM women is large enough to provide general associations in the data, further studies with larger sample sizes must still be completed to understand the mechanisms driving the associations.
Future Work/Conclusion
Our preliminary data indicated that there is a discrepancy between PRAL measurements and urine pH findings. This novel observation may be explained by the nature of only having spot urine checks four times a day, a younger population for establishing the PRAL calculation, or internal renal metabolisms not directly impacting urine pH. Diet composition did not vary as in other studies, especially for protein consumption, leading to continued interest in macronutrient/total energy intake, dietary patterns (i.e., fruit/vegetable intake, take-out foods, fluid intake, and consumption of supplements), UTI episodes, urine pH trends, and PRAL (or other indices of renal function) to improve rUTI management. Our ultimate goal is to study dietary variations in women across urine pH groups using a case-controlled study as we continue to increase enrollment, and to examine pre-menopausal patients as well.
Supplemental Material
Supplemental Material - Deciphering the Complex Relationships Between Potential Renal Acid Load, Carbohydrate Intake, and Urine pH in Postmenopausal Women With Recurrent Urinary Tract Infections
Supplemental Material for Deciphering the Complex Relationships Between Potential Renal Acid Load, Carbohydrate Intake, and Urine pH in Postmenopausal Women With Recurrent Urinary Tract Infections by Juliann M. Chavez, Alana L. Christie, and Philippe E. Zimmern in American Journal of Lifestyle Medicine.
Footnotes
Acknowledgments
The authors wish to thank Dr Sarah Mason Eck, PhD, for her review and editing of this manuscript.
Author contributions
Chavez—Supervision, Protocol/project development, data collection and management, data analysis, manuscript writing/editing. Christie—Data collection and management, data analysis, manuscript writing/editing. Zimmern—Supervision, Protocol/project development, data collection and management, data analysis, manuscript writing/editing.
Declaration of conflicting interests
The author(s) declared no potential conflicts of interest with respect to the research, authorship, and/or publication of this article.
Funding
The author(s) received no financial support for the research, authorship, and/or publication of this article.
IRB Statement
STU 042018-070, Recipient: Philippe E. Zimmern.
Ethical Statement
Data Availability Statement
The datasets generated during and/or analyzed during the current study are available from the corresponding author on reasonable request.
Supplemental Material
Supplemental Material for this article is available online.
References
Supplementary Material
Please find the following supplemental material available below.
For Open Access articles published under a Creative Commons License, all supplemental material carries the same license as the article it is associated with.
For non-Open Access articles published, all supplemental material carries a non-exclusive license, and permission requests for re-use of supplemental material or any part of supplemental material shall be sent directly to the copyright owner as specified in the copyright notice associated with the article.