
Abstract
Hyperuricemia (HUA) is a metabolic disease with an increasing prevalence in China and worldwide. Few studies have focused on the relationship between daily dietary quality and hyperuricemia in China. Data were obtained from the China Health and Nutrition Survey (CHNS). Adults with complete dietary survey and uric acid data were selected for the study, along with complete data on covariates about demographics, lifestyle, and history of disease. The Chinese Healthy Eating Index (CHEI) was used to reflect the quality of daily diet. The logistic regression model and weighted quantile sum (WQS) regression model were used to explore the relationship between CHEI score and risk of HUA. WQS regression models can also further assess the contribution of the various dietary components of CHEI in reducing the risk of HUA. There was a not-significant trend in protective effect between higher CHEI scores and HUA risk in the logistic regression model. In the WQS model, higher CHEI scores showed a significant protective effect on the HUA (OR: .601,0.298-.907). Fruits, tubers, and dairy were top contributor in the protective effect of CHEI (26.81%, 14.34%, and 12.95%, respectively). Higher CHEI associated with lower HUA risk in Chinese adults, and more attention should be paid to fruits, tubers, and dairy.
“The WQS model found that fruits, roots, and dairy products contributed the most to the overall health effect.”
Introduction
The disorder of purine metabolism in the body, maintaining high levels of blood uric acid for a prolonged period, is referred to as hyperuricemia. 1 Hyperuricemia is widely acknowledged as a significant global public health concern. Epidemiological studies have highlighted a concerning rise in the prevalence of hyperuricemia among Chinese adults. The overall prevalence of hyperuricemia in the Chinese adult population increased from 11.1% in 2015-2016 to 14.0% in 2018-2019. Specifically, compared to the 2.8% in females from 2015-2016, the prevalence rose to 3.6% in 2018-2019. Hyperuricemia is more common in males, with a prevalence of 19.3% in 2015-2016 and 24.4% in 2018-2019. 2 Hyperuricemia is also an independent risk factor for multiple diseases, with gout being the most common. 3 Hyperuricemia is strongly associated with chronic diseases such as diabetes and hypertension, leading to reduced quality of life and increased medical and care costs.4-6
To prevent and treat hyperuricemia, the primary focus of relevant guidelines is to maintain normal uric acid levels through adopting a long-term healthy lifestyle. This includes adhering to a healthy diet, maintaining reasonable work and rest routines, engaging in regular exercise, among other practices. Additionally, urate-lowering drugs like febuxostat and allopurinol are commonly prescribed as part of the treatment regimen.7,8 Due to the long-term effects of diet, more and more studies are focusing on the relationship between diet and uric acid metabolism.9-11 Research is not limited to a single food group or nutrient, but also focuses on overall dietary patterns and quality.
Common dietary pattern include the Mediterranean dietary pattern, 12 the Dietary Approaches to Stop Hypertension (DASH) dietary pattern, 13 and the Western dietary pattern. 14 A 26-year prospective cohort study in the Health Professional Follow-up Study (HPFS) found that adult men who followed the DASH diet had lower incidence of gout and uric acid levels compared with a Western diet. 15 Clinical studies in Israel have found significant reductions in serum uric acid in obese patients following a Mediterranean diet. 16 Europe, the United States, and China have issued dietary guidelines for hyperuricemia, giving dietary content and related dietary recommendations for different types of purines.17-19 However, single nutrients do not reflect overall dietary intake, For example, intake of vitamin C, 10 dairy products, 20 fruits, 21 and minerals 22 are all associated with contributing to healthy uric acid metabolism. In contrast to examining the impact of individual foods or nutrients, the dietary quality index provides a comprehensive evaluation of the overall dietary nutrition status and adherence to dietary guidelines. The Chinese Healthy Eating Index (CHEI) is a quantitative indicator of Chinese's compliance with dietary recommendations in the Chinese Dietary Guidelines based on the Chinese Dietary Guidelines 2016. 23 Compared with DASH or Mediterranean dietary pattern scores, the CHEI is more applicable to the Chinese population as it is scored according to the official Chinese dietary guidelines. 23
There are no relevant studies on the overall dietary quality and uric acid metabolism of Chinese adults, so we chose CHEI as a quantitative indicator of dietary patterns, which is a good representative of the popular dietary patterns recommended by dietary guidelines, focuses on the previous stage of gout, explores the relationship between dietary quality and hyperuricemia, and explores the association between dietary components and uric acid metabolism.
Materials and Methods
Study Sample
The China Health and Nutrition Survey (CHNS) is an ongoing, open-cohort, international collaborative project between the Carolina Population Center at the University of North Carolina at Chapel Hill and the National Institute of Nutrition and Health (NINH, formerly the National Institute of Nutrition and Food Safety) of the Chinese Centers for Disease Control and Prevention (CCDC).
24
The CHNS, which was initiated in 1989, is designed to be a multi-stage, randomized cluster sampling data collection methodology to collect data from individuals and households and their communities to understand the impact of broad social and economic changes in China in relation to nutrition and health-related outcomes. The sample began with 8 provinces, with Heilongjiang province added in 1997 and the municipalities of Beijing, Shanghai, and Chongqing added in 2011. For the CHNS data related quality control report can be found on the official website (https://www.cpc.unc.edu/projects/china/about/design/quality). The data for this part of the study were obtained from public databases and did not involve ethics-related issues. Since biochemical tests were only performed in the eighth round of the CHNS 2009, the data in this part of the study came from the eighth round of the China Health and Nutrition Survey (CHNS) 2009. A total of 6105 subjects were included, and the specific flow chart of the study design is shown in Figure 1. Only public data was used in the analysis, and ethical approval was not required for this study. Flowchart of the study population.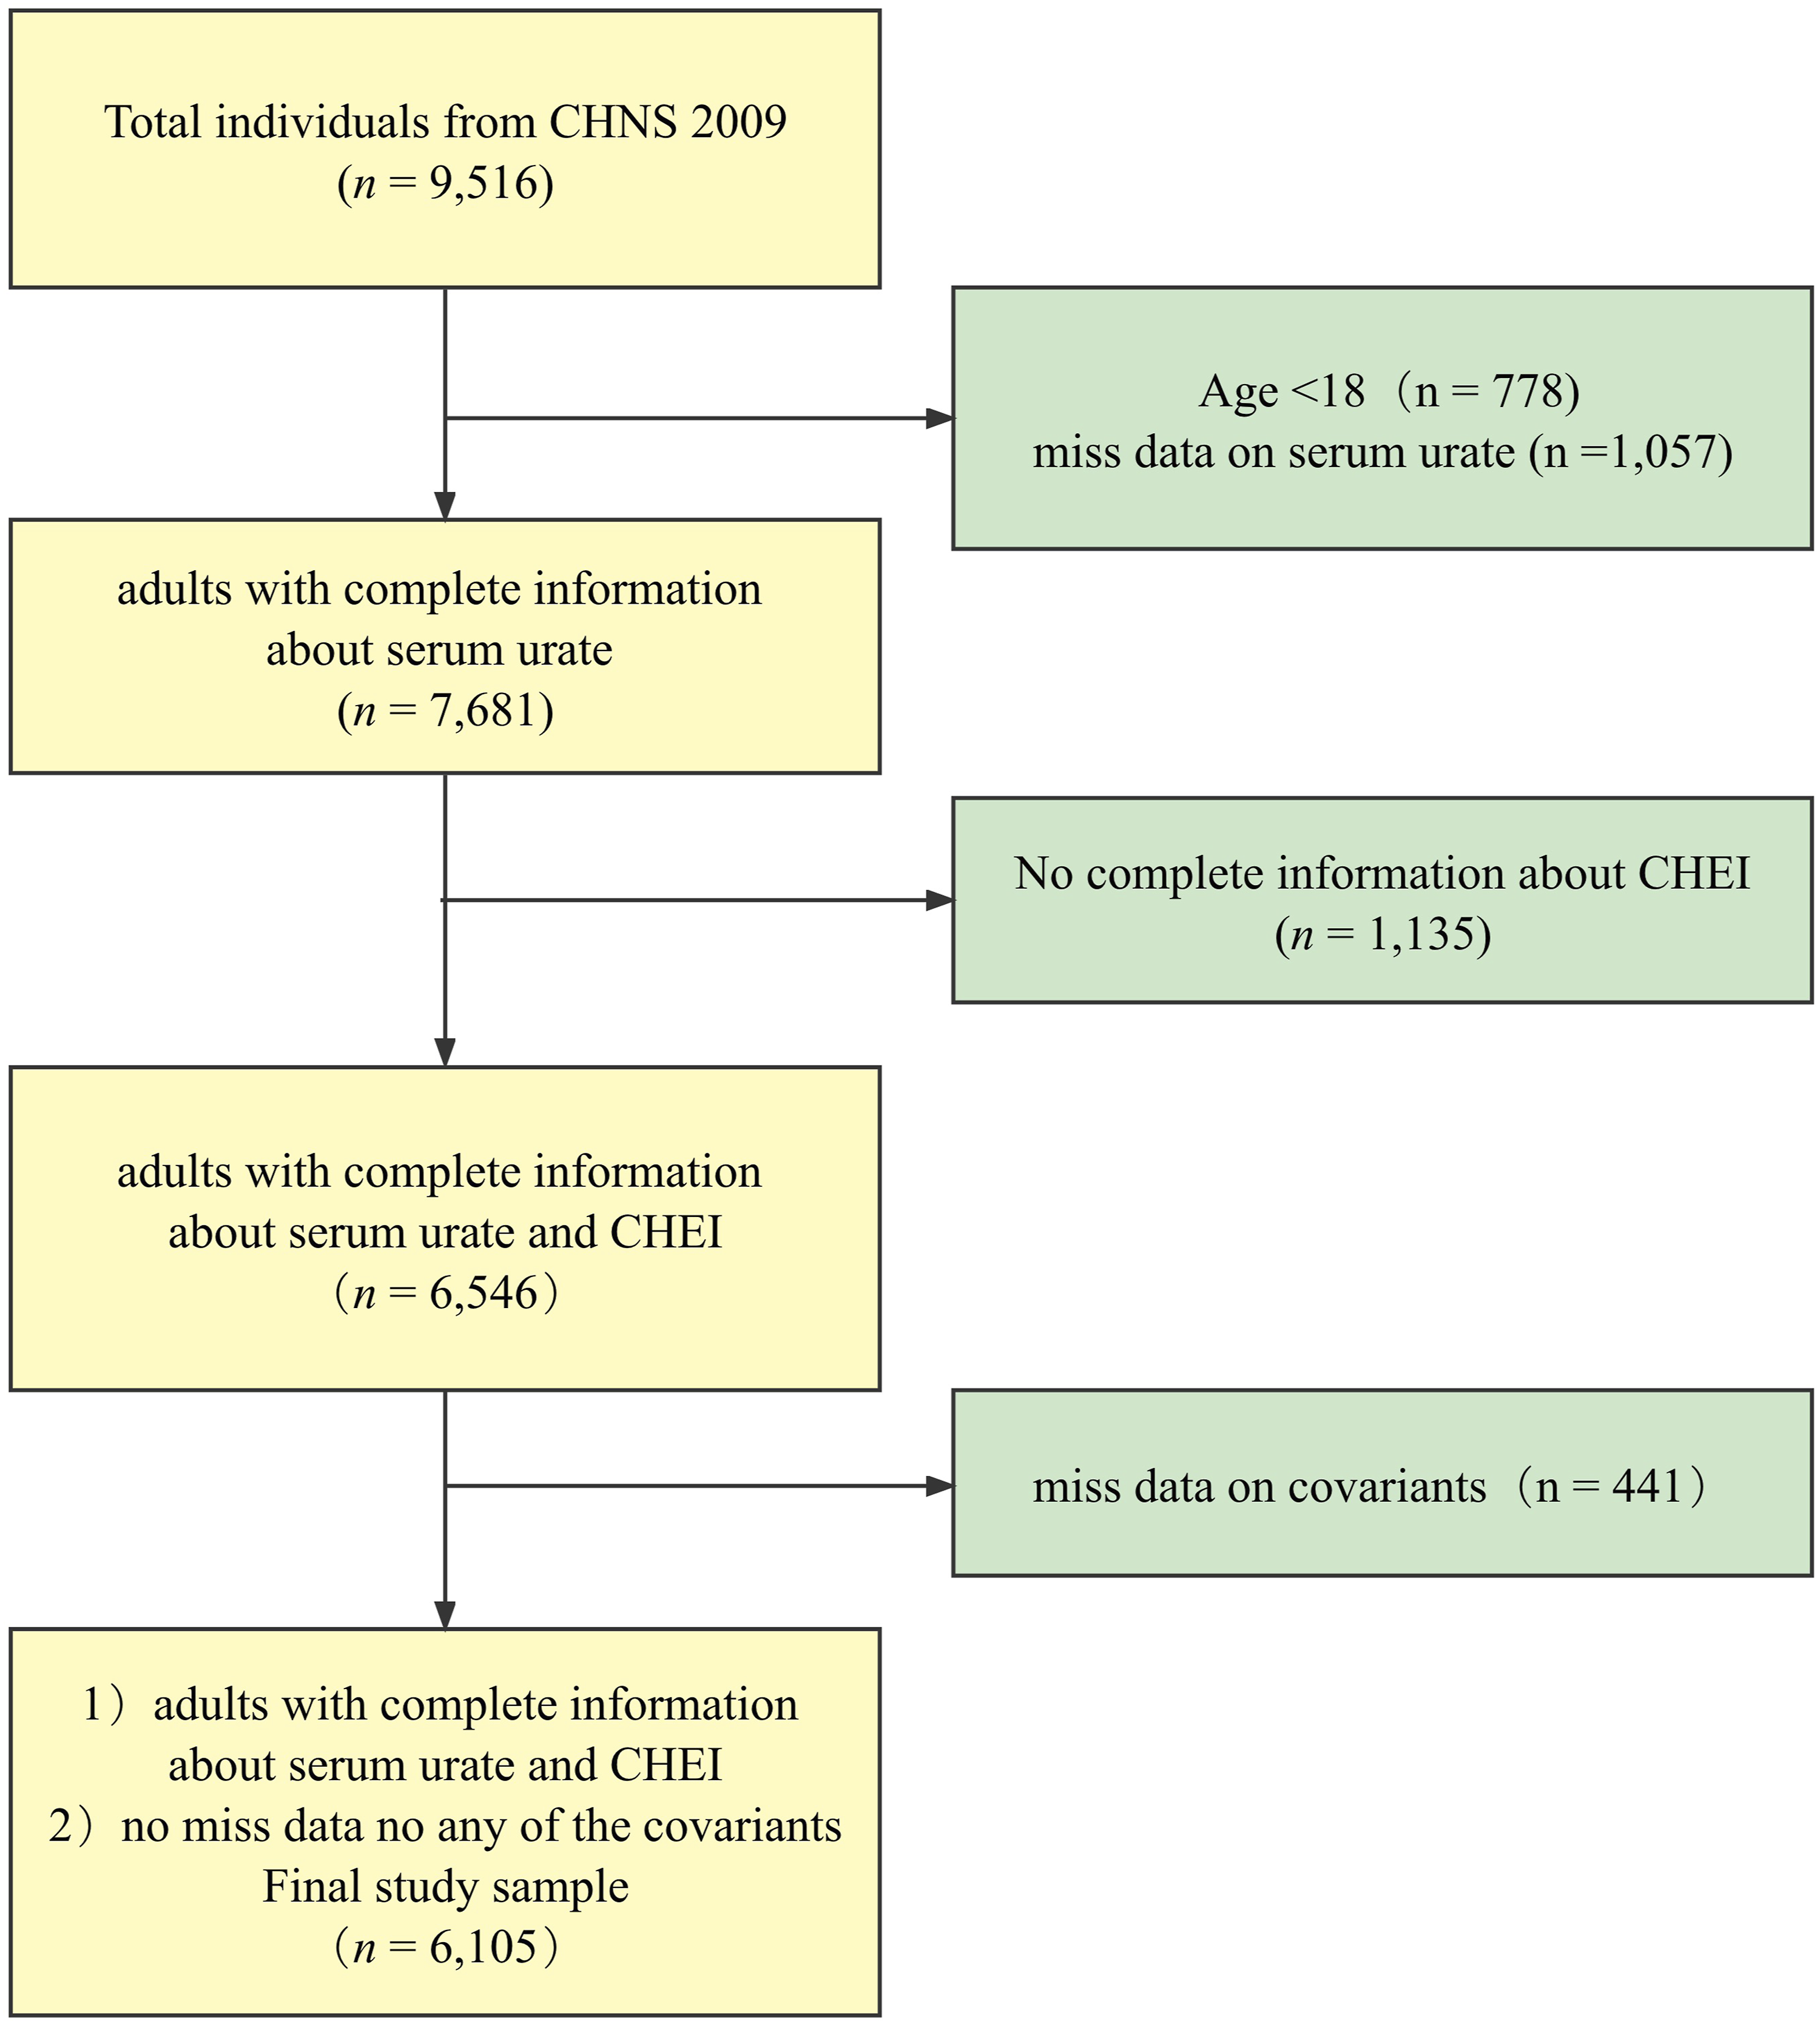
Measurements and Covariation Assessment
Diet Quality
In this study, CHNS used 24-hour recall data from 3 days (2 weekdays and one day off) for analysis. In addition, during the same three-day period, daily household food consumption data were collected and recorded using the weighing method, and household food inventory data were calculated. Oil and sodium intake from household food inventory data were used to supplement individual dietary data.
There are 17 food groups in the CHEI, 12 adequate intake groups (total grains, whole grains and mixed beans, potatoes, total vegetables, dark vegetables, fruits, dairy, legumes, fish and seafood, pork, eggs, and seeds and nuts) and 5 moderate intake groups (red meat, cooking oil, sodium, added sugars, and alcohol). 25 Each food was quantified as a Standard Portion (SP), and a SP-sized food in a food group should have a consistent energy content and similar carbohydrate, fat, and protein content. Using the Chinese Food Composition Database, the specific content of energy, carbohydrate, fat and protein in one SP size for each food group could be calculated. 23 The food portions were calculated as score weights based on the SP, with different components having corresponding weights of 5 or 10 points, and the 17 components together totaling a full score of 100. The higher the CHEI score, the higher the degree of adherence to the dietary guidelines by the individual, which represents the better quality of his or her diet. In the Scott-Rao chi-square test and stepwise logistic regression model analysis, the CHEI scores were categorized into 4 groups using a four-point scale, notated as Q1 (lowest dietary quality, the reference group), Q2, Q3, and Q4 (highest dietary quality), 26 and the lowest-scoring group in the quartile was used as the reference group, Q1.
Hyperuricemia
Subjects in the CHNS will undergo fasting blood sampling after 8-12 h of fasting, and blood samples will be collected using venipuncture collection method. The uric acid concentration in blood was determined by enzyme colorimetric assay (automated analyzer Hitachi 7600 with uric acid assay kit Randox, UK). According to the Chinese Guidelines for the Diagnosis and Treatment of Hyperuricemia and Gout (2019), Chinese patients with HUA were defined as having serum uric acid levels >420 μmol/L in men and >360 μmol/L in women. 18
Covariates
Sex
Sex was classified as female (reference group) and male.
Age
The age group was categorized into 18-39 years group (reference group), 40-59 years group, 60-79 years group, 80 years, and above group. 27
Race
Based on the subjects' self-reported ethnicity information, they were divided into Han group (reference group) and ethnic minorities group. 28
Residence
Based on the information of subjects' place of residence (urban and rural sites), subjects were divided into urban and rural groups (reference group) and urban group. 29
Education
Education level was divided into 3 groups: primary school (reference group), middle school, high school, and above. 30
Income
Based on the respondents' self-reported information on their total annual personal income, it was graded in thirds quartiles and categorized into low-income, middle-income, and high-income groups. The first tertile group, that is, the low-income group, was used as the reference group.
Marital Status
Based on the self-reported information on subjects' marital status, the group was categorized into unmarried, married (including cohabitation), and divorced (including divorce, widowhood, and separation). The unmarried group was defined as the reference group. 31
BMI Status
Body mass index was categorized into normal and underweight group (<24 kg/m2), overweight (≥24 kg/m2 to 28 kg/m2), obese (≥28 kg/m2). 30
Smoking Status
Smoking status was categorized according to the subjects' responses to the relevant smoking questionnaire, and the subjects were classified into 3 groups: never smoking, Former smoking, and current smoking by “whether they had ever smoked cigarettes” and “whether they still smoked cigarettes.” The never smoking group was defined as the reference group. 32
Drinking Status
Subjects were categorized into non-drinking group (reference group) and drinking group by using the alcohol consumption questionnaire, “Have you consumed alcohol in a year.” 32
Hypertension
Subjects were categorized into 2 groups, one with hypertension and the other with diastolic blood pressure (DBP) ≥ 90 mmHg, based on self-reported hypertension or systolic blood pressure (SBP) ≥ 140 mmHg. subjects into non-hypertensive (reference group) and hypertensive groups. 33
Diabetes
Subjects were categorized into diabetes and non-diabetes groups based on their self-reported diabetes mellitus status. Thenon-diabetes group was defined as the reference group in the subsequent modeling analysis. 34
Chronic Kidney Disease
Subjects were categorized into CKD and non-CKD groups based on their self-reported “chronic kidney disease.” The non-chronic kidney disease group was defined as the reference group in the subsequent analysis of the relevant model. 35
Statistical Analysis
Continuous variables in descriptive analyses were expressed using the form of standard deviation (SD) of the mean, and categorical variables were expressed using the form of headcount (percentage %). The chi-square test was used to test baseline characteristics of the different groups. Restricted cubic spline curves (RCS) were used to test the dose-response relationship for diet quality in HUA among adults. Stepwise binary logistic regression models were used to assess the association between dietary quality and HUA among adults.
Weighted quantile sum (WQS) regression models were first used in environmental health studies to assess the confounding effect of different exposures to environmentally hazardous substances in the same environment on the same health outcome, that is, to assess the confounding effect of the same type of exposure factor on the dependent outcome and the magnitude of each exposure's contribution to the confounding effect. 36 As research continues, such models have been used in different fields, included the nutrition field.
The effects and contributions of dietary components among the 17 dietary components of CHEI were used in this section to assess the effects of mixed exposure to HUA risk. The WQS regression model calculates a weighted regression index, which reflects the contribution of the 17 dietary components of CHEI to overall dietary health. The corresponding weights of each dietary component in the WQS model show the extent to which a particular dietary component contributes to the WQS index. The data were randomly divided into 2 datasets (40% as training set and 60% as validation set). For all model measurements, we calculated 95% confidence intervals (CIs). Receiver operating characteristic curves (ROCs) were used to verify the fit of the WQS model.
All statistical tests were performed using a two-sided test with a statistical significance level = .05, that is, a two-sided statistical test showing P < .05 can be considered as a statistically significant result. The WQS model and ROC test were done using the software R (version 4.1.0) and SPSS (Version 23.0). The RQS model and ROC test were done using the R package “gWQS” (version 3.0.4). The RCS test was done using the R package “rms” (version 6.3-0).
Results
Population Characteristics Between Groups
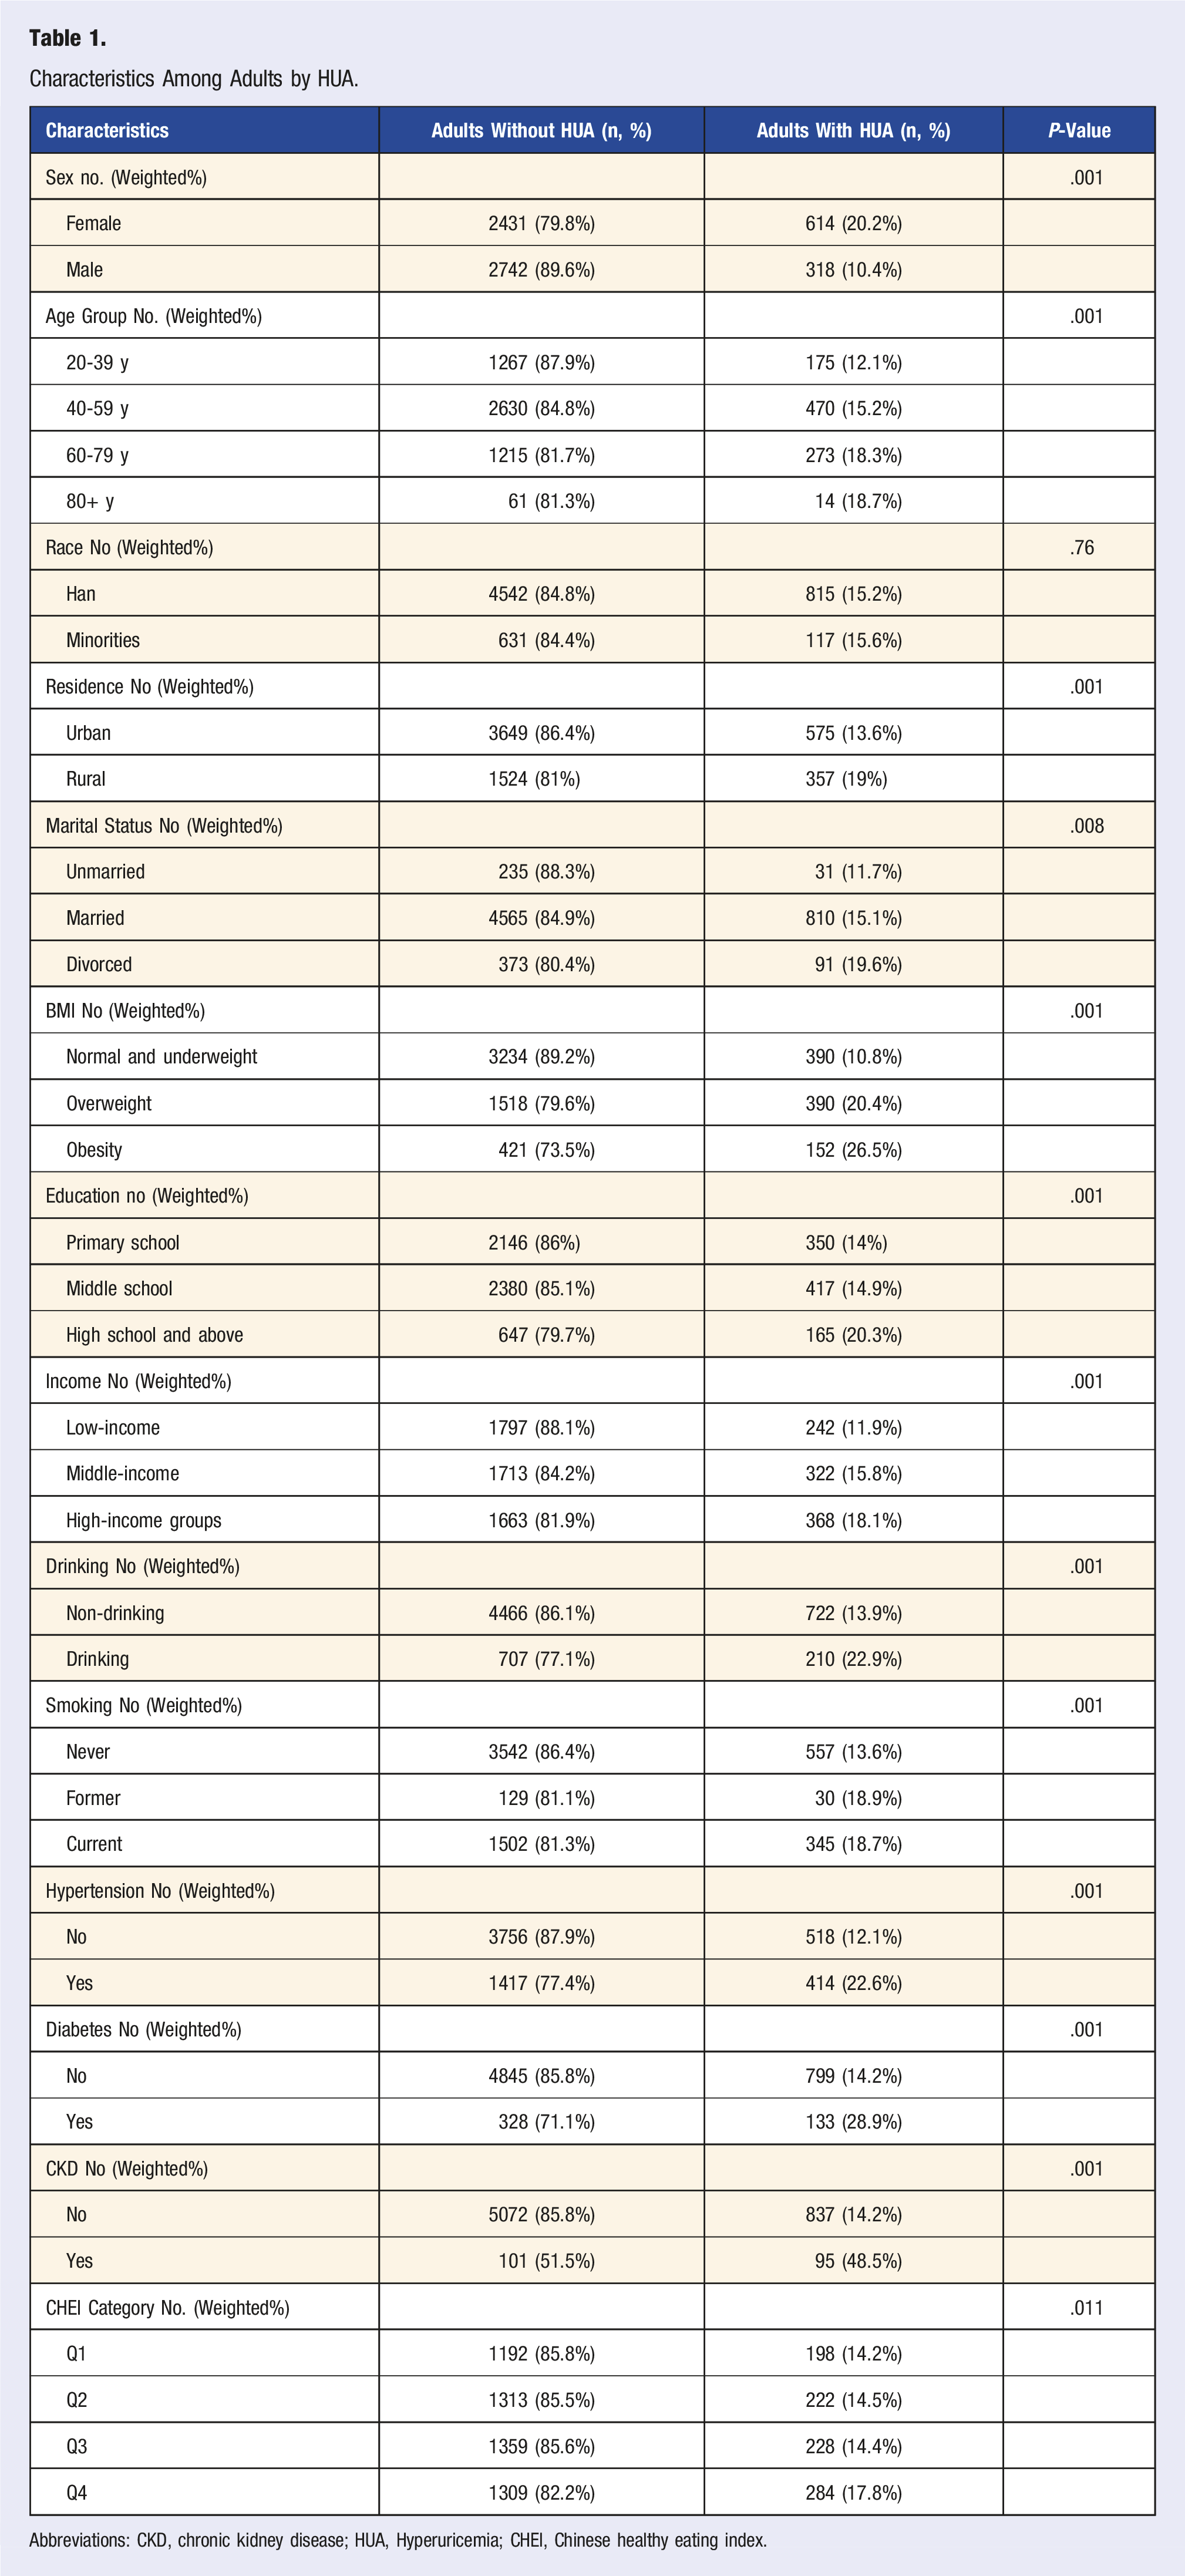
Characteristics Among Adults by HUA.
Abbreviations: CKD, chronic kidney disease; HUA, Hyperuricemia; CHEI, Chinese healthy eating index.
The chi-square analysis showed that Chinese adults with HUA were more likely to be male, over 60 years of age, of high socioeconomic status, obese, smokers, alcohol drinkers, with chronic kidney disease, hypertension, diabetes, and with lower CHEI scores. (Table 1)
A Trend Exists for Higher CHEI Scores and Lower HUA Risk
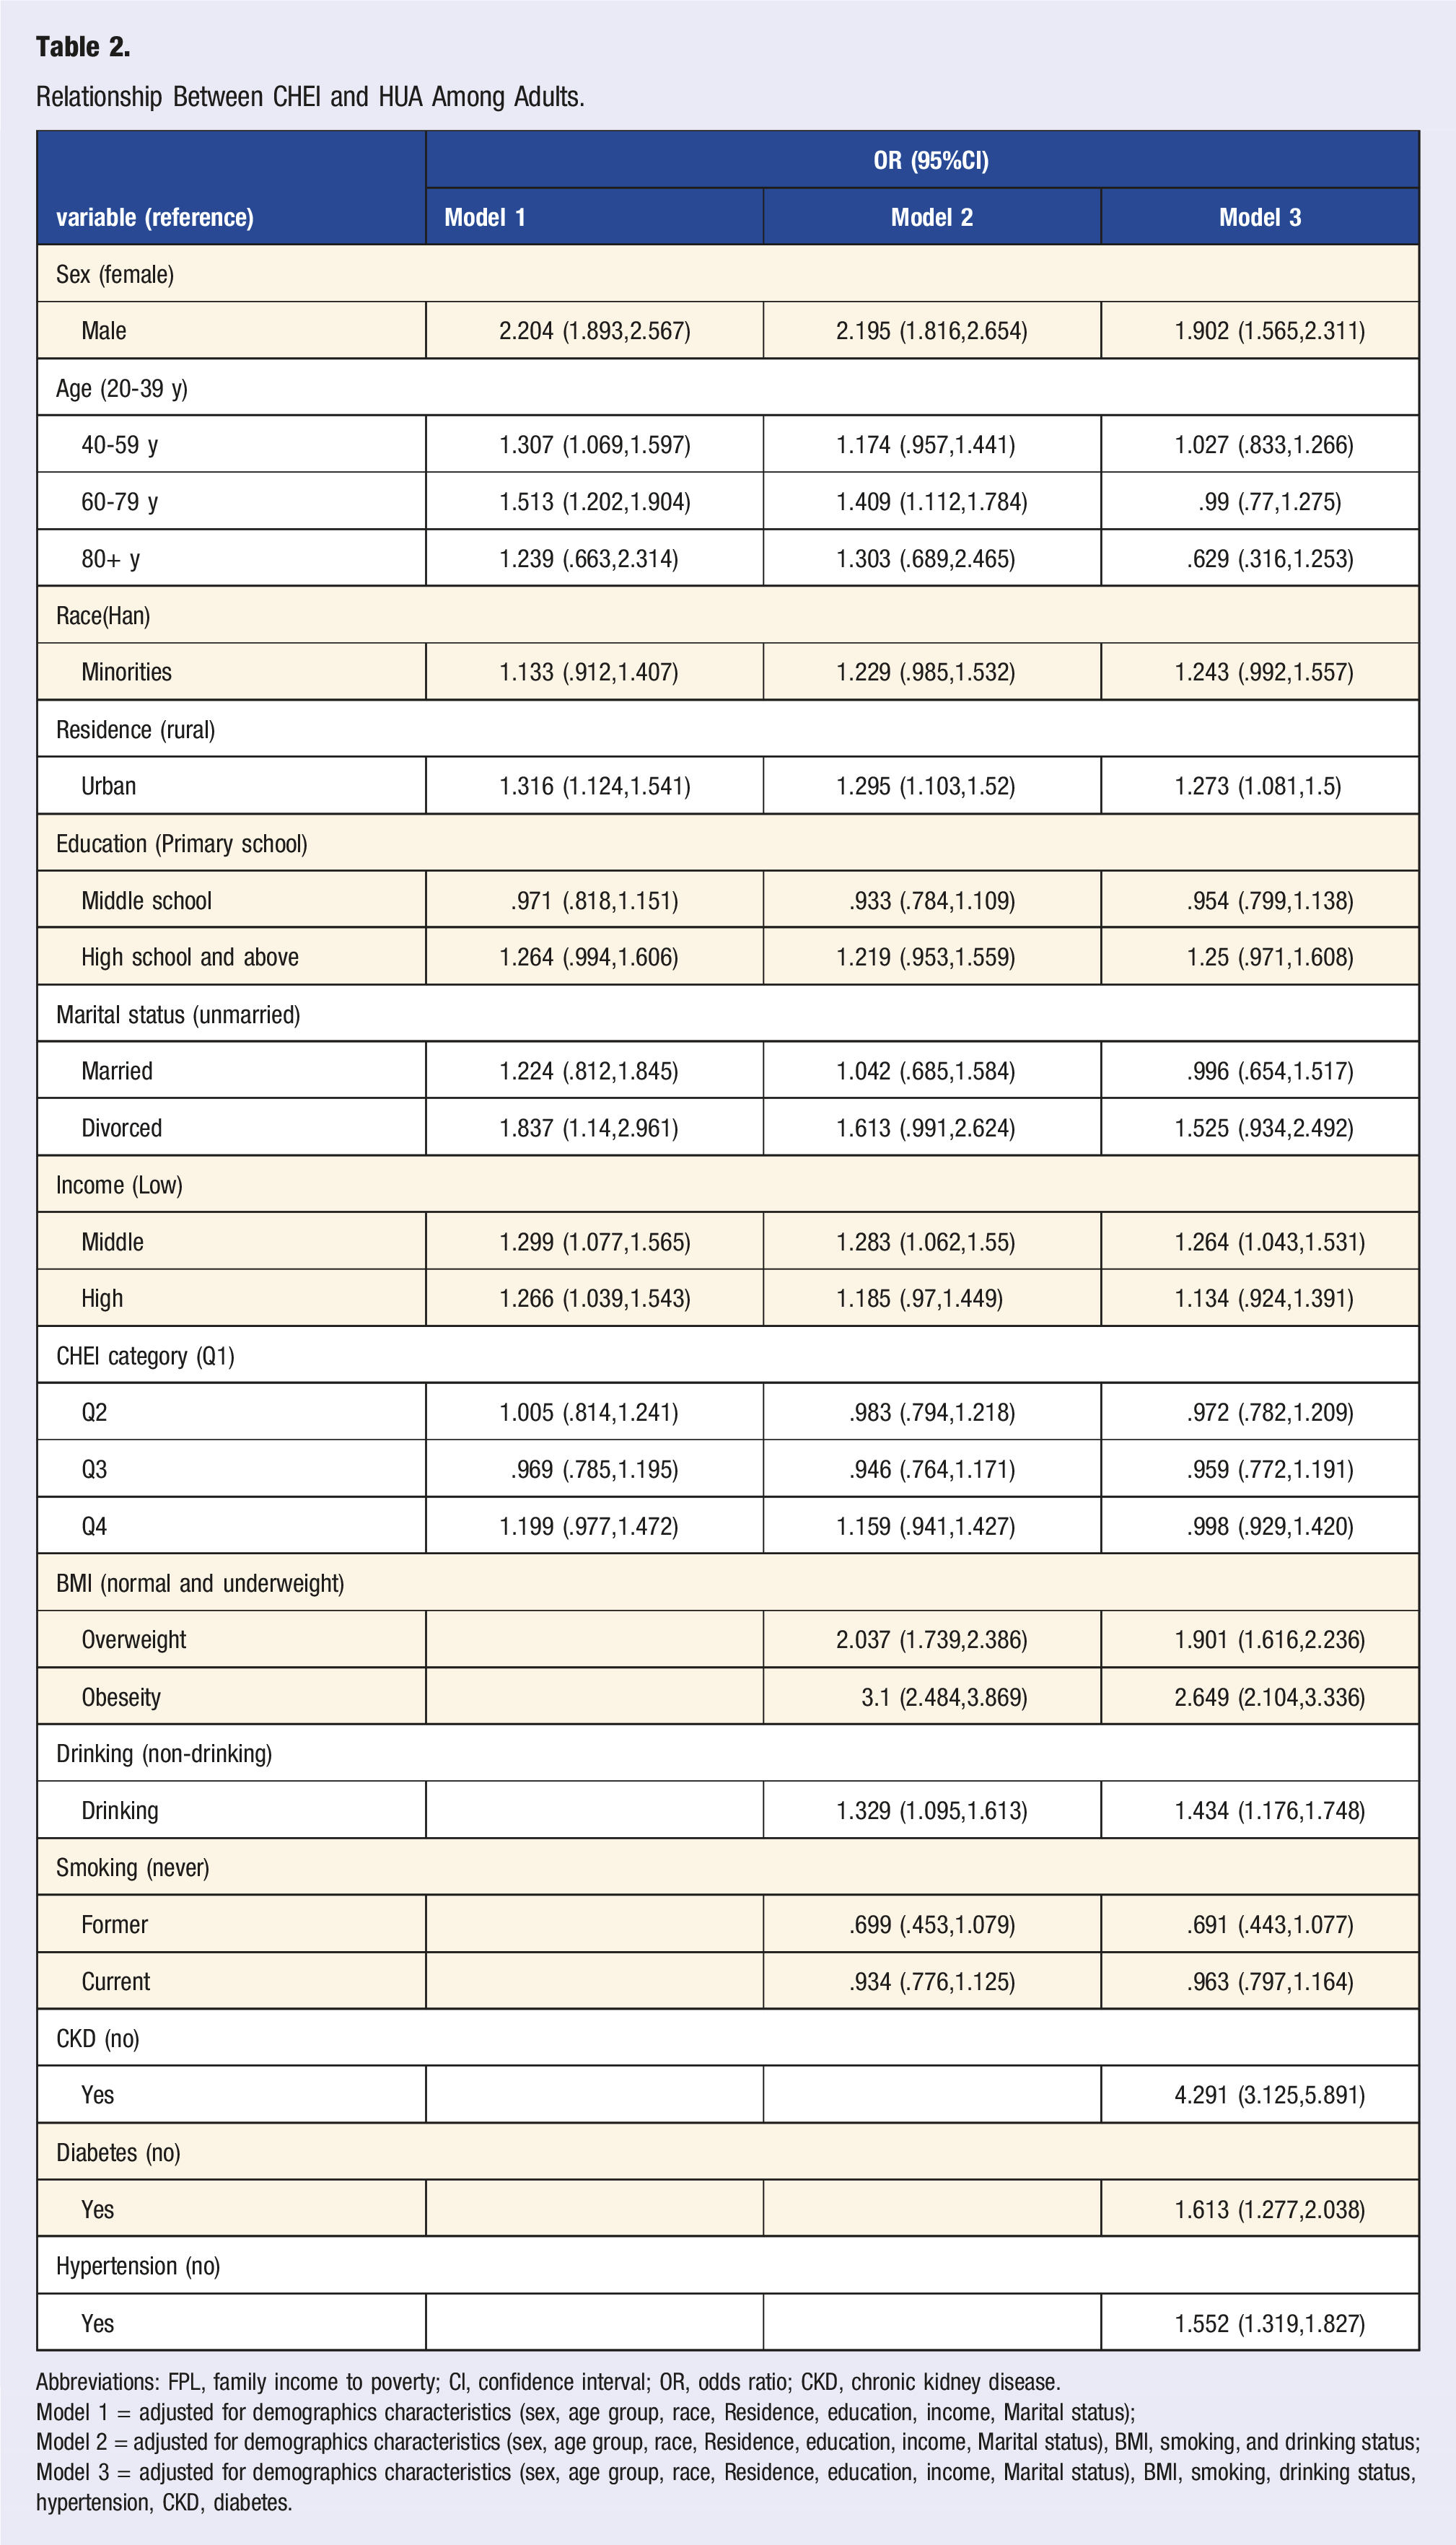
Relationship Between CHEI and HUA Among Adults.
Abbreviations: FPL, family income to poverty; CI, confidence interval; OR, odds ratio; CKD, chronic kidney disease.
Model 1 = adjusted for demographics characteristics (sex, age group, race, Residence, education, income, Marital status);
Model 2 = adjusted for demographics characteristics (sex, age group, race, Residence, education, income, Marital status), BMI, smoking, and drinking status;
Model 3 = adjusted for demographics characteristics (sex, age group, race, Residence, education, income, Marital status), BMI, smoking, drinking status, hypertension, CKD, diabetes.
The dose-response relationship between dietary quality and the risk of developing HUA was analyzed and tested using the restricted cubic spline RCS. The results of the RCS showed that CHEI scores did not show a protective effect against HUA statistically in the model. (Figure 2) Dose-response association between CHEI (in continues) and HUA using restricted cubic splines (RCS). The models of HUA were adjusted for demographics characteristics (sex, age group, race, Residence, education, income, Marital status), BMI, smoking, drinking status, hypertension, CKD, diabetes.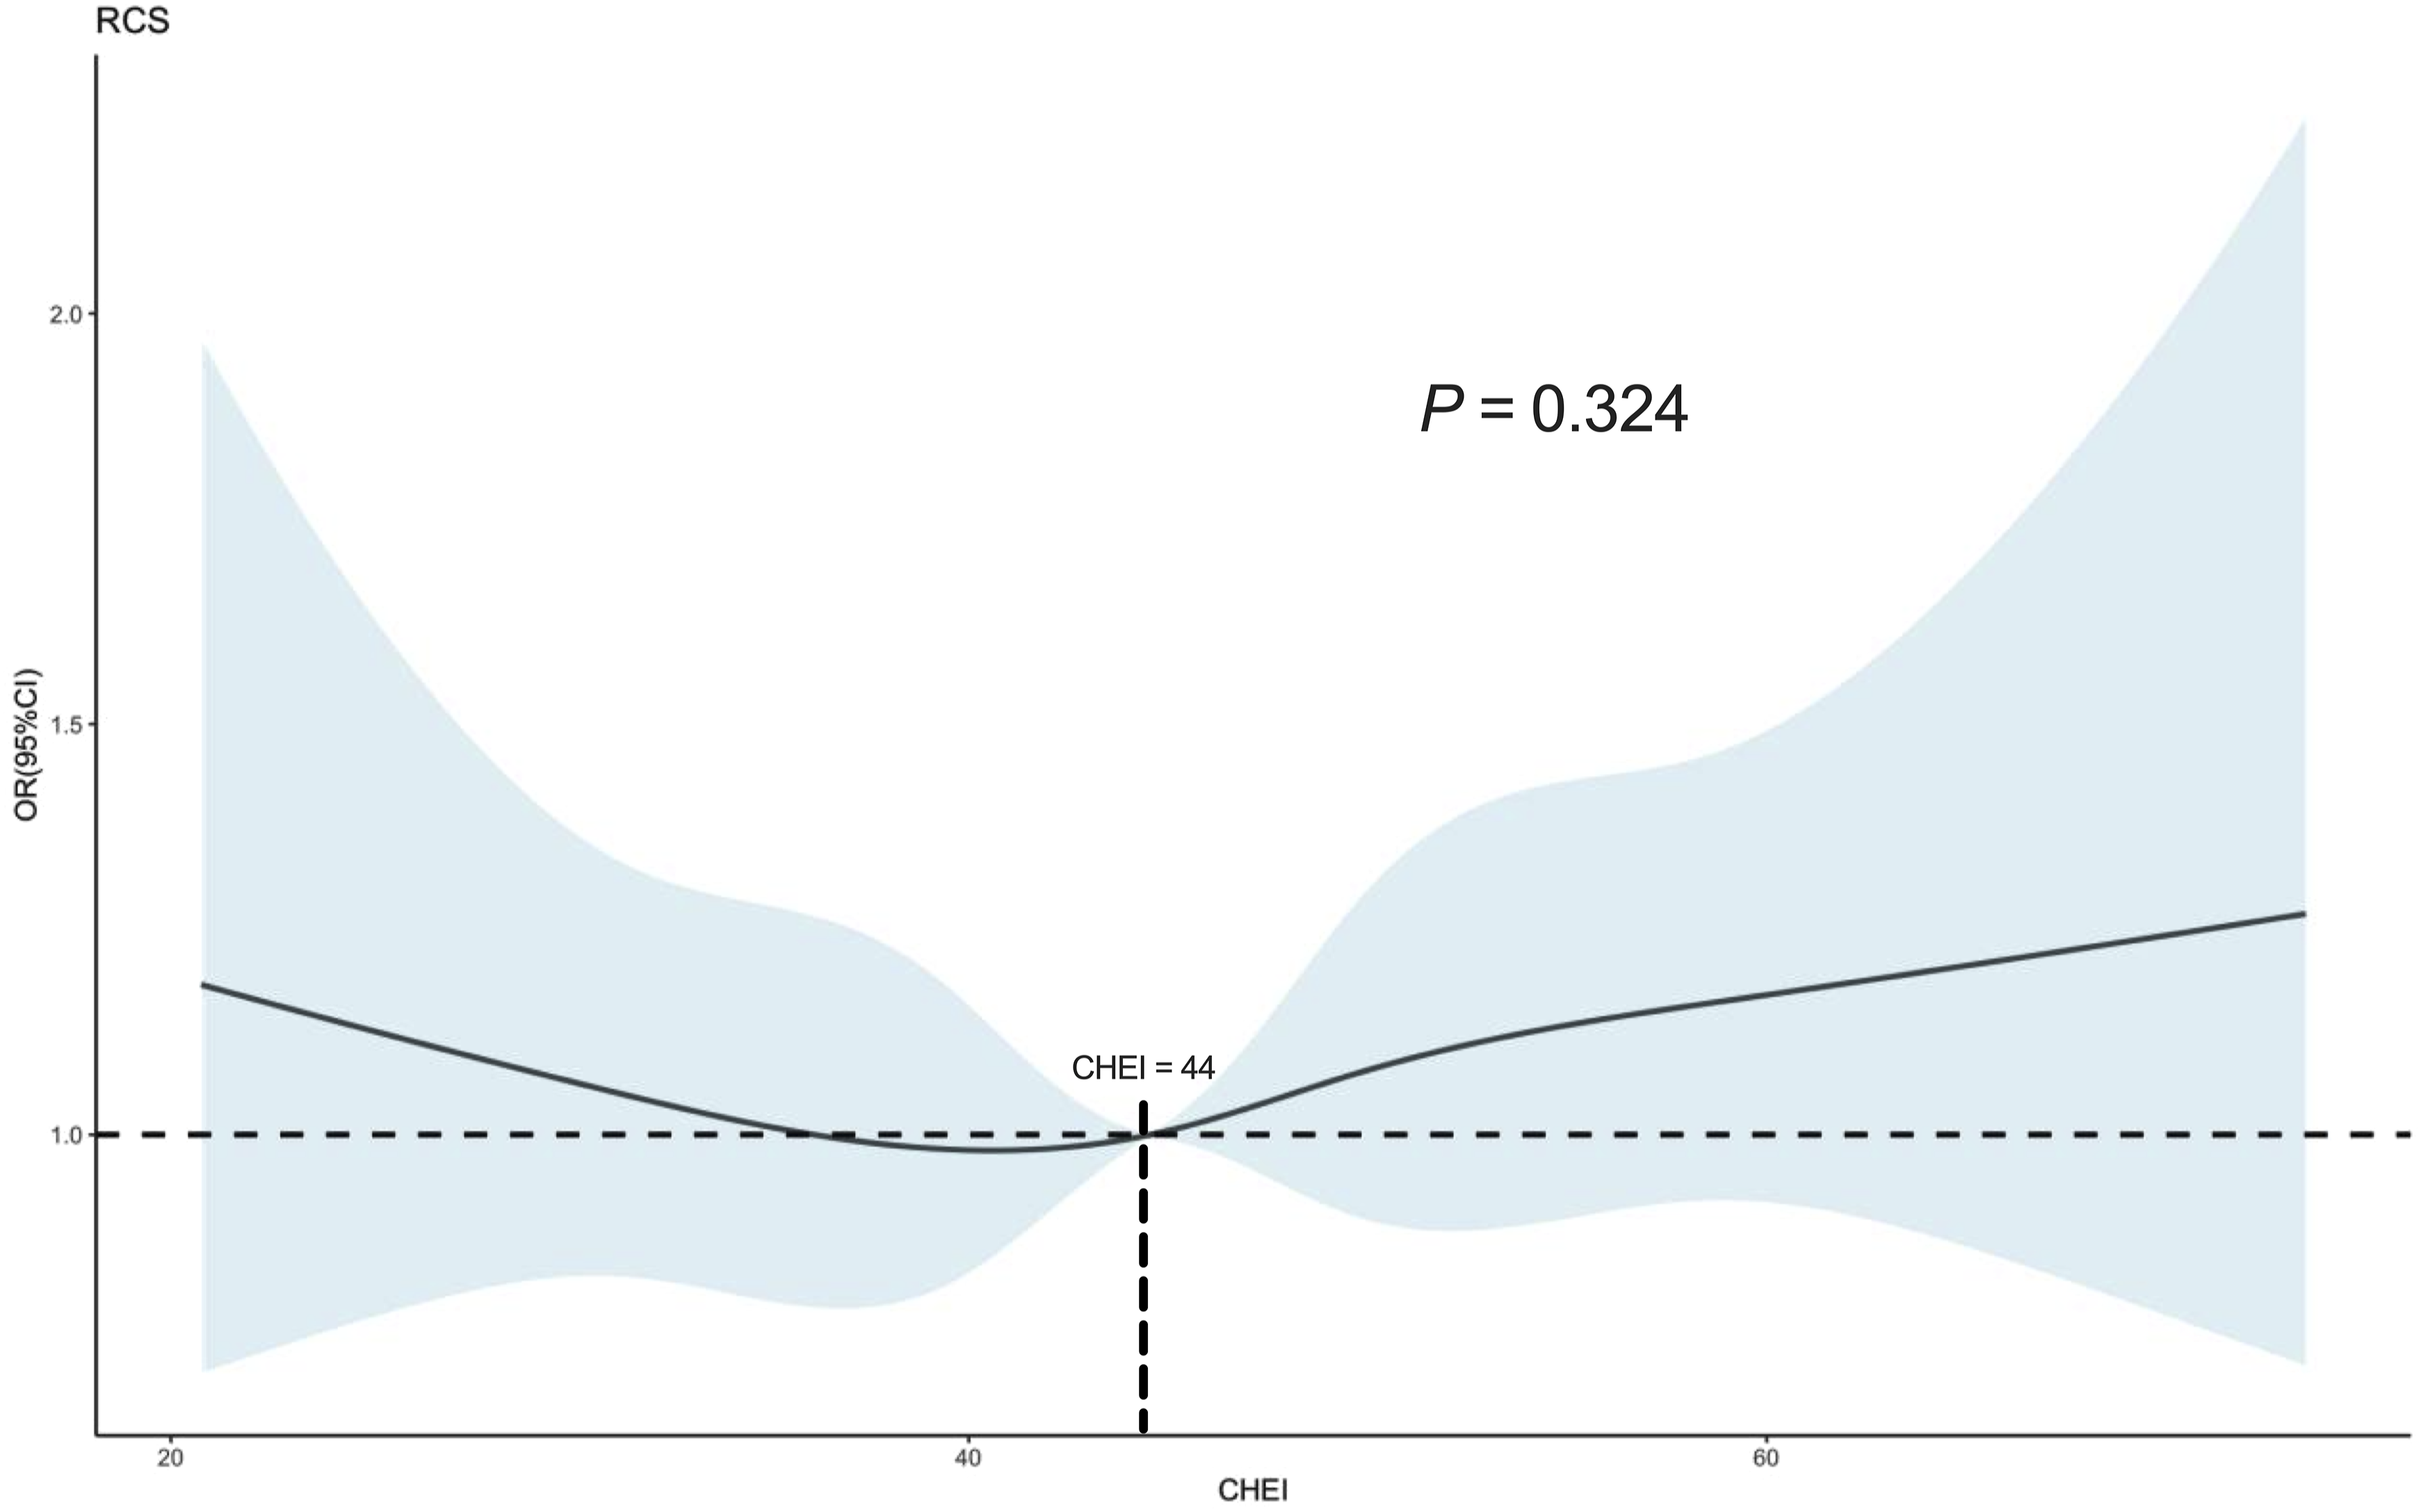
Mixed Effects of 17 Dietary Components of CHEI on HUA
In the stepwise logistic model, the relationship between CHEI score and the risk of developing HUA was not statistically significant, but showed a trend towards a protective effect. So in order to further understand and validate the relationship between CHEI dietary score and HUA, and possibly to obtain the contribution of the role of CHEI dietary components in the model of HUA, we analyzed the relationship of dietary components in HUA using the Weighted Quantile Sum (WQS) regression model CHEI.
The Association Between Mixed Effects of CHEI Component Scores and Hyperuricemia in Chinese Adults.
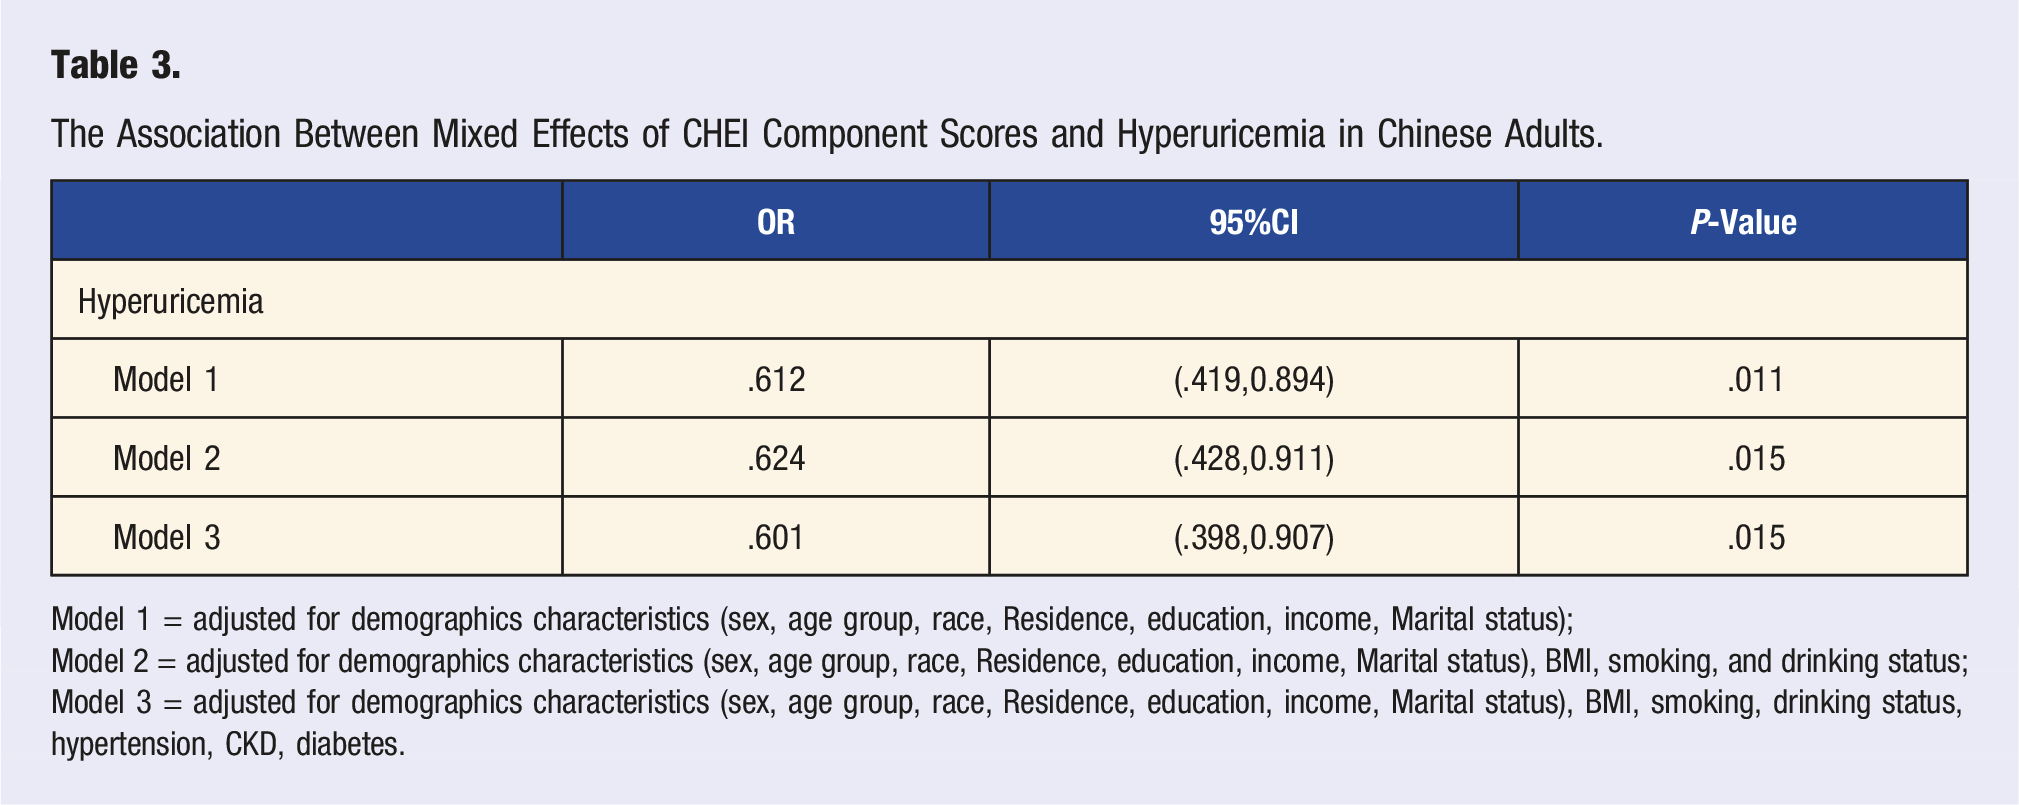
Model 1 = adjusted for demographics characteristics (sex, age group, race, Residence, education, income, Marital status);
Model 2 = adjusted for demographics characteristics (sex, age group, race, Residence, education, income, Marital status), BMI, smoking, and drinking status;
Model 3 = adjusted for demographics characteristics (sex, age group, race, Residence, education, income, Marital status), BMI, smoking, drinking status, hypertension, CKD, diabetes.
The percentage of health contribution of the 17 components of CHEI in the prevention of HUA was calculated, and it was found that among the 17 components of CHEI, the 3 food groups of fruits, roots and tubers, and dairy products had the highest contribution in the whole, which were 26.81%, 14.34%, and 12.95%, respectively (Figure 3A). The reliability of the model was tested using ROC and found to be a good fit with AUCs of .716 for the area under the ROC curve, indicating good model reliability (Figure 3B). WQS model regression index weights for HUA(A) and the AUCs of the WQS models (B). Models were adjusted for demographics characteristics (sex, age group, race, Residence, education, income, Marital status), BMI, smoking, drinking status, hypertension, CKD, diabetes.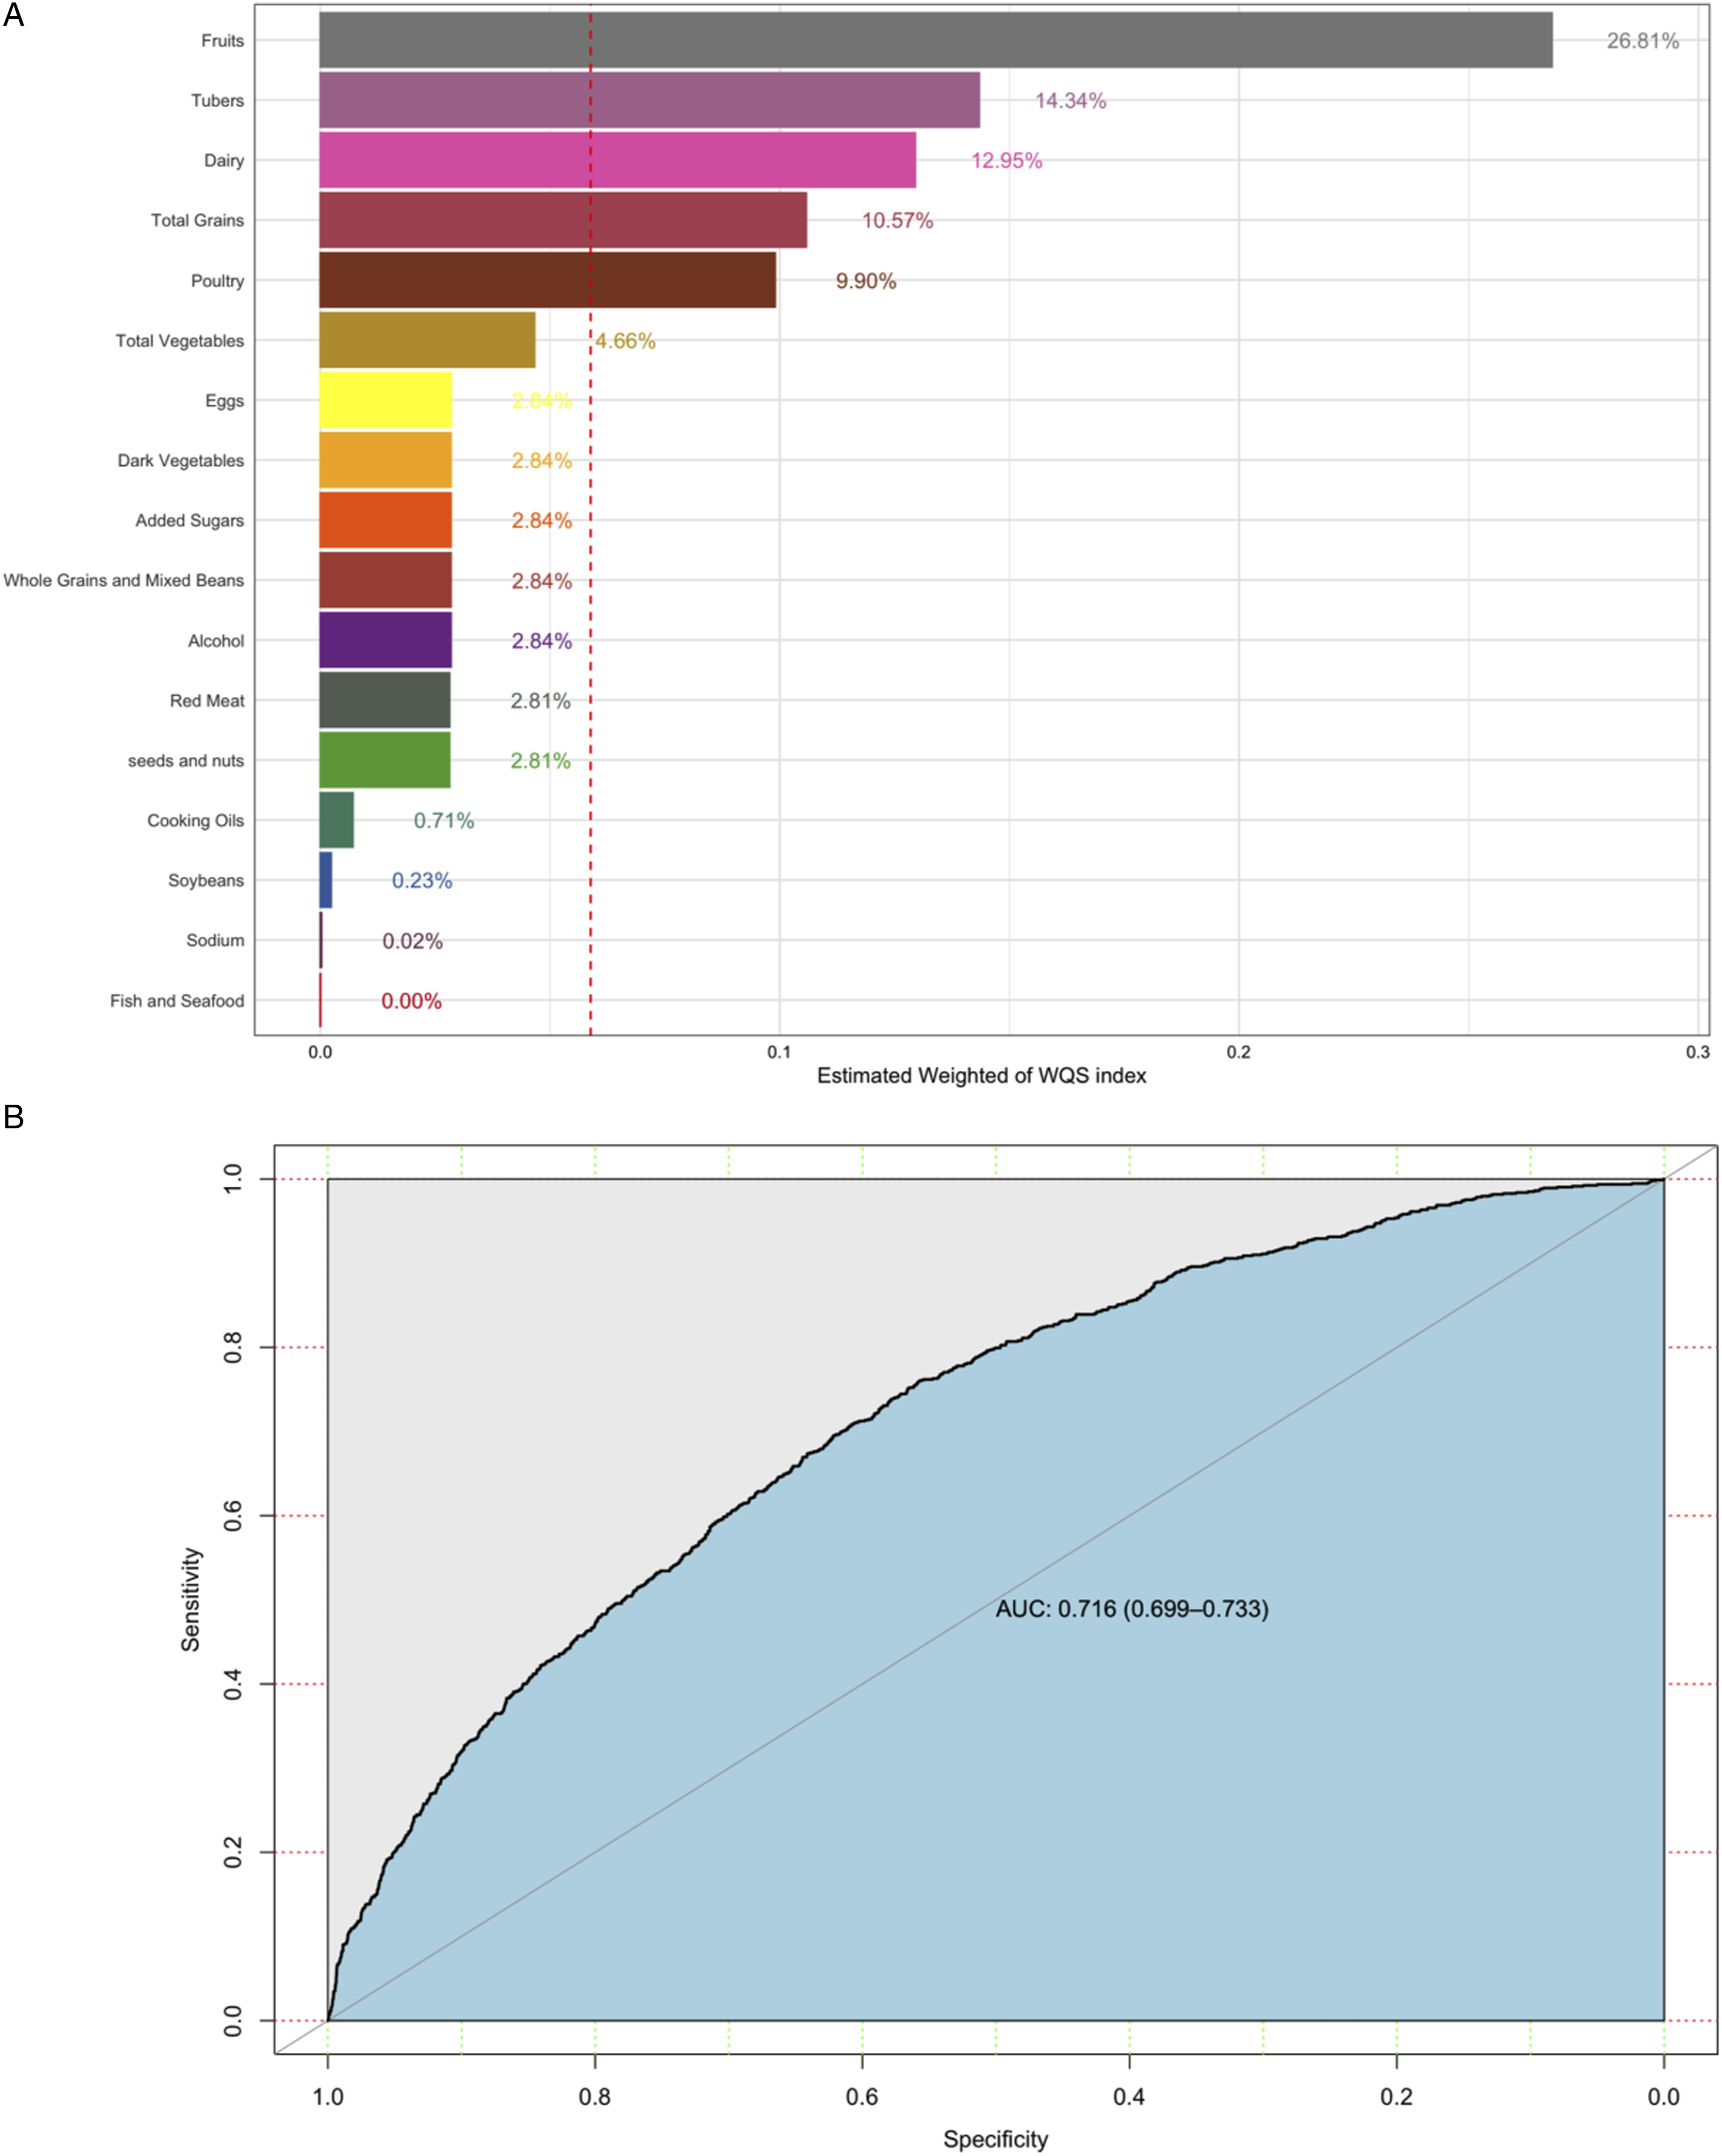
Discussion
We found that higher dietary quality was associated with the risk of hyperuricemia in the Chinese adult population, and stepwise logistic regression modeling showed that there was a trend toward a possible protective effect of CHEI scores against HUA, but it was not statistically significant overall (Q4, OR: .998, 95% CI: .929-1.42). Further in the WQS model, a protective effect of CHEI on the risk of developing HUA was found for a mixture of 17 dietary components, suggesting that there is an association between higher dietary quality scores and a low risk of developing HUA (OR: .601, 95% CI, .298-.907, P = .015), that is consistent with the concept of the Chinese dietary dietary guideline represented by the CHEI. Three food groups, Fruits, Tubers, and Dairy products, contributed the highest overall, 26.81%, 14.34%, and 12.95%, respectively.
There was no stable statistically significant relationship between dietary quality and the risk of HUA in the Chinese adult population, but the trend of the relationship between dietary quality and the risk of HUA was consistent across models. The possible reason for this is that the CHNS conducts whole cluster random sampling of 15 Chinese provinces (autonomous regions and municipalities directly under the central government), most of which belong to the southern provinces of China, which would make the overall dietary structure more inclined to the dietary habits and structure of the southern provinces. A study of dietary differences between provinces in the CHNS also found that the proportion of livestock, poultry, and aquatic products consumed was higher in the southern provinces, and that livestock, poultry, and aquatic products are high purine source foods. 37
In a randomized controlled trial investigating the effects of the Mediterranean diet, it was observed that HUA patients who adhered to the Mediterranean diet experienced a significant decrease of 119 μmol/L in serum uric acid concentration over a 6-month period (P < .001 for within-group comparison). 16 MD Kontogianni et al. assessed the quality of the Mediterranean diet using a scoring system and discovered a 70% decrease in the risk of hyperuricemia (HUA) among individuals in the highest group (Q4) of the Mediterranean diet score compared to those in the lowest group (Q1) (OR: .30, 95% CI: .11-.82). 38 In the Kailuan study, a high DASH diet score was found to be associated with a low risk of developing HUA (Q4 vs Q1, OR: .70, 95% CI: .66-.75). 39 In contrast to the calculation methods employed for the DASH dietary score and the Mediterranean dietary score, as well as the use of dietary frequency for dietary score calculation, the Chinese Healthy Dietary Index (CHEI) incorporates energy intake and introduces the concept of standardized portion energy for food assessment. This approach not only enables comparability of different foods within the same food group through the standardized portion score method but also ensures that different food groups can be combined additively using the standardized portion method. Unlike the 11 components of the Mediterranean diet and the 8 components of the DASH diet, the CHEI contains a wider range of 17 dietary components and more truly reflects the dietary status of the Chinese population. 25
The WQS model found that fruits, roots, and dairy products contributed the most to the overall health effect. In a study by Kanbara A and Hakoda M et al, it was found that fruit consumption leads to alkalinization of urine, which promotes uric acid excretion. 27 Research investigating the impact of fruit consumption on uric acid metabolism has revealed that fructose, present in fruits, stimulates uric acid production and elevates blood uric acid levels. However, it should be noted that not all fruits contribute to uric acid metabolism. Natural fruits may potentially offer protective effects against uric acid accumulation and gout; however, the impact of fruit juices remains uncertain. 40 At the same time, studies have also pointed out that a variety of nutrients in some fruits have the effect of lowering serum uric acid, such as vitamin C can induce uric acid excretion in the kidneys 41 ; dietary fiber in fruits can slow down the rate of fructose reabsorption in the small intestine and reduce the production of uric acid in the liver 42 ; potassium in fruits can lower blood pressure and offset the effect of uric acid and fructose in elevating blood pressure 43 ; catechins and flavonoids exhibit a protective effect by lowering xanthine and gout. 44 Protective effects by decreasing xanthine oxidase activity, thereby blocking uric acid formation and inhibiting superoxide production.
There have been limited studies on the relationship between root and tuber food consumption and uric acid metabolism, with most of the research focusing on vegetarian diets or diets rich in plant-based foods and their impact on kidney health. However, a cross-sectional study conducted in China revealed that a higher intake of plant-derived foods, including grains, tubers, legumes, fruits, and vegetables, was associated with improved kidney function. This was evident through lower levels of 3 commonly used metabolic markers: uric acid, urea, and creatinine. 45 Roots and tubers are often used in medical-related studies because of their medicinal value and health effects. 46 Roots and tubers contain water-soluble non-starch polysaccharides, which have been found to have a variety of effects such as anti-inflammatory, antioxidant, and glycemic control in related studies, giving roots and tubers potential in the prevention and management of metabolic disorders such as diabetes, obesity, and cancer, as well as in the improvement of intestinal health and immunity. 47
High quality proteins (casein and whey proteins) in dairy products have been shown to reduce serum uric acid levels in healthy individuals. 48 Dairy products are also low in purines and contribute little to the purine load associated with other high quality protein sources (meat and seafood). 49 In in vivo/in vitro experiments, the proteins and lipids in dairy products have also been found to inhibit the inflammatory response associated with sodium urate monohydrate (MSU) crystals. 50 Related studies have shown that the intake of dairy products has a urate-lowering effect. In a nutritional testing survey of 460 healthy elderly Dutch subjects, 51 dairy product intake was found to be negatively associated with serum urate concentrations in women. Dairy intake was also shown to be negatively associated with serum urate concentrations in the US National Health and Nutrition Examination Survey (NHANES III) study. 52 Whey acid, which is enriched in dairy products, is a well-recognized uric acid-excreting compound that competes with urate in the human urate transporter protein 1 (hURAT1) pathway, which reduces renal tubular reabsorption of uric acid. 53
This article has certain advantages, most notably the use of a large-scale dietary and health survey database, CHNS, which is representative of the nutritional intake and health situation of Chinese residents; secondly, the WQS weighting analysis for repeated validation ensures the authenticity and reliability of the findings, and further analyzes the possible mechanisms by which diet affects uric acid metabolism. Meanwhile, as a cross-sectional study, the inability to explore causality is the biggest limitation of this article, and the calculation and definition of relevant variables were derived from self-reported information, which also suffers from a certain recall bias. The lack of adjustment for the subject's medical record medication history in the definition of disease variables is also a limitation of this study.
In China, people who are at risk of HUA or who suffer from HUA can reduce their risk of high uric acid by improving the quality of their diet as recommended in the Chinese Dietary Guidelines. And more attention should be devoted to tubers, fruits and dairy products.
Conclusion
We found that people with the highest CHEI score had a reduced risk of hyperuricemia compared to people with the lowest CHEI score. Fruits, Tubers, and Dairy contributed the most to the health effects of the daily diet represented by CHEI. Therefore, people at high risk of hyperuricemia or hyperuricemia sufferers should pay more attention to maintaining a healthy diet and follow the Dietary Guidelines for Chinese Residents, especially increasing the intake of fruits, tubers, and dairy products.
Footnotes
Author Contributions
All authors listed have made a substantial, direct, and intellectual contribution to the work and approved it for publication.
Declaration of Conflicting Interests
The author(s) declared no potential conflicts of interest with respect to the research, authorship, and/or publication of this article.
Funding
The author(s) received no financial support for the research, authorship, and/or publication of this article.