
Abstract
“Adopting a healthy lifestyle could substantially reduce premature mortality and prolong life expectancy in US adults.”
Introduction
Non-communicable diseases are among the World Health Organization’s top ten causes of death in low-, middle-, and high-income countries.1,2 Research linking lifestyle risk factors to an increased risk of non-communicable disease is now well established, with numerous examples of confirmed risk factors, including poor diet, tobacco usage, insufficient physical activity, and sedentary behavior.2,3 To systematically analyze and tackle those risk factors in the general population, a new medical discipline called “lifestyle medicine” has emerged. 4
The American College of Lifestyle Medicine (ACLM) defines this rapidly growing discipline as a specialty using “therapeutic lifestyle interventions as a primary modality to treat chronic conditions including
The so-called 6 pillars of lifestyle medicine—shown in Figure 1—are currently the most essential tools of the trade for physicians and other healthcare practitioners in the field of lifestyle medicine. The 6 pillars of lifestyle medicine defined by the American College of Lifestyle Medicine/Whole-food minimally-processed plant-based nutrition rich in fiber, antioxidants, and nutrient dense foods (top left); regular and consistent physical activity including purposeful exercise as part of overall healthy and resilient lifestyle (top right); stress management techniques to recognize negative stress responses and to improved mental well-being (middle left); avoidance of tobacco and excessive alcohol consumption and other risky substances (middle right); restorative sleep for 7 or more hours per night to combat low attention span, decreased sociability, depressed mood, decreased deep sleep, and decreased caloric burn during the day (bottom left); building and maintaining positive social connections and relationships that can help reinforce healthy behaviors (bottom right).
These tools include nutritional and physical activity recommendations as well as other strategies reinforcing health behaviors.5,6 All of these approaches have been shown to exert beneficial effects with regard to cardiovascular disease, which is the leading cause of death globally.7-13
There is now a wide array of educational tools for healthcare professionals and the general public to incorporate lifestyle medicine concepts in daily routine.14-16 Although a healthy lifestyle may substantially decrease mortality and may improve population health, the population prevalence of healthy living remains low. 4
In particular, the degree of adherence to the 6 pillars of lifestyle medicine in the US general population is currently unknown. Such data could be valuable in supporting governmental agencies and other institutions to establish policies to improving the health of the general population. Moreover, such data could also aid lifestyle practitioners developing tailored and cost-efficient strategies for certain populations at a disproportional risk. To address this gap, we used nationally representative data from the National Health and Nutrition Examination Surveys (NHANES), and analyzed adherence to four of the six pillars of lifestyle medicine in the United States (US) general population.
Methods
Assessment of Lifestyle Medicine Pillars With the NHANES
All data used in this analysis stems from the NHANES 2015-2016 cycle.17,18 The NHANES is an ongoing program of studies conducted by the Centers for Disease Control and Prevention which was designed to assess the health status of the non-institutionalized US population. For more than 60 years, the NHANES has been conducted as a series of surveys focusing on various population groups and health topics.
A hallmark of the NHANES is its complex multistage, stratified, clustered, and probability sampling design that allows for nationally representative health status assessments. The sample for the survey is selected to represent the US population of all ages. NHANES enrolls a sample of approximately 10,000 participants per each two-year cycle. A major goal of the program is to identify the health care needs of the US population, which supports government agencies and other institutions to establish policies to improving population health. 18 The NHANES program, its chronicles, and its program structure have been described elsewhere in great detail.17,18 Household questionnaires, telephone interviews, and clinical examinations conducted by specially trained healthcare professionals were utilized to collect the data. 19 NHANES was approved by the National Center for Health Statistics (NCHS), and all study participants gave written and oral consent to the study. 20 Adherence to some of the 6 pillars of lifestyle medicine could be assessed directly using unmodified 2015-2016 NHANES variables. For others, approximations and combinations of variables had to be used.
Assessment of Alcohol Intake
Alcohol intake and frequency were assessed using data from the mobile examination center (MEC) examination and “Alcohol Use” questionnaire. 21 This specific questionnaire focused on lifetime and current consumption of alcohol and included the following questions: (I) “In any one year, have you had at least 12 drinks of any type of alcoholic beverage? By a drink, I mean a 12 oz. beer, a 5 oz. glass of wine, or a one and a half ounces of liquor.”; (II) “In your entire life, have you had at least 12 drinks of any type of alcoholic beverage?”; (III) “In the past 12 months, how often did you drink any type of alcoholic beverage?” and (IV) “In the past 12 months, on those days that you drank alcoholic beverages, on the average how many drinks did you have?”. Based on the ALCM pillar-booklet “6 ways to take control of your health,” 22 five or more drinks per day were considered excessive alcohol consumption. We coded respondents who answered “yes” to drinking in their entire lifetime, but who had not consumed alcohol in the past 12 months as “former drinkers.” Respondents who answered “yes” to drinking at least 12 alcoholic drinks in the past year or in their entire lifetime, and who had consumed alcohol on at least 1 day in the past year, were considered current drinkers. Those who answered “no” to drinking any alcohol in their entire lifetime and in the past 12 months were coded as “never drinkers.” For those respondents that were identified as “current drinkers,” questions (III) and (IV) were employed to characterize this sample in greater detail.
Assessment of Smoking Status
Smoking status was assessed using the “Smoking - Cigarette Use” questionnaire. 23 This module contained the 2 following questions on smoking (I) “Have you smoked at least 100 cigarettes in your entire life?” and (II) “Do you now smoke cigarettes?”. We defined current smokers by the second question. Persons who responded “every day” or “some days” were included in the current smoker category. Former smokers or persons who had quit smoking were defined as answering “yes” to the question “Have you smoked at least 100 cigarettes in your entire life?” and “no” to the question, “Do you now smoke cigarettes?”. Never smokers were defined as those who responded “no” to both questions. For the currently smoking subpopulation, we used the question “During the past 30 days, on the days that you smoked, about how many cigarettes did you smoke per day?” to gain additional insights with regard to current smoking quantities.
Assessment of Sleep Status
Sleep status was assessed with data from the sleep disorders data set, which provides questions on sleep habits and disorders. 24 More specifically, we used the question “How much sleep do you usually get at night on weekdays or workdays?”. Seven hours per night were used as the cut-off based on the ACLM pillars. Additionally, we performed subpopulation analyses to identify the proportion of individuals sleeping more than 9 hours per day, as the latter may also pose health risks. 25
Assessment of Physical Activity Status
To assess physical activity, we made use of the question “How much time do you spend doing moderate-intensity sports, fitness or recreational activities on a typical day?”. This question stems from the Physical Activity questionnaire, which provides respondent-level interview data on physical activities. 26 If required, participants were additionally given the following information: moderate-intensity sports, fitness or recreational activities cause small increases in breathing or heart rate and is done for at least 10 minutes continuously. Based on the ALCM pillar-booklet “6 ways to take control of your health,” 22 150 minutes of moderate-intensity activity per week were used as a cut-off. We also analyzed the average number of weekly days of activity using the question: “In a typical week, on how many days {do you/does SP} do moderate-intensity sports, fitness or recreational activities?”. Finally, we assessed the amount of sedentary activity using the question “How much time do you usually spend sitting on a typical day?”. This particular NHANES question referred to sitting at school, at home, getting to and from places, or with friends including time spent sitting at a desk, traveling in a car or bus, reading, playing cards, watching television, or using a computer.
Assessment of Whole-Food Plant-Based Diet Status
Adherence to a whole-food plant-based diet was not directly available as an NHANES variable. Instead, we examined nutritional characteristics that were deemed typical for a whole-food plant-based diet. The 2 key characteristics that were repeatedly found in consumers of a whole-food plant-based diet in previous studies were a higher intake of fiber and a low intake of saturated fat (due to the sparse consumption of animal products).27-29 As such, we calculated the weighted percentage of participants with a fiber intake of more than 14 g/1000 kcal per day and a saturated fat intake <10% of total energy. Said nutritional characteristics are in line with the ACLM’s recommendation of a diet rich in fiber, 5 and low in high-fat products. 22
Assessment of Stress Management Strategies and Social Connection Status
We initially planned to use 2 additional questions from the physical functioning questionnaire to indirectly assess stress management strategies and social connection behavior. Regrettably, no adequate NHANES variables were identified that adequately reflected these 2 pillars. As such, only four of the six ALCM pillars were assessed in total.
Other Covariates
Other covariates used for this analysis included sociodemographic data, including age (which was treated as a continuous variable), sex (categorical variable: female, male), race/ethnicity (categorical variable: Mexican American, other Hispanic, Non-Hispanic White, Non-Hispanic Black and other Race), educational level (categorical variable: less than ninth grade, 9-11th grade, high school graduate, some college or associate degree, college graduate or above), and marital status (categorical variable: married/living with partner, widowed/divorced/separated, never married).
Statistical Analysis
We used STATA 14 statistical software (StataCorp. 2015. Stata Statistical Software: Release 14. College Station, TX: StataCorp LP) for the analysis. Histograms, box plots, and subpopulation summary statistics were used to check for normality of continuous variables. Following current approaches in applied survey data analysis by Heeringa, West and Berglund, categorical variables were described with their weighted proportions and the corresponding standard error in parenthesis. 30 We estimated standard errors using Taylor series linearization to account for the complex NHANES sampling design. To account for differential non-response and/or non-coverage and to adjust for oversampling, appropriate sample weights were used. This procedure allows the user to estimate weighted percentages and means representative of the non-institutionalized civilian US population. The current National Center for Health Statistics data presentation standards for proportions were used to strictly assess all weighted proportions for potential unreliability. 31 For this, the user-written post-estimation command “kg_nchs” was used in Stata. 32 Stratified analyses by sex and age category were performed. Based on the 2011-2016 NHANES Analytic Guidelines, the following age categories were used for stratified analyses: 20-38 years, 39-59 years, ≥60 years. 33 Only individuals with a full dataset (e.g., no missing data) aged 20 years or older were considered eligible for this analysis.
Results
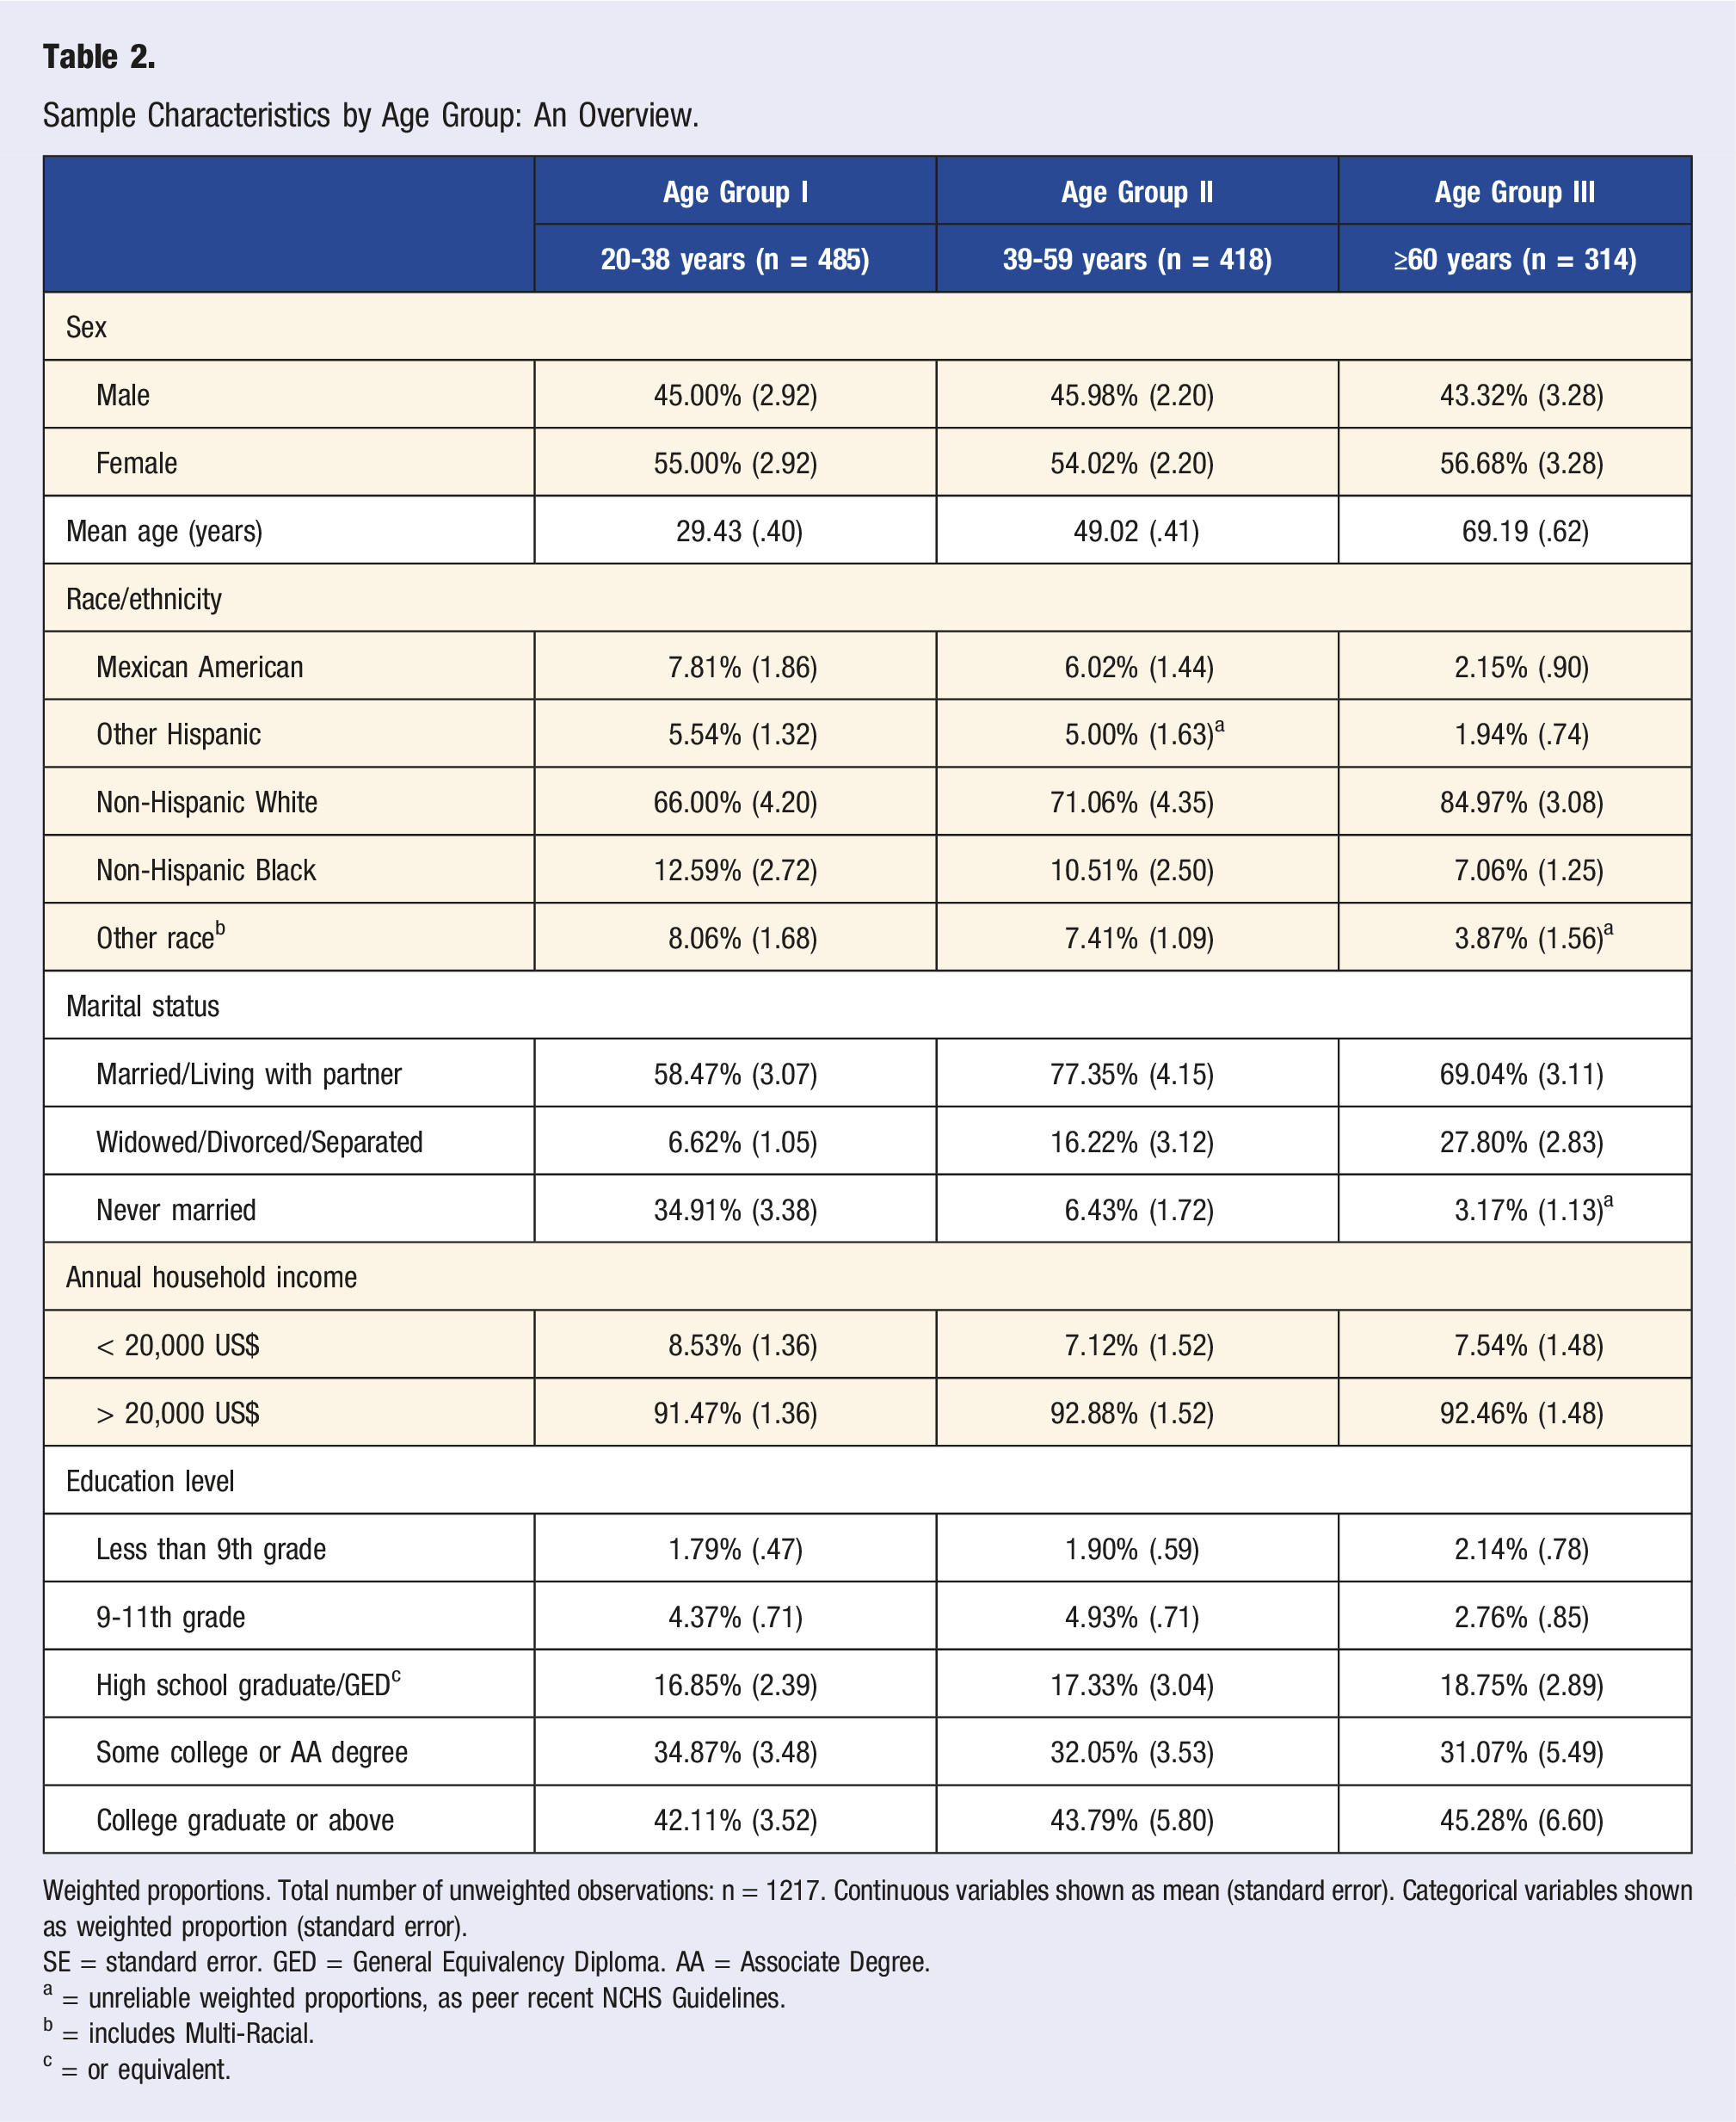
One-thousand two-hundred seventeen participants with a full dataset were identified, which may be extrapolated to represent n = 64,468,933 US adults. Figure 2 shows a participant inclusion flowchart, providing an explanation for inclusion and exclusion of participants in the study. Table 1 shows the sociodemographic breakdown of the cohort, and Table 2 shows the sociodemographic breakdown of the cohort by age categories. Participant inclusion flowchart. Sample Characteristics: Sociodemographic Data. Weighted proportions. Sample size (unweighted observations): n = 1217. SE = standard error. GED = General Equivalency Diploma. AA = Associate Degree. a = or equivalent; all (weighted) proportions meet the NCHS presentation standards and can be considered reliable. Sample Characteristics by Age Group: An Overview. Weighted proportions. Total number of unweighted observations: n = 1217. Continuous variables shown as mean (standard error). Categorical variables shown as weighted proportion (standard error). SE = standard error. GED = General Equivalency Diploma. AA = Associate Degree. a = unreliable weighted proportions, as peer recent NCHS Guidelines. b = includes Multi-Racial. c = or equivalent.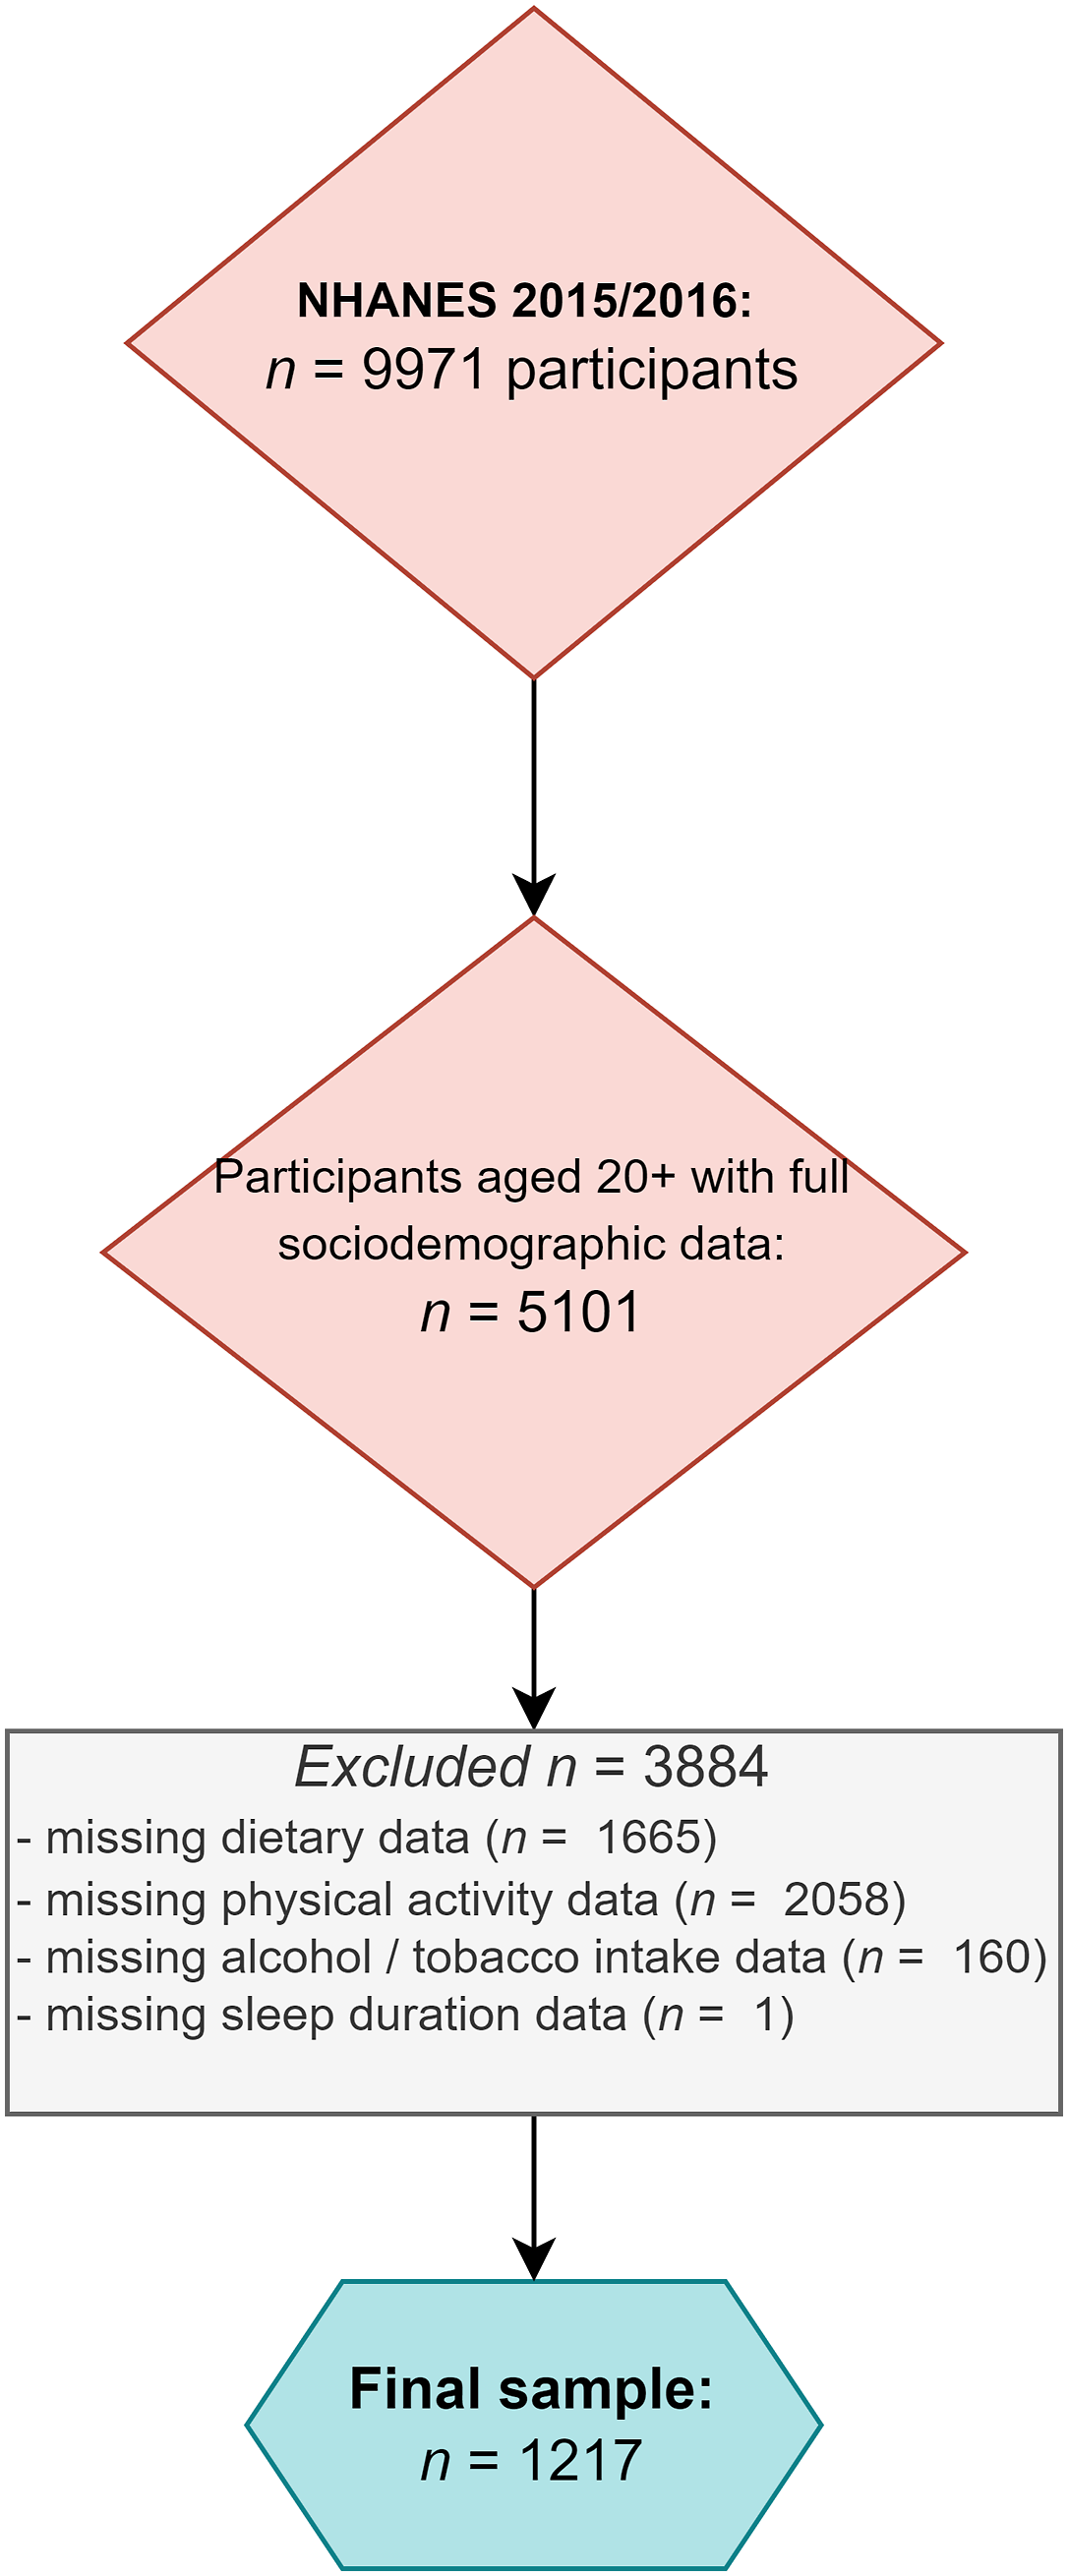
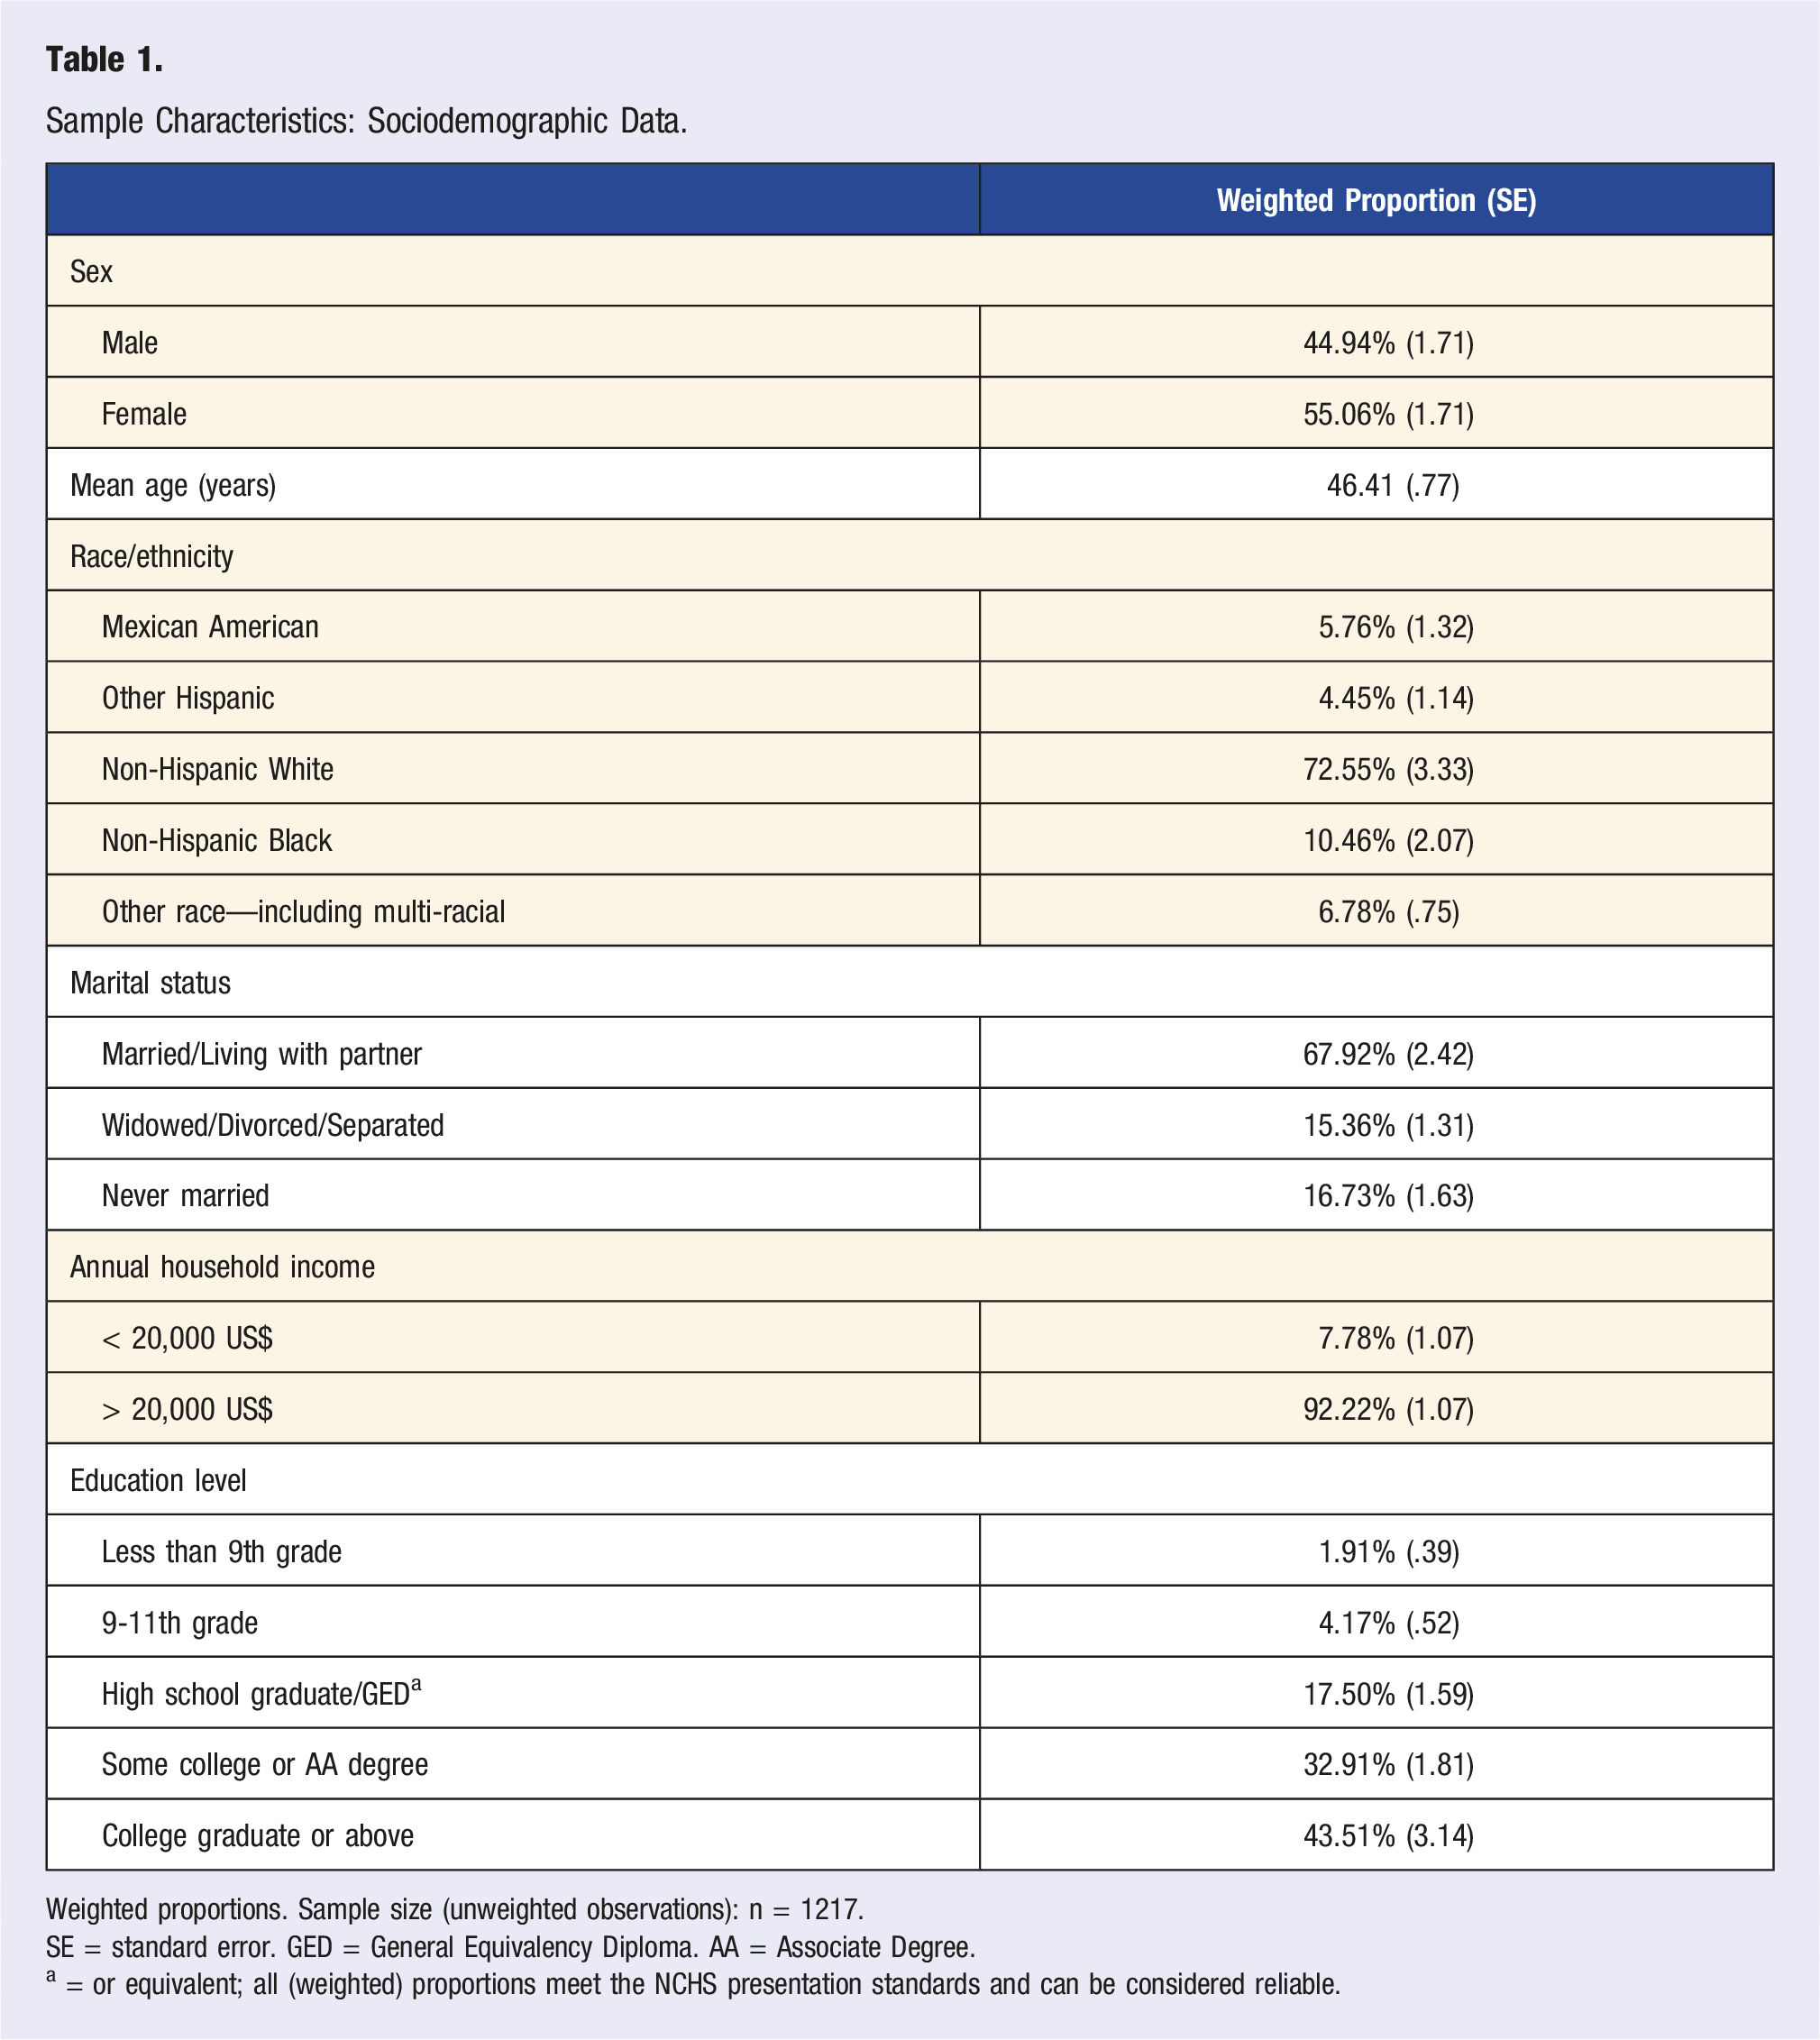
The total sample encompassed 44.94% males (weighted proportion) and 55.06% females (weighted proportion). Approximately 72.5% of participants were of Non-Hispanic White origin. More than two thirds of the sample were married (weighted proportion) whereas less than 1/3 were divorced/separated/widowed or never married (weighted proportion).
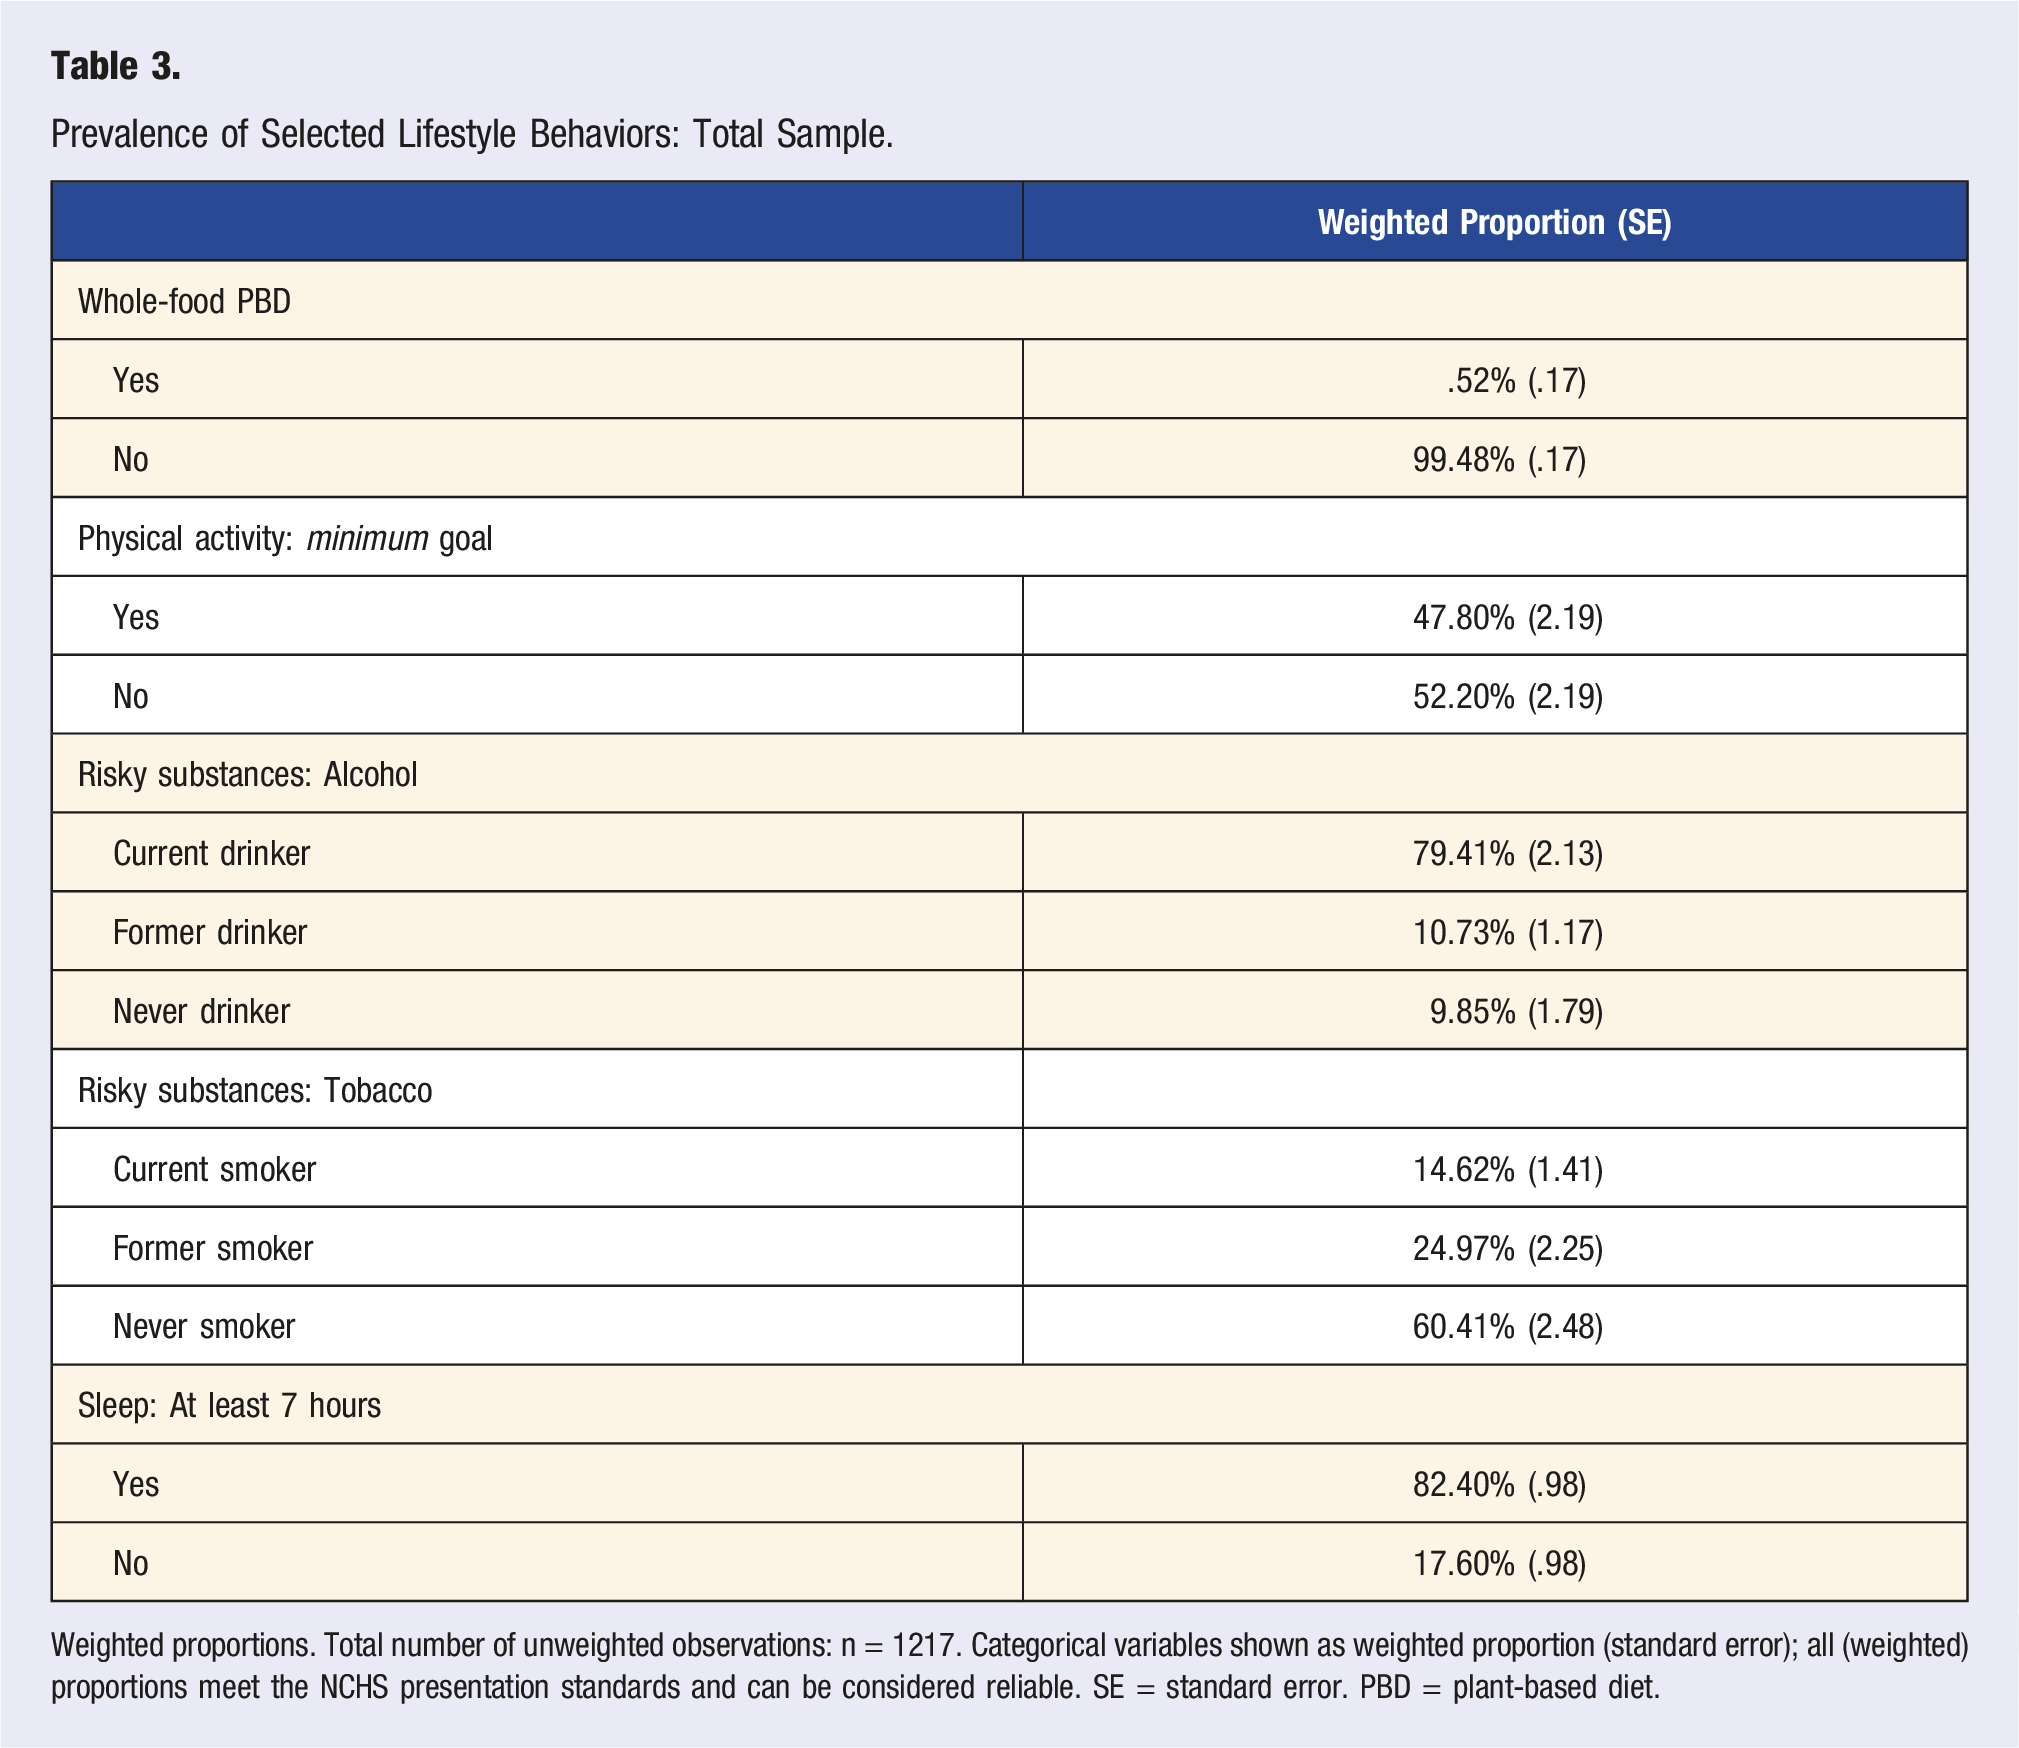
Prevalence of Selected Lifestyle Behaviors: Total Sample.
Weighted proportions. Total number of unweighted observations: n = 1217. Categorical variables shown as weighted proportion (standard error); all (weighted) proportions meet the NCHS presentation standards and can be considered reliable. SE = standard error. PBD = plant-based diet.
Prevalence of Selected Lifestyle Behaviors by Age Category.
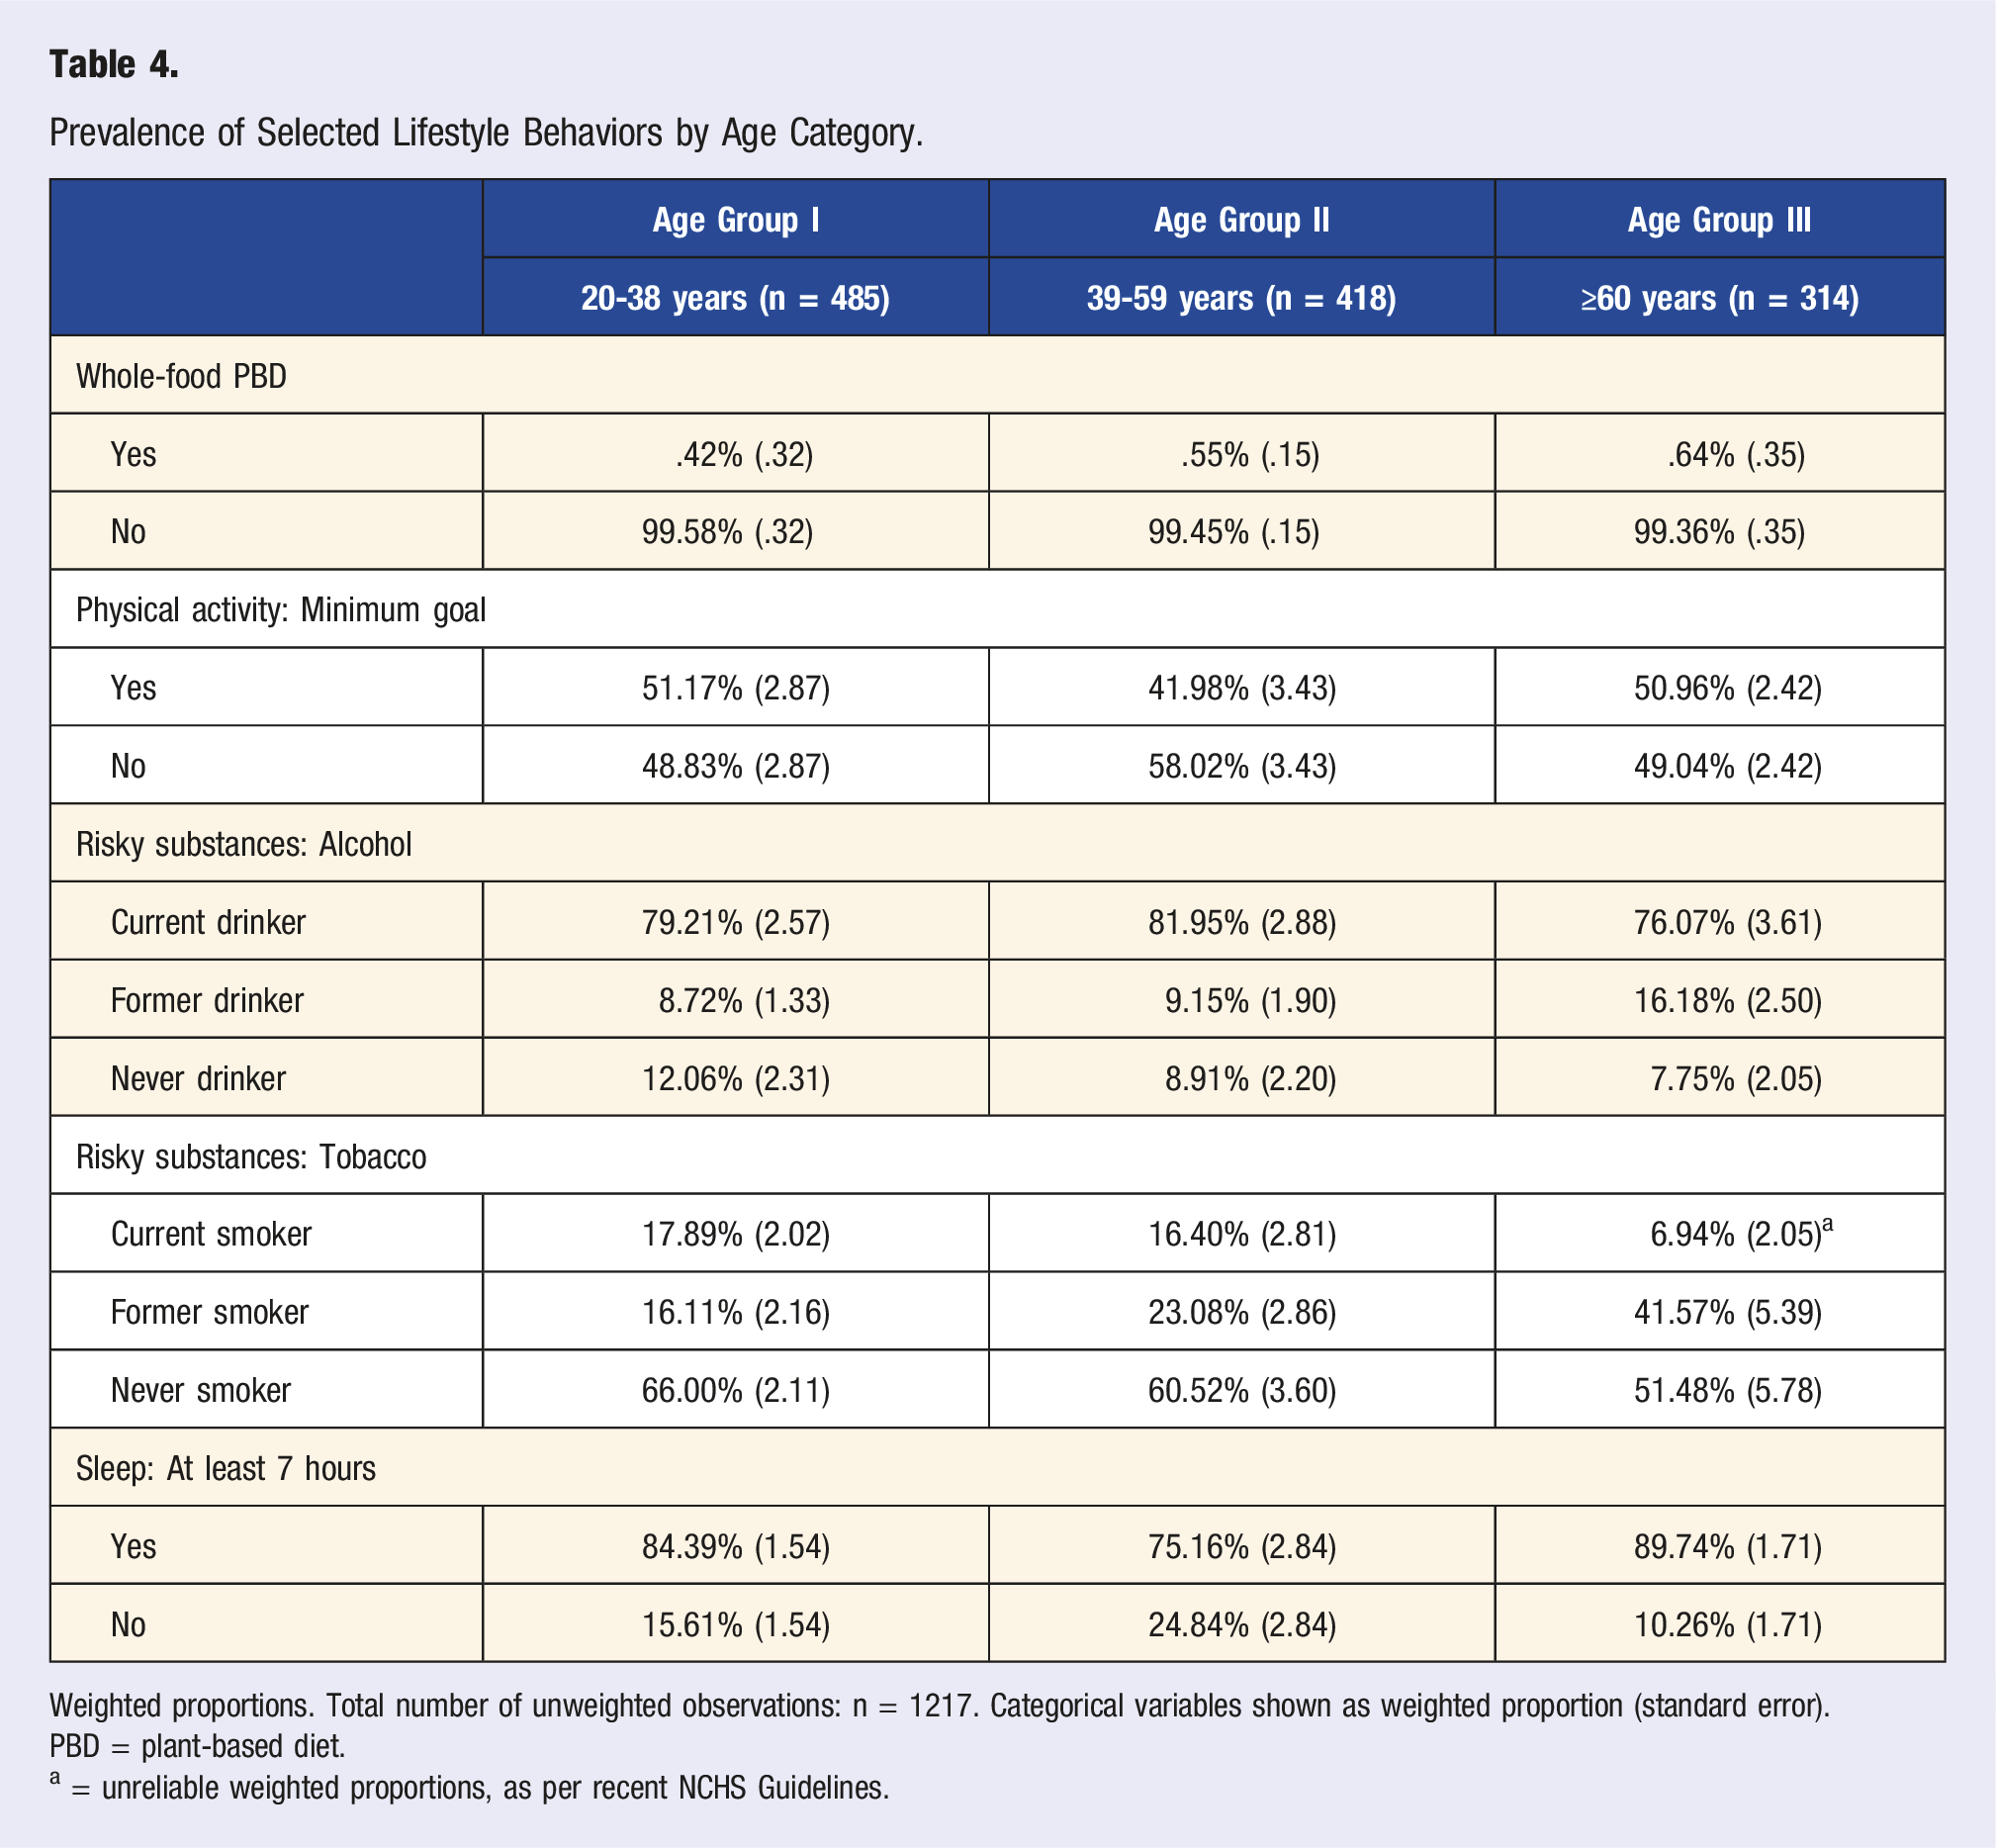
Weighted proportions. Total number of unweighted observations: n = 1217. Categorical variables shown as weighted proportion (standard error).
PBD = plant-based diet.
a = unreliable weighted proportions, as per recent NCHS Guidelines.
The weighted proportion of current smokers was approximately 14.6%. Almost all of these participants (n = 208/210) shared information about their average number of cigarettes per smoking day. Said participants (n = 208), smoked on average 9.79 (.83) cigarettes per day they smoked. Almost 80% of participants indicated alcohol consumption. When analyzing the subsample of current drinkers (n = 887), mean alcohol intake frequency was 3.28 (.21) days per year. On those days that alcoholic beverages were consumed, current drinkers had, on average, 2.47 (.10) drinks. More than 11% (11.18%; weighted proportion) indicated an excessive alcohol intake on these days (5 or more drinks). A very uneven distribution was observed with regard to the whole-food plant-based diet pattern, where less than 1% of the sample met the pre-defined criteria. Only 47.80% of the sample met the minimum weekly physical activity goals specified earlier. Those participants reporting at least 150 minutes of moderate physical activities per week, performed moderate-intensity sports, fitness, or recreational activities on an average of 4.26 (.11) days per week. Those not meeting the weekly goals reported activities on an average of 2.56 (.08) days per week. Average sedentary activity also varied between groups (364.02 (13.23) minutes vs 409.10 (12.47) minutes per day).
Approximately 80% of the sample reported sleeping more than 7 hours per night. In total, 7.31% slept more than 9 hours per day.
Substantial differences could be observed between the age categories (Table 4). Notably, due to the modest sample size, some weighted proportions must be considered unreliable as per the recent NCHS guidelines. 31 Nevertheless, Table 4 allows for some important insights in various trends: for example, a lower proportion of individuals meeting the physical activity goals in those aged 39-59 years, a higher prevalence of alcohol intake in the same age group, and a lower weighted proportion of current smokers in those aged 60 years or older. As expected from Table 3, the weighted proportion of participants meeting indicators of a whole-food plant-based diet was very low across all age groups. When analyzing the subsample of current drinkers (n = 379) aged 20-38 years, mean alcohol intake frequency was 2.89 (.08) days per year. On those days that alcoholic beverages were consumed, current drinkers in this age group had on average, 2.98 (.11) drinks. 17.59% (weighted proportion) indicated an excessive alcohol intake on these days (5 or more drinks). The currently drinking subsample of participants aged 39-59 years consumed alcohol on an average of 3.65 (.45) days per week. Almost 11% (10.50%, weighted proportion) indicated an excessive alcohol intake on these days (5 or more drinks). With only 1.79%, this proportion was substantially lower in participants aged 60 years or older.
Glancing at the weighted proportions of individuals who slept more than 9 hours per day, the weighted proportions across age categories were as follows: 8.92% (1.62), 4.34% (1.05), and 9.08% (1.80), respectively. Participants aged 20-38 years who reported at least 150 minutes of moderate physical activities per week, performed moderate-intensity sports, fitness, or recreational activities on average on 4.27 (.15) days per week. This number was almost identical in those aged 39-59 years and 60 years or older (4.26 (.15) and 4.25 (.21), respectively).
Prevalence of Selected Lifestyle Behaviors by Sex.
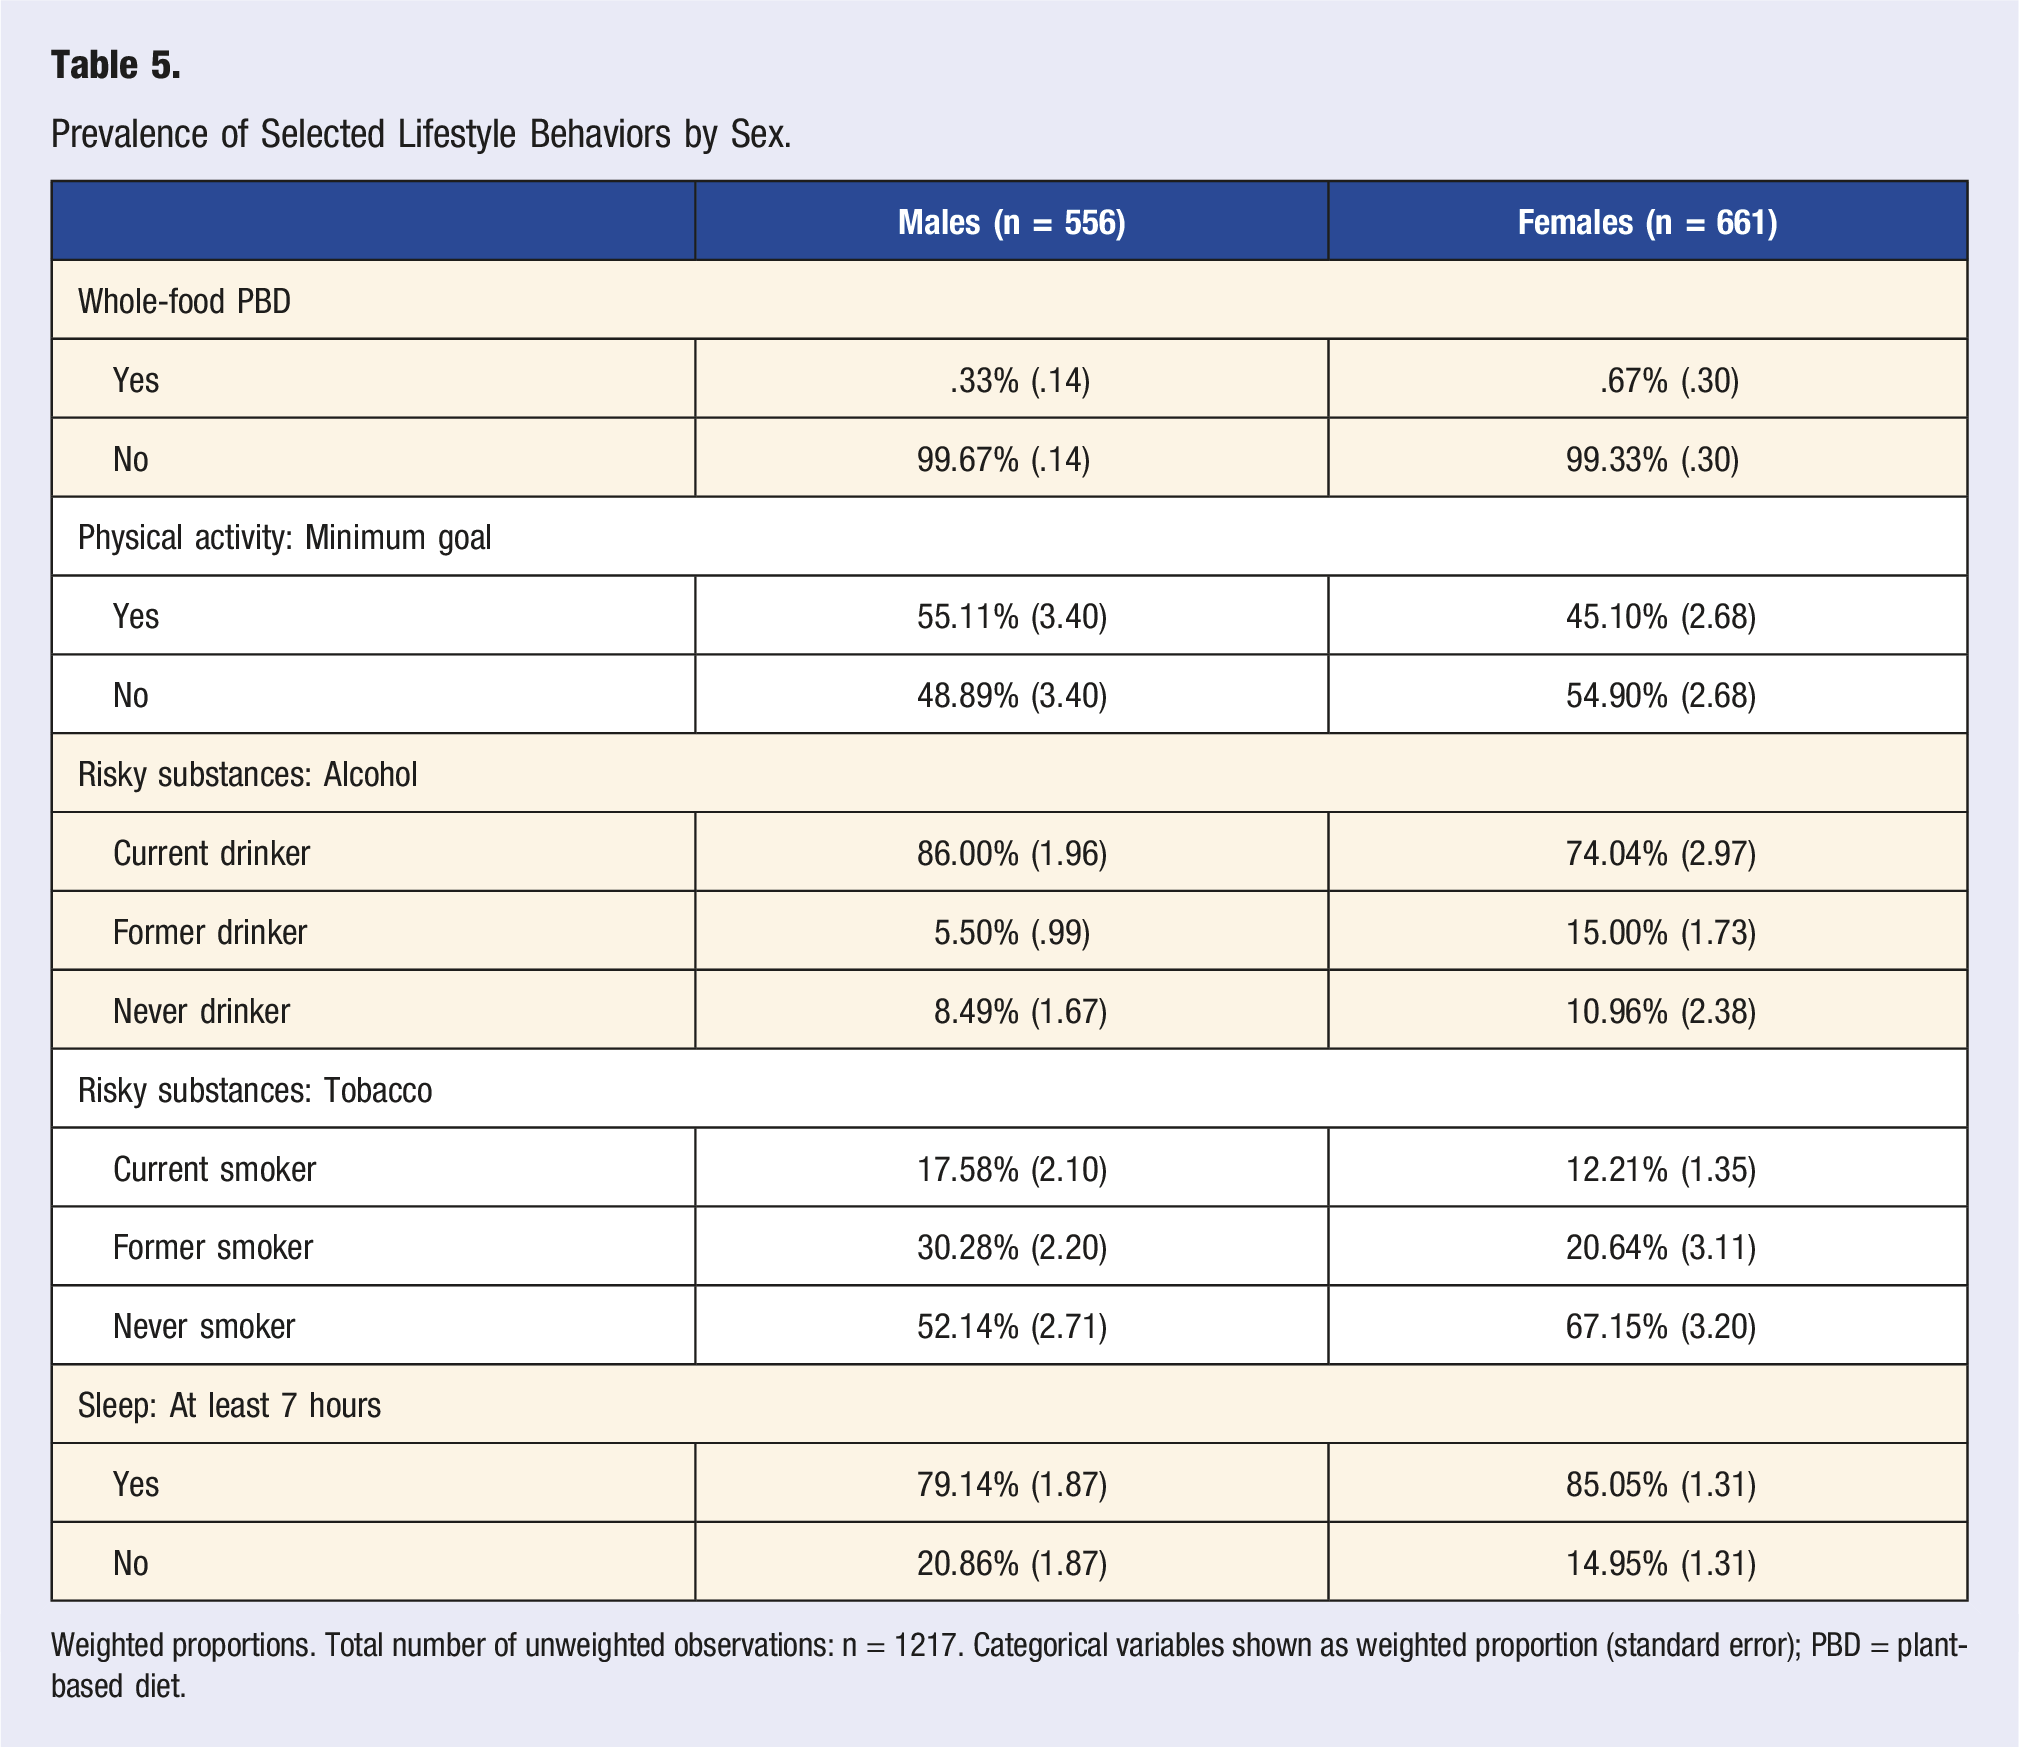
Weighted proportions. Total number of unweighted observations: n = 1217. Categorical variables shown as weighted proportion (standard error); PBD = plant-based diet.
Discussion
The present study investigated the prevalence of selected lifestyle behaviors (based on 4 of the 6 pillars of lifestyle medicine) in the US general population. The results are concerning, particularly with regard to the very low prevalence of participants that met common indicators of a whole-food plant-based diet, and in light of the high percentage of participants not meeting the minimal physical activity goal of 150 minutes of moderate intensity activity per week. The high prevalence of risky substances (excessive alcohol intake and tobacco) in younger participants aged 20-38 years is an additional concern.
Our results support the finding that the prevalence of a healthy lifestyle among adults in the United States is low. 4 The large number of people not achieving optimal levels of common risk factors has serious implications for public health, even in low-risk populations. 34 Adopting a healthy lifestyle could substantially reduce premature mortality and prolong life expectancy in US adults. 35 Li et al. suggested that adherence to 5 low-risk lifestyle-related factors (a healthy weight, regular physical activity, never smoking, a healthy diet, and limiting alcohol consumption) could prolong life expectancy at age 50 years by 14.0 and 12.2 years for female and male US adults compared with individuals who adopted zero low-risk lifestyle factors. 35
Lifestyle medicine strategies, as suggested by the ACLM, are often multidisciplinary and require thorough medical assessment, management, counseling, and coordination. 36 Regrettably, the prevalence of lifestyle modification advised by health care providers is generally low among US adults. 37 In addition to that, advocating for plant-based nutrition—an essential ACLM pillar—has not yet found its way into the treatment repertoire of many practitioners.38,39 A study by Grabovac recently suggested that “prescribed lifestyle modification is a missing opportunity in implementing sustainable strategies to reduce chronic condition burden.” 37 Increasing the popularity of plant-based diets—including Mediterranean and vegan diets—that are rich in important micronutrients could lead to health improvements of the US general population. 40
Establishing comprehensive and sustainable lifestyle modification programs is challenging, and requires the identification of drivers and constraints of successful implementation. 41 Insights from the Finnish Intervention Study to Prevent Cognitive Impairment and Disability revealed that typical barriers include insufficient infrastructure and resources, a lack of personnel education and a lack of multi-professional collaboration. 41 Once implemented successfully, however, lifestyle intervention programs were shown to be highly effective in a community setting. 42 Evidence on what constitutes efficacious interventions readily exists, and proper nudging strategies to induce health-promoting behavior change have been long identified.43,44 Regardless, our data suggest a low population prevalence of healthy living in US adults.
We argue that the medical community may play a pivotal role in a much needed shift within the next years. Bodai and colleagues emphasized that the medical community is placing people at harm by largely “ignoring the root causes of disease and neglecting to prioritize lifestyle measures for prevention.” 45 To some extent, our data reinforce this call for action and reiterate the need for consequent behavioral counseling and education in daily clinical practice and disease prevention.46,47 The establishment of lifestyle medicine as an effective therapeutic approach will largely depend on a comprehensive strategic plan to embrace the basic concepts addressed. 45 This calls for a change within the medical community and trained and dedicated professionals equipped with the tools to practice lifestyle medicine now. Large-scale awareness campaigns, the implementation of a national “lifestyle medicine day” and intensified continuous medical education activities in the lifestyle medicine field could help to further promote lifestyle medicine in the US.
Although of high interest and translational relevance, our analysis has several shortcomings that warrant further discussion. We clearly acknowledge that only four out of six lifestyle medicine pillars were assessed. We initially planned to use 2 additional questions from the physical functioning questionnaire to indirectly assess stress management strategies. The NHANES physical functioning questionnaire included the questions “By yourself and without using any special equipment, how much difficulty do you have going out to things like shopping, movies, or sporting events?” and “By yourself and without using any special equipment, how much difficulty do you have doing things to relax at home or for leisure (reading, watching TV, sewing, listening to music)?”. Although potentially suitable to partially assess stress management, these questions were not used. We also refrained from the idea because of a substantial reduction in the eligible sample size for final analysis (see below).
To maintain an adequate sample size (as per recent applied survey data analysis recommendations only participants with a complete dataset were considered), we used only a selected number of variables to assess each pillar and we did not include disease-specific outcomes. As such, the analysis lacks detail in some areas, and some key information including smoking pack-years or a detailed assessment of the type of exercise is not included. Finally, the present analysis did not go beyond the 6 pillars of lifestyle medicine and somewhat neglected common life principles in the Blue Zones, such as “respect for the planet” and “having a purpose in life,” 48 for a lack of adequate variables in the NHANES. Finally, one could argue that our data is already somewhat dated (2015-2016). Then again, newer cycles including the 2017-2020 pre-pandemic cycle did not include the variables under discussion. The 2021-2022 cycle has not yet been released, but could later be subject to interesting analyses in the future. Despite these limitations, we believe our assessment to be valuable and an important reminder that there is still work to be done in the field. Future studies in the field should include additional variables that adequately reflect the content of the non-assessed lifestyle medicine pillars. The NHANES is per se well-suited for nationally representative assessments and analyses stratified by population subgroups (e.g., by race/ethnicity or education level). The complementation of future NHANES cycles with more lifestyle medicine-related variables would allow for a better understanding of lifestyle medicine behaviors in the US.
Conclusion
Our results reinforce the findings of a low population prevalence of healthy living in US adults and suggest a low adherence to four of the six pillars of lifestyle medicine in the US general population. Lifestyle medicine as a sustainable and cost-effective strategy to substantially reduce premature mortality and prolong life expectancy in US adults is now widely established. As such, our findings reiterate the paramount importance of a critical rethinking in the medical community—requiring a shift from symptom management via often expensive interventions and prescriptions towards “treating the cause” of chronic non-communicable diseases.
Footnotes
Author Contributions
MAS performed the analysis and interpreted the data. MAS is the guarantor of this study, designed the idea, and validated data. Writing original draft: MAS. Writing—review and editing: MAS, MB, MJ. Illustration: MAS, MB. All authors reviewed and approved the final manuscript. All authors agreed to be accountable for all aspects of the work in ensuring that questions related to the accuracy or integrity of any part of the work are appropriately investigated and resolved.
Declaration of Conflicting Interests
The author(s) declared no potential conflicts of interest with respect to the research, authorship, and/or publication of this article.
Funding
The author(s) received no financial support for the research, authorship, and/or publication of this article.
Ethical Statement
Data Availability Statement
Data is publicly available online (![]() ). The datasets used and analyzed during the current study are available from the corresponding author on reasonable request.
17
). The datasets used and analyzed during the current study are available from the corresponding author on reasonable request.
17