
Abstract
…individuals with MetS tend to engage in longer bouts of SB with fewer interruptions…
Introduction
Type 2 diabetes mellitus (T2DM), chronic kidney disease (CKD), and cardiovascular diseases (CVD) are leading contributors to worldwide mortality.1-3 A major shared risk factor for these cardiometabolic conditions is the metabolic syndrome (MetS), defined as a constellation of risk subfactors that frequently co-occur and result in amplified cardiometabolic risk.4-8 Specifically, the risk subfactors include elevated waist circumference (WC), elevated fasting blood glucose (FBG), elevated blood pressure (BP), elevated triglycerides (TRI), and reduced high-density lipoprotein cholesterol (HDL). 4 The traditional dichotomous positive MetS classification requires the manifestation of at least 3 of 5 factors in any combination. However, the dichotomous classification has led to a paradox between the prevalence of MetS and cardiometabolic diseases. The prevalence of MetS among European and US adults ranges between 24–34.2%.4,6,9,10 Black men have a lower prevalence of MetS (16.1%) compared with White men (29.3%); however, among both sexes, there is an elevated prevalence of CVDs with MetS, such as T2DM (15.4% vs 8.6% among Black and White individuals, respectively).10-12 Further, age-adjusted hypertension among Black men and women was 34.5% and 32.3%, compared with 28.8% and 25.7% among Non-Hispanic White men and women, respectively. 11
This paradox led to the development of new methods to assess MetS,10,13 including consideration of the 16 unique combinations of MetS (e.g., WC+TRI+FBG+BP+HDL, WC+TRI+FBG+BP, WC+TRI+BP) 13 and a continuous MetS severity z-score (MetS-Z). 10 Compared with individuals without any positive MetS criteria, those with both FBG and BP at MetS positive threshold have a four-times greater risk of incident stroke, while those with either FBG or BP have a three-times greater risk. 13 Examination of the unique MetS clusters allows for changes in the specific and total number of positive criteria but does not allow for within-criteria changes, MetS-Z is a continuous z-score rectifying these issues. DeBoer and Gurka found baseline MetS-Z to be associated with the development of T2DM (odds ratio per 1 unit increase: 5.1) and CVD (1.8). 6 In addition to higher baseline MetS-Z, worsening MetS-Z over time was associated with increased odds of T2DM and CVD at 25-30 follow-up (2.7 and 9.8, respectively) and again 8-14 years of additional follow-up (2.8 and 2.4, respectively).6,14,15
Sedentary behavior (SB) and physical activity (PA) are 2 of the most influential modifiable lifestyle factors for the development of MetS and consequent conditions.8,16 SB is any waking behavior performed in a sitting, reclining, or lying posture that is also characterized as having an energy expenditure of ≤1.5 metabolic equivalents (METs). 17 Typical SBs, including screen time (e.g., television viewing and video gaming) and reading, have been associated with increased incidence of T2DM, CVD, cancer, and all-cause mortality. 18 A meta-analysis examining the relation between SB and odds of MetS observed the highest level of SB, compared with the lowest, to be associated with increased risk of developing MetS by 73%. 8 Additionally, individuals with MetS tend to engage in longer bouts of SB with fewer interruptions. 19 An increasing body of research contends that SB and PA are independent of one another concerning influence on MetS8,20,21 and mortality risk.8,16 Nearly 80% of Americans attain insufficient PA, defined as not meeting the Physical Activity Guidelines for Americans, to stave off chronic maladies, 22 including MetS,23,24 ultimately contributing to approximately 8% of premature deaths. 25 These observations are echoed in the revised 2018 Physical Activity Guidelines for Americans, which stated that individuals should not only meet the recommended PA per week, but they should also strive to reduce SB. 26 However, it remains unclear how SB and PA vary between specific MetS clusters or by MetS-Z.
The purpose of this study was to consider the prevalence and explore differences in SB, PA, and MetS-Z among the 16 unique MetS clusters and to consider SB and PA differences by MetS-Z tertiles.
Methods
This study used data from the 2015 to 2016 National Health and Nutritional Examination Survey (NHANES), which is a nationally representative cross-sectional survey of the civilian, noninstitutionalized population in the United States. 27 Demographic information, including age, sex, race, and ethnicity, was self-reported. Cardiometabolic variables used to classify MetS were collected by trained individuals following standard protocols. 28
Metabolic Syndrome
MetS was considered 3 separate ways: the traditional dichotomous method; the 16 unique cluster combinations of positive criteria; and using the MetS-Z. Dichotomous classification of presence or absence of MetS was determined using ATP III criteria, where 3 or more of the above-mentioned criteria are required for positive classification. Only MetS positive participants with no missing MetS criteria data were included in the analysis (n = 792). After dichotomously identifying MetS positive participants, they were then assigned to 1 of the 16 possible different cluster combinations of MetS based on their positive criteria (e.g., WC+FBG+HDL, TRI+FBG+BP+HDL, etc.). The prevalence of the 16 possible cluster combinations was calculated. Finally, MetS-Z was calculated for all MetS positive participants. Sex-, race-, and ethnicity-specific formulas were used to calculate MetS-Z following previously established methodology. 10 MetS-Z uses WC, FBG, BP (systolic only), TRI, and HDL to establish sex-, race-, and ethnicity-specific relative risk of MetS as z-scores. Only equations for Non-Hispanic White, Non-Hispanic Black, and Hispanic males and females are available (n=711). MetS-Z was used for comparisons between MetS cluster groups. However, to consider the influence of SB and PA on MetS severity, MetS-Z tertiles (Lower: −1.95 to .76, Middle: .77 to 1.38, and Upper: 1.39 to 7.32) were created. MetS-Z is relatively novel without established clinically relevant cut-points. The ability to detect meaningful differences is difficult given the tight range of scores, therefore evenly distributed tertiles were employed.
Movement Behaviors
Sedentary behavior, moderate PA (MPA), and vigorous PA (VPA) were self-reported during the questionnaire stage of NHANES as minutes per typical day. SB included nonsleeping activities such as sitting while traveling, for occupational tasks, or recreational activities. PA time included bouts of at ≥10 minutes of MPA or VPA during fitness, recreational activities, and sports, and excluded PA for occupational tasks. Participants were provided verbal descriptions to differentiate between PA intensities. 27 SB, MPA, and VPA were each treated separately. Some participants did not report SB and/or PA, which reduced the unweighted sample for analyses (n = 787).
Statistical Analysis
NHANES survey design variables were applied with the survey design designated as a one-stage survey. Fasting subsample 2-year MEC sampling weight, the most conservative sampling weight, was used per NHANES procedures. One primary sampling unit was a singleton, so it was treated as certainty units to be able to generate 95% confidence intervals (95% CIs). Other methodologies for dealing with single primary sampling units were checked with no substantial differences.
Means for continuous and frequency for discrete variables were calculated along with 95% CIs. An ANCOVA was used to examine differences in movement behaviors between the 16 different MetS clusters. ANOVA analyses were employed to examine MetS-Z differences by MetS cluster and movement behaviors by MetS-Z tertile. To properly account for sample design and generate variance estimates, participants with missing values were not dropped from analysis resulting in differing sample sizes. 29 Bonferroni post hoc analyses were used to determine differences between groups where appropriate. All analyses were conducted using StataSE (17.0, Stata Corp., College Station, Texas) with significance set a priori at P<.05.
Results
Participant Characteristics
Descriptive Characteristics by Metabolic Syndrome Cluster and Sex.
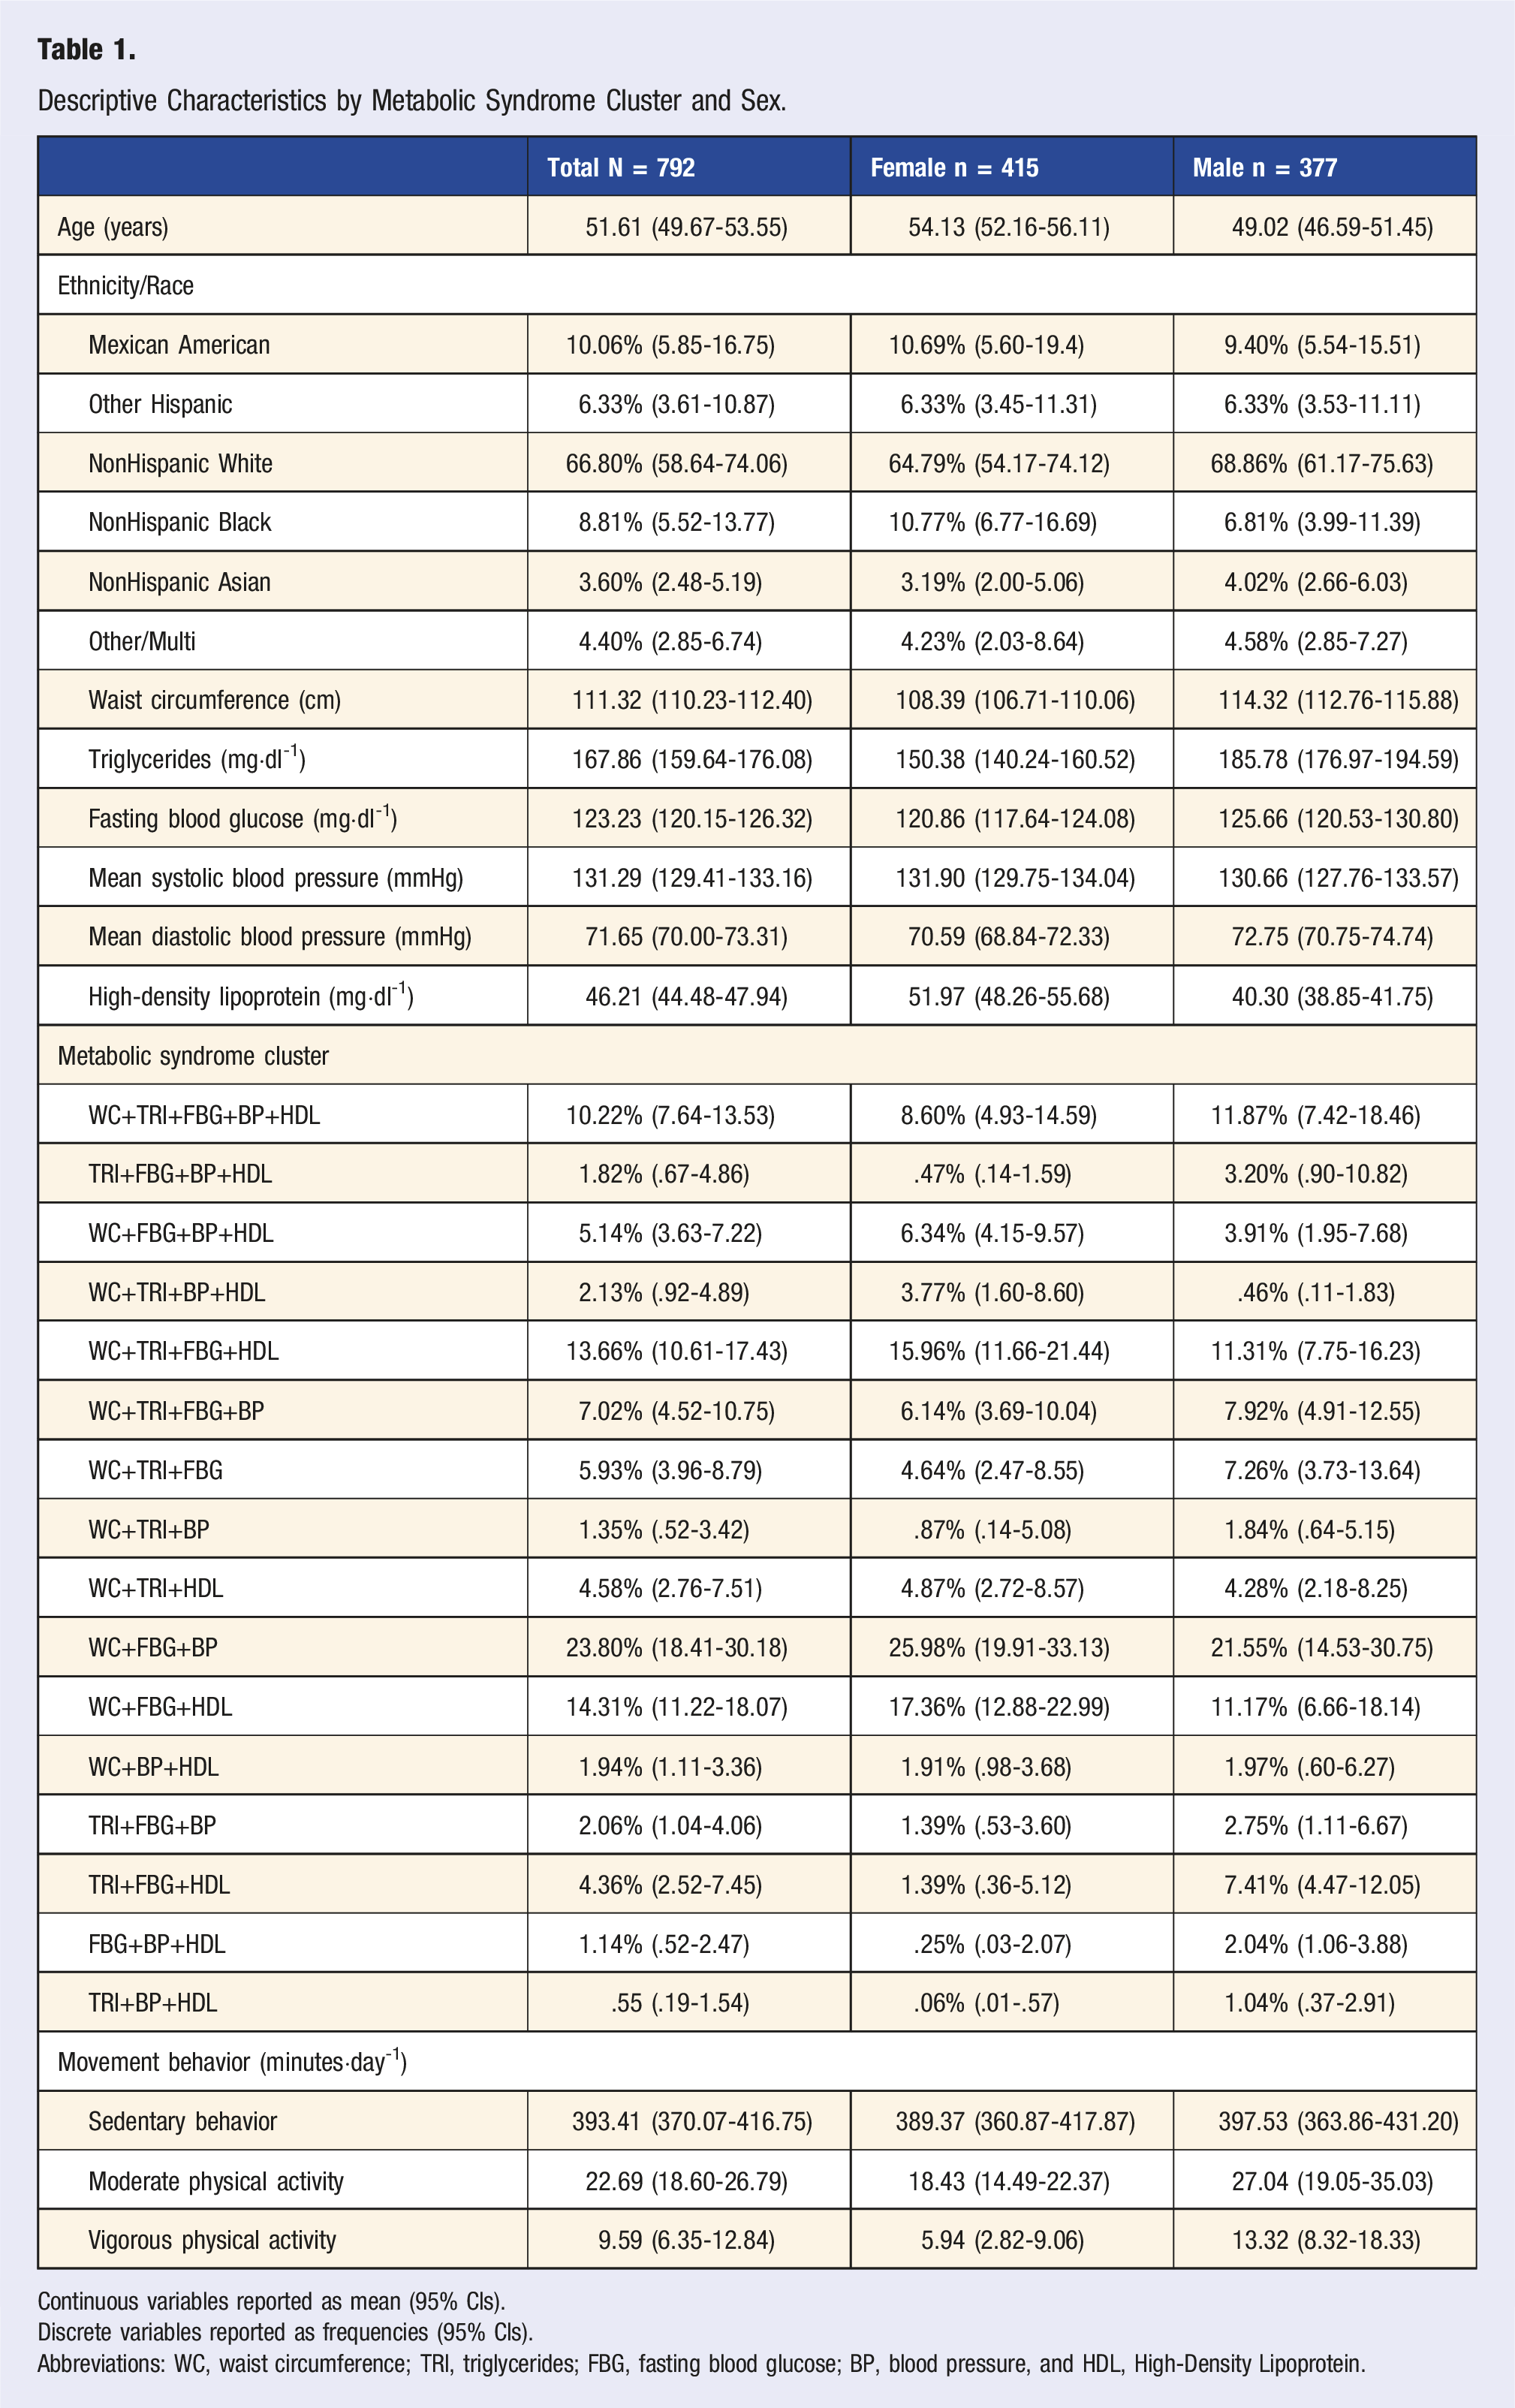
Continuous variables reported as mean (95% CIs).
Discrete variables reported as frequencies (95% CIs).
Abbreviations: WC, waist circumference; TRI, triglycerides; FBG, fasting blood glucose; BP, blood pressure, and HDL, High-Density Lipoprotein.
Metabolic Syndrome Cluster Differences
Daily Minutes of Movement Behavior by Metabolic Syndrome Cluster, Sex, and Intensity.
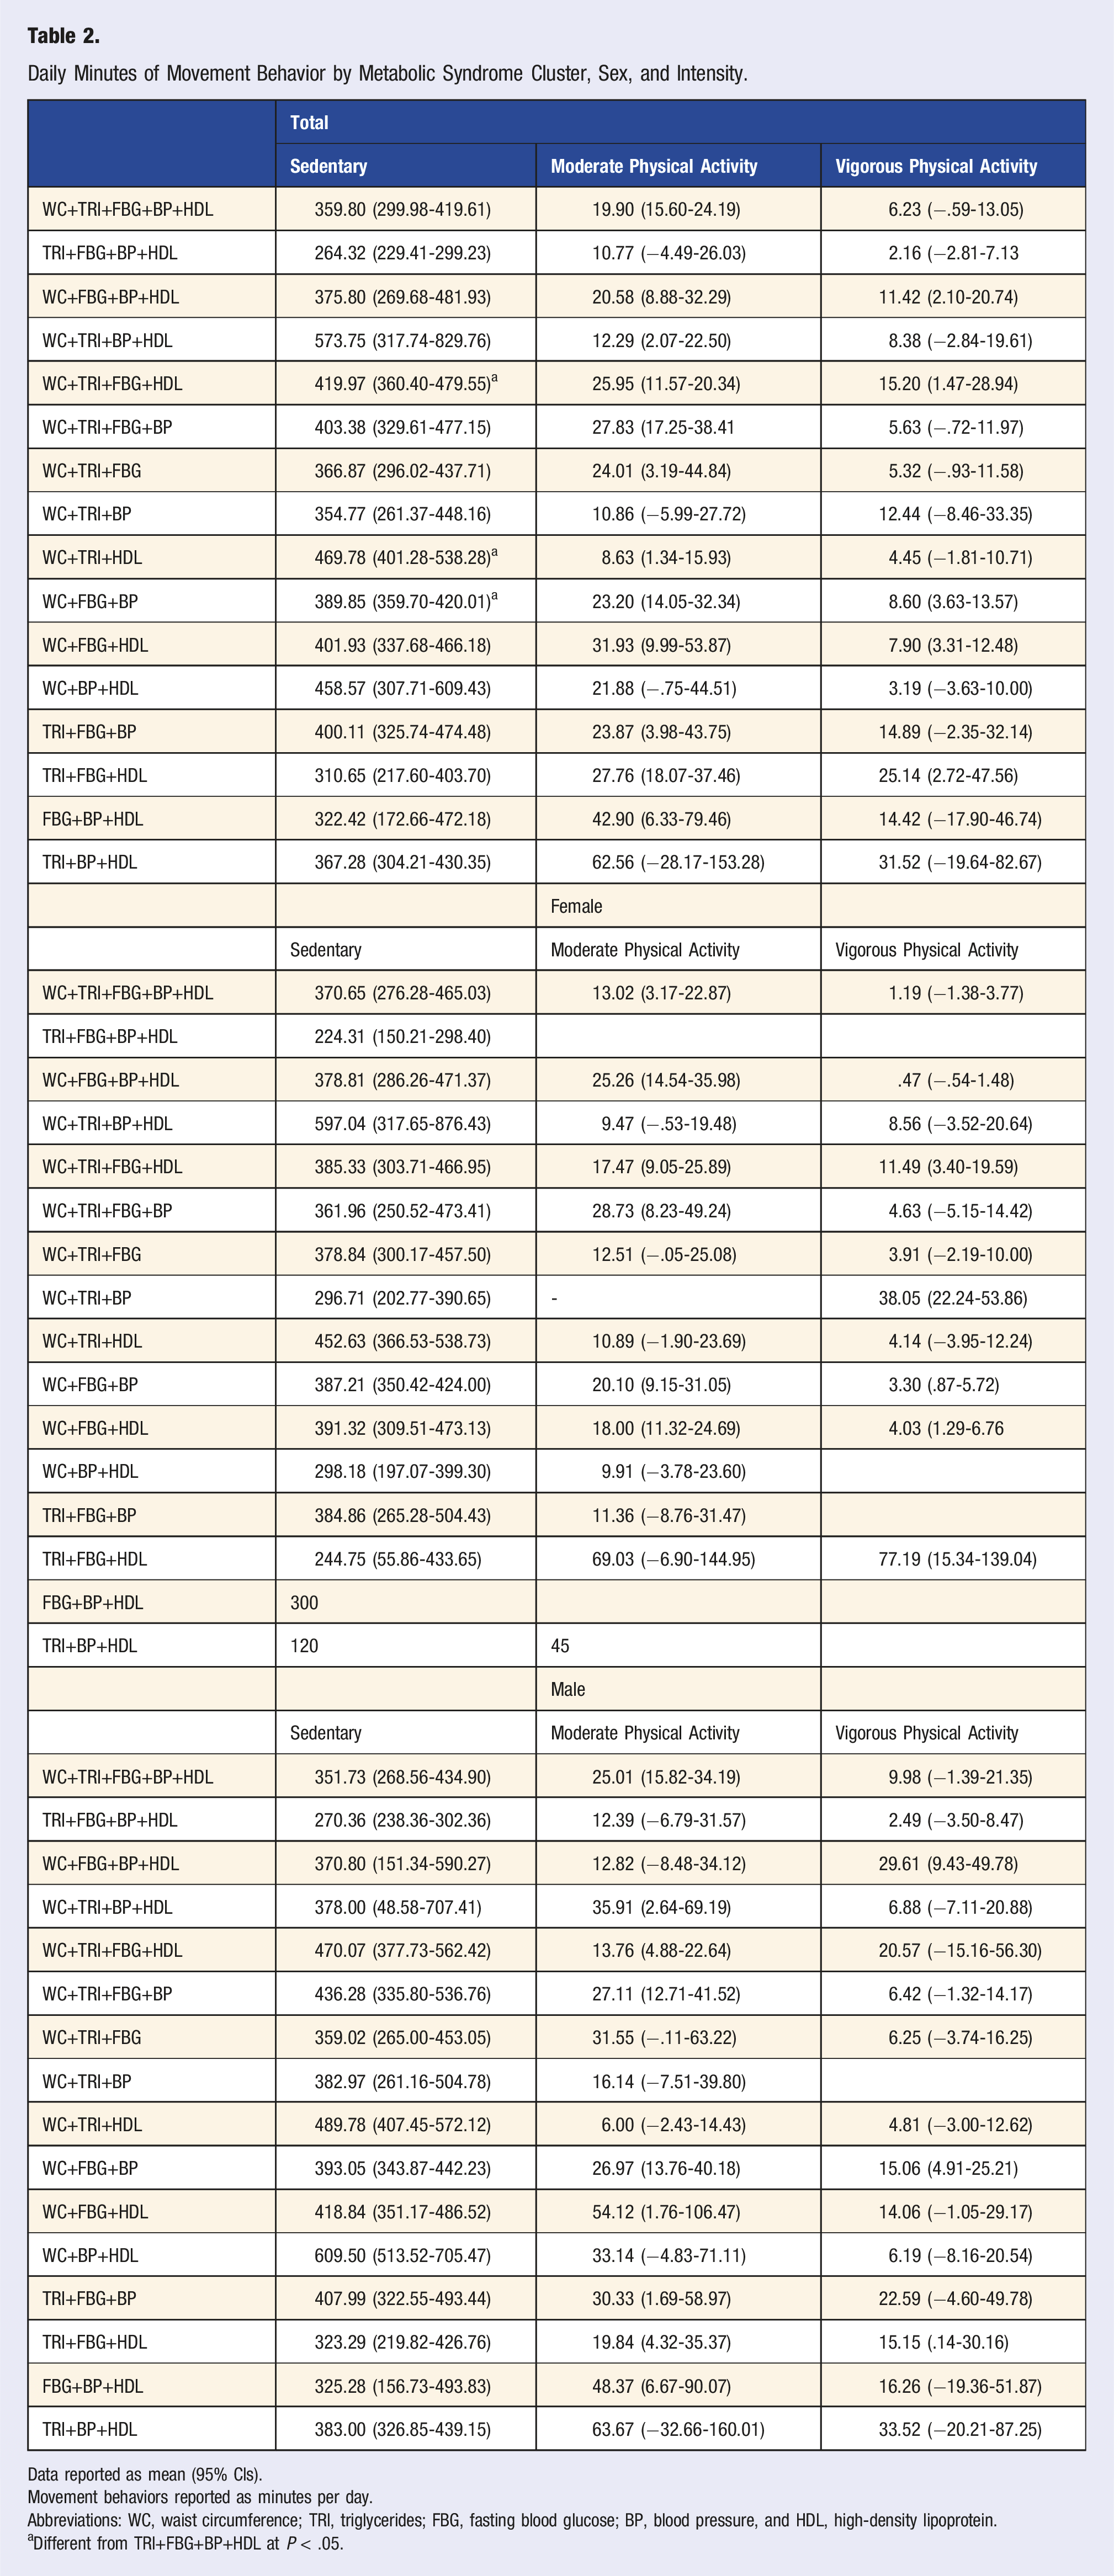
Data reported as mean (95% CIs).
Movement behaviors reported as minutes per day.
Abbreviations: WC, waist circumference; TRI, triglycerides; FBG, fasting blood glucose; BP, blood pressure, and HDL, high-density lipoprotein.
aDifferent from TRI+FBG+BP+HDL at P < .05.
Metabolic Syndrome Severity Differences
Metabolic syndrome severity z-score differences by metabolic syndrome cluster.
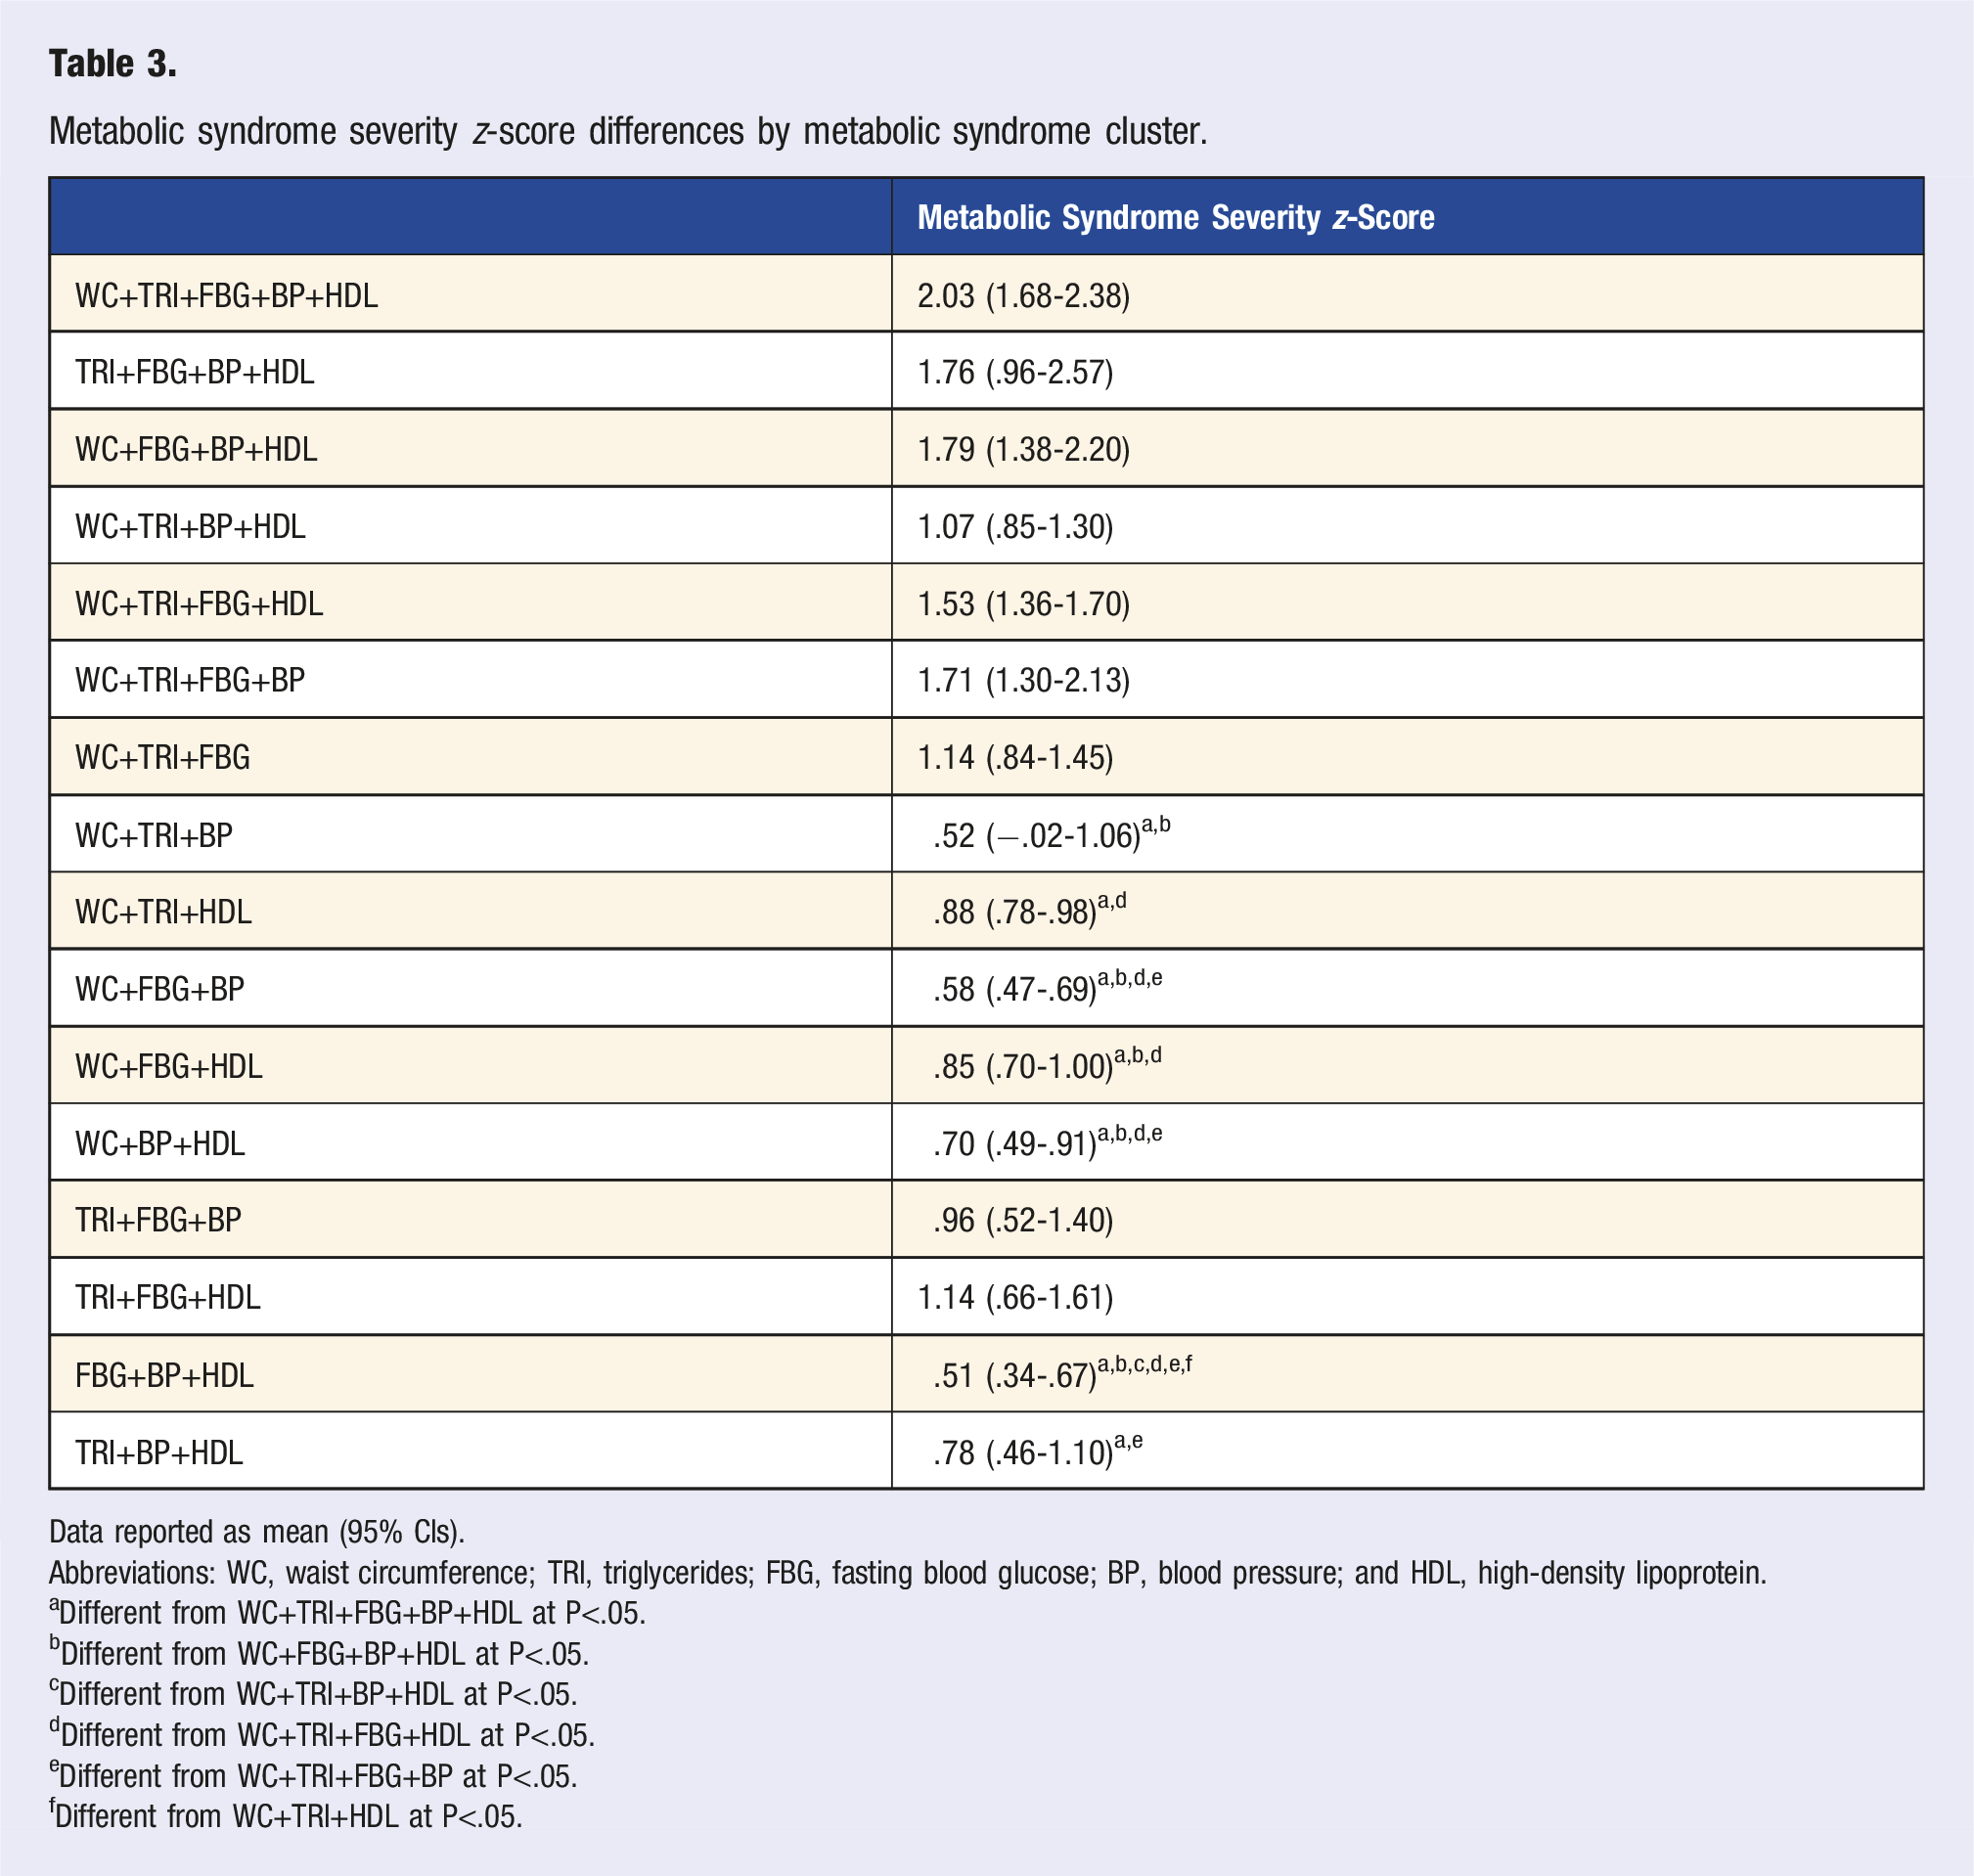
Data reported as mean (95% CIs).
Abbreviations: WC, waist circumference; TRI, triglycerides; FBG, fasting blood glucose; BP, blood pressure; and HDL, high-density lipoprotein.
aDifferent from WC+TRI+FBG+BP+HDL at P<.05.
bDifferent from WC+FBG+BP+HDL at P<.05.
cDifferent from WC+TRI+BP+HDL at P<.05.
dDifferent from WC+TRI+FBG+HDL at P<.05.
eDifferent from WC+TRI+FBG+BP at P<.05.
fDifferent from WC+TRI+HDL at P<.05.
Metabolic Syndrome Severity Z-Score Differences by Sex, Race, and Ethnicity.
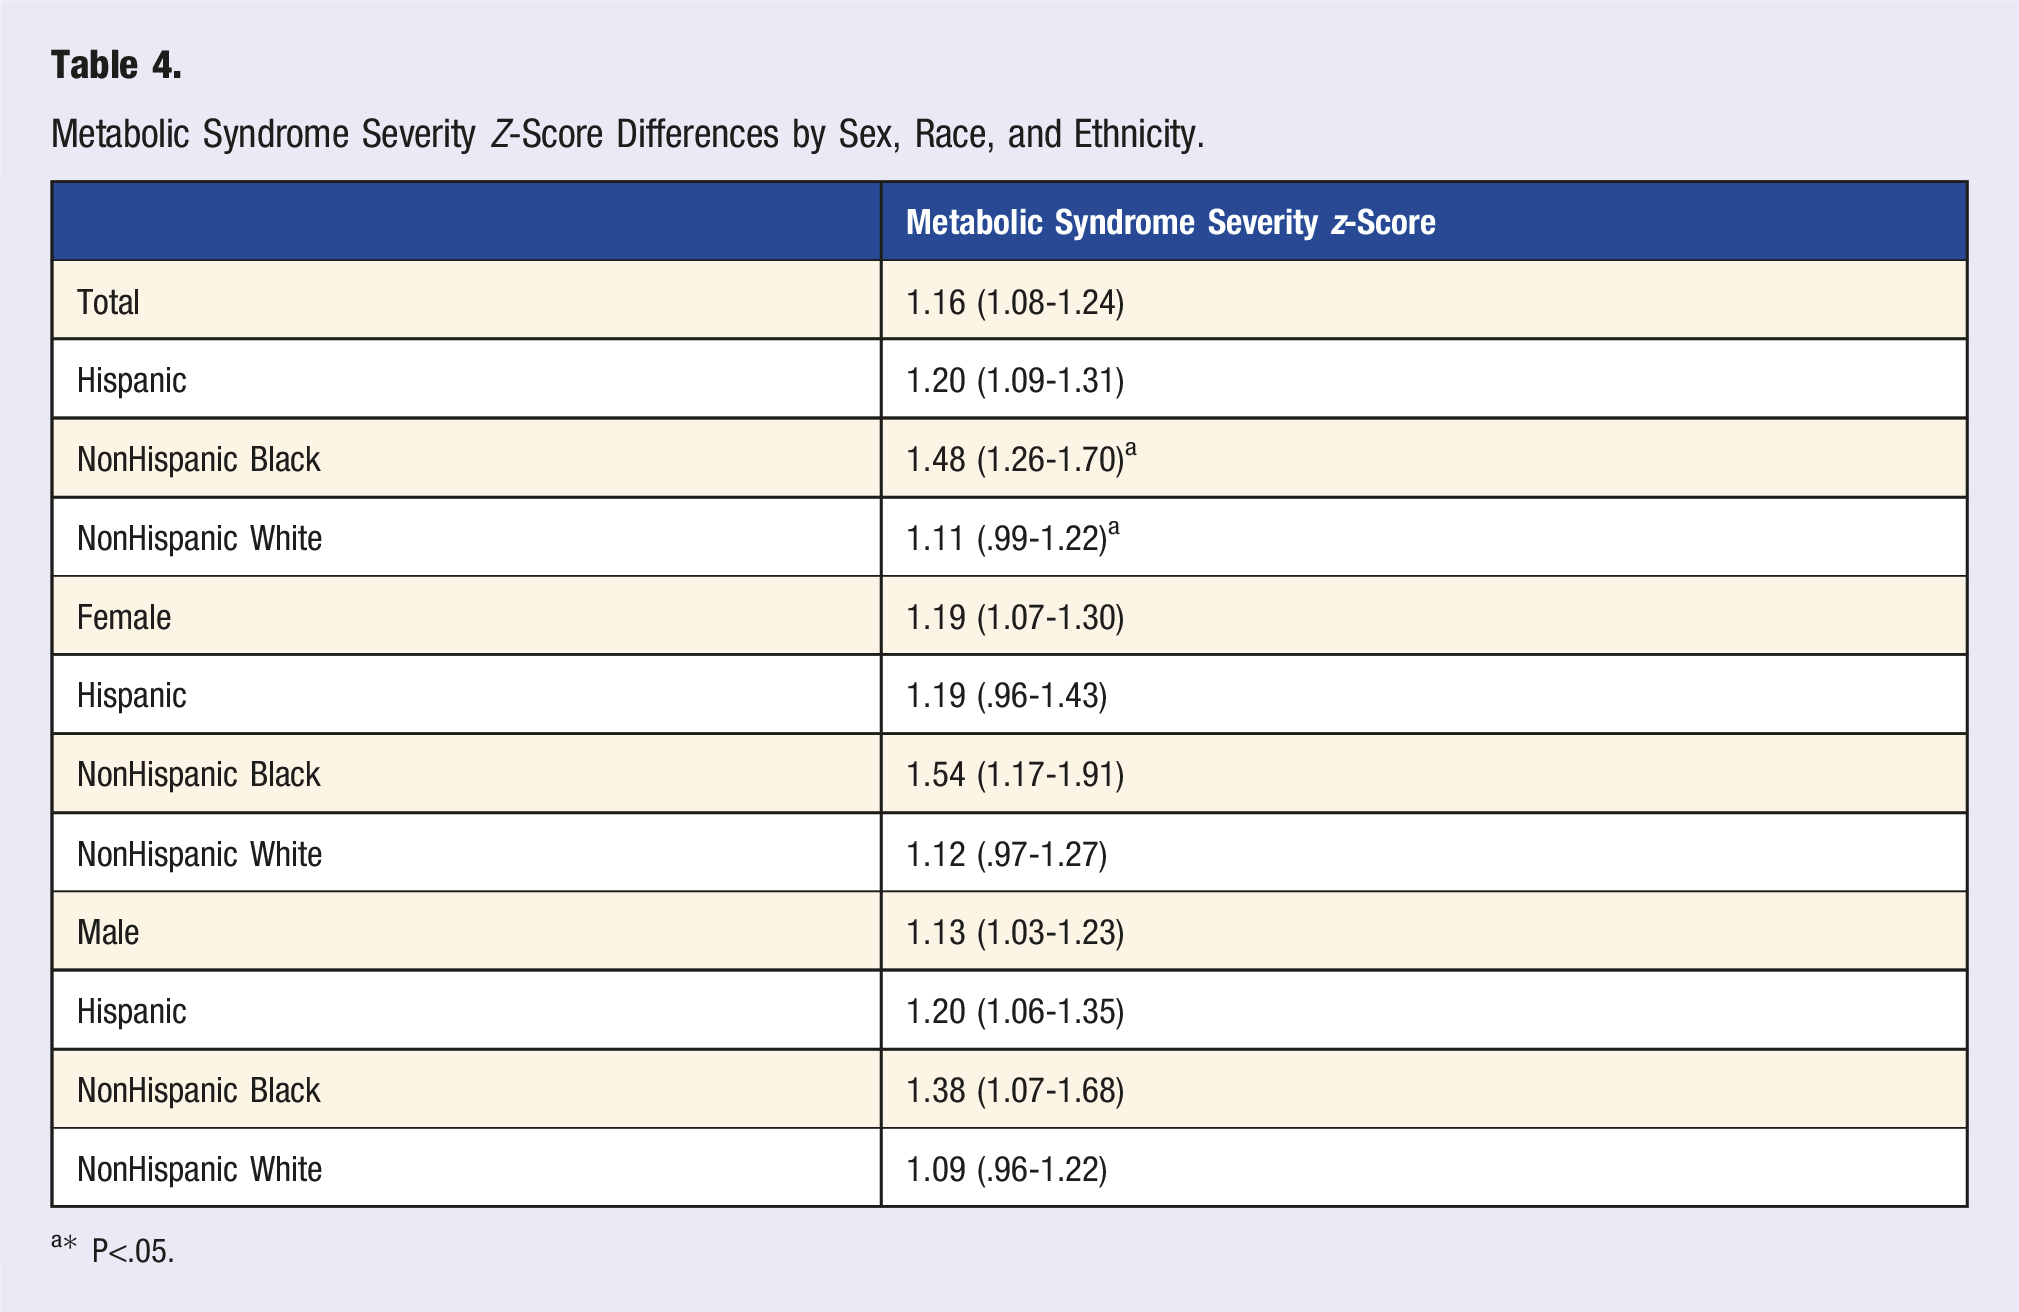
a* P<.05.
Metabolic Syndrome Severity Z-Score Tertial Group Differences by Movement Behavior.
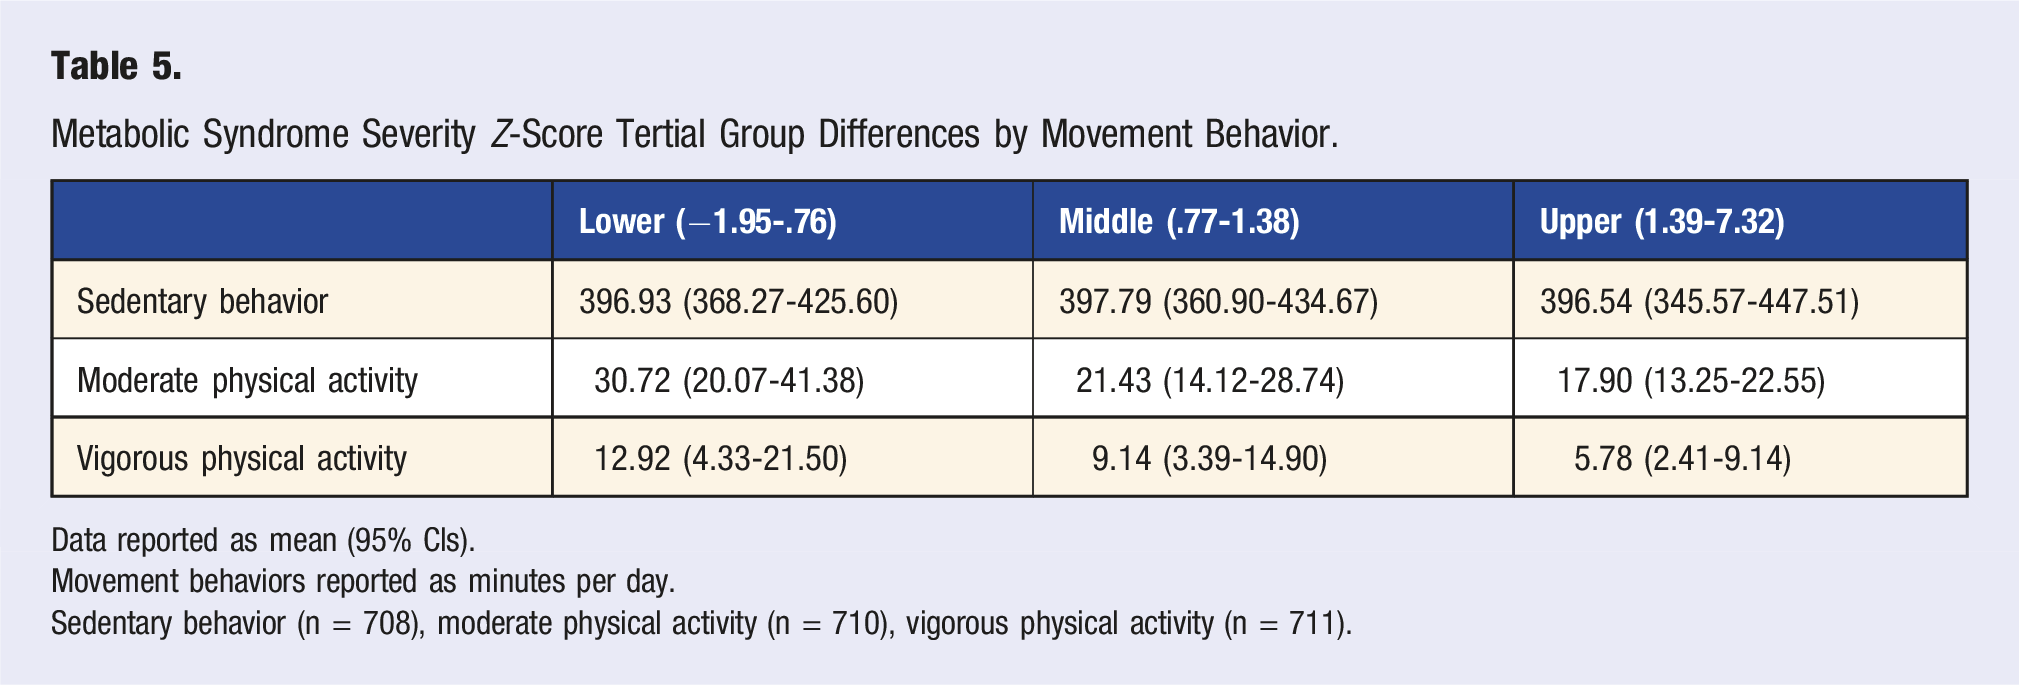
Data reported as mean (95% CIs).
Movement behaviors reported as minutes per day.
Sedentary behavior (n = 708), moderate physical activity (n = 710), vigorous physical activity (n = 711).
Discussion
This investigation sought to consider the prevalence and explore differences in SB, PA, and MetS-Z among the 16 unique MetS clusters and to consider SB and PA differences by MetS-Z tertiles. The primary findings indicate limited within-group differences in movement behaviors among participants with MetS. PA did not differ when examined by MetS cluster nor MetS-Z tertile. SB did differ between multiple MetS clusters with the TRI+FBG+BP+HDL MetS cluster having significantly less SB than WC+TRI+FBG+HDL, WC+TRI+HDL, and WC+FBG+BP MetS clusters. For both MPA and VPA, reported time decreased with greater MetS-Z tertile, or worse risk; however, SB remained consistent across all 3 tertiles. This study also provides insight into the importance of the specific clustering of individual MetS variables as well as the more recently developed MetS-Z. These contemporary techniques for examining MetS provide a more detailed assessment of cardiometabolic disease risk, which is especially useful for clinicians to track the magnitude of risk longitudinally.
The most prevalent MetS cluster was WC+FBG+BP, which has previously been associated with increased arterial stiffness measured using pulse wave velocity, 30 which is an index of cardiovascular health.31,32 Using pulse wave velocity, Scuteri and colleagues observed the WC+FBG+BP MetS cluster as 1 of 3 clusters to be associated with greater arterial stiffness. 30 Similarly, Lopes-Vicente et al observed the overall number of positive criteria (i.e., 3 vs 4) was associated with worsening arterial stiffness among middle-aged individuals and was further moderated by systolic BP and TRI. 32 While BP is strongly associated with arterial stiffness, Scuteri and Lopes-Vincente differed in the other specific individual criterion to have the greatest strength of association (i.e., WC and FBG vs TRI). Findings of different MetS criteria to be greater associated with arterial stiffness may be explained by the varying ages of the participants of each study. However, determination of the pathological processes of MetS, and individual criteria, at various stages of life are beyond the scope of this study.
The five-criteria MetS cluster had the overall greatest MetS-Z, although surprising, there were no differences in MetS-Z between the five-criteria and any four-criteria MetS clusters. Contrastingly, several three-criteria clusters had significantly lower MetS-Z than four- or five-criteria clusters implying the development of any fourth MetS criteria to have a more deleterious impact on cardiometabolic health than the development of the final MetS criteria. These considerations are imperative in the innovation of more individualized and effective treatment strategies for clinicians, as MetS-Z conveys the ability to track fluctuations in MetS severity over time. 6
The present study observed a substantially heightened MetS-Z 1.16 (1.08-1.24), which is problematic for developing T2DM and CVD, and indicative of underlying endocrinological malady. 33 Further, the present study substantiates previous findings of MetS-Z addressing the racial MetS paradox, as Non-Hispanic Black participants (1.48 [1.26-1.70]) had a significantly higher MetS-Z compared with Non-Hispanic White participants (1.11 [.99-1.22]). Examining 10-year changes in MetS among ARIC study participants, Vishnu, Gurka, and DeBoer found MetS (dichotomous classification) prevalence to increase 17% 34 ; whereas, when examining MetS-Z by sex-, race-, and ethnicity-subgroups, Non-Hispanic Black women had greater MetS-Z values at baseline and a more severe worsening of MetS-Z than either Non-Hispanic Black and White males. 34 Gurka and colleagues, examining baseline and 20-years of follow-up data from the Atherosclerosis Risk in Communities (ARIC) Study, observed that as MetS-Z increased odds of isolated T2DM and CVD increased by 5.10 and 1.77, respectively. 6 Furthermore, the odds of developing T2DM leading to CVD were 6.99 for each increasing unit in MetS-Z. 6 Researchers examining T2DM and CVD with the use of the MetS-Z have observed a higher MetS-Z predisposes individuals to the development of T2DM and CVD later in life.6,35 MetS-Z does not require any of the 5 MetS criteria to be positive to use, allowing clinicians to track the risk of cardiometabolic maladies before the development of MetS adding to the longitudinal utility. It has been suggested for clinicians to adopt the use of MetS-Z as part of the electronic health record to tracking MetS severity over time.14,36
No significant differences in SB or PA were observed between MetS-Z tertiles. The absence of differences infers these variables play a crucial role in developing or maintaining MetS-Z among adults.37,38 Regarding SB, 3 MetS clusters which included WC were found to have more SB than the only non-WC four-criteria MetS cluster. A recent meta-analysis revealed that each 10 cm increment in WC was associated with an 11% higher risk of all-cause mortality. 39 As SB and PA are 2 of the most important factors for improving and maintaining health,8,16,20 it is imperative to understand how these behaviors differ within diverse groups like MetS. The lack of difference in SB and PA is corroborated by findings from Bankoski and colleagues who observed SB and PA were independently related to the likelihood of developing MetS. 19 Further, Clarke and Janssen observed 10 minutes of VPA or 20 minutes of MPA reduced the odds of MetS by 10%, regardless if the PA was sporadic or in bouts (≥10 minutes). 40 A specific threshold regarding the duration and frequency of SB for health has yet to be determined.26,41 However, time spent in SB should be limited and replaced with PA, of any intensity, when possible. 41
To our knowledge, this is the first study to examine SB and PA differences between MetS clusters and MetS-Z tertiles. This study should be considered in conjunction with apparent limitations. Although this study was strengthened by the use of a nationally representative sample, the cross-sectional design prohibits inference of causality. Data were self-reported for both SB and PA yielding to the potential for self-report bias of desired behaviors. 42 Further, we only examined leisure-time PA excluding occupational-based PA, which is a CVD risk factor. 43
Conclusion
This study found PA did not differ between MetS clusters and SB did not differ between MetS clusters nor MetS-Z tertiles. The use of 2 contemporary methods for investigating MetS allows for a within-group examination not possible using the traditional dichotomous classification. The clinical utility of the MetS-Z 44 can be used in conjunction with Exercise Is Medicine, an initiative managed by the American College of Sports Medicine advocating for the inclusion of PA as an element of clinical care, 45 allowing health care providers to design treatment plans which include restricting SB and promoting of PA to reduce MetS-Z. One may see the additional benefit by reducing time spent in SB with a commensurate increase in the duration of PA, with greater benefits conveyed with MVPA than light-intensity PA. 46 All adults should undertake 150–300 minutes of MPA, or 75–150 minutes of VPA, or some equivalent combination of MVPA of aerobic physical activity per week. 41
Footnotes
Declaration of Conflicting Interests
The author(s) declared no potential conflicts of interest with respect to the research, authorship, and/or publication of this article.
Funding
The author(s) disclosed receipt of the following financial support for the research, authorship, and/or publication of this article: This study is supported by RB was provided by grant funding from the National Heart, Lung, and Blood Institute (T32HL069771-18). Support for RJ was provided by grant funding from the National Center for Medical Rehabilitation Research (T32HD071886).