
Abstract
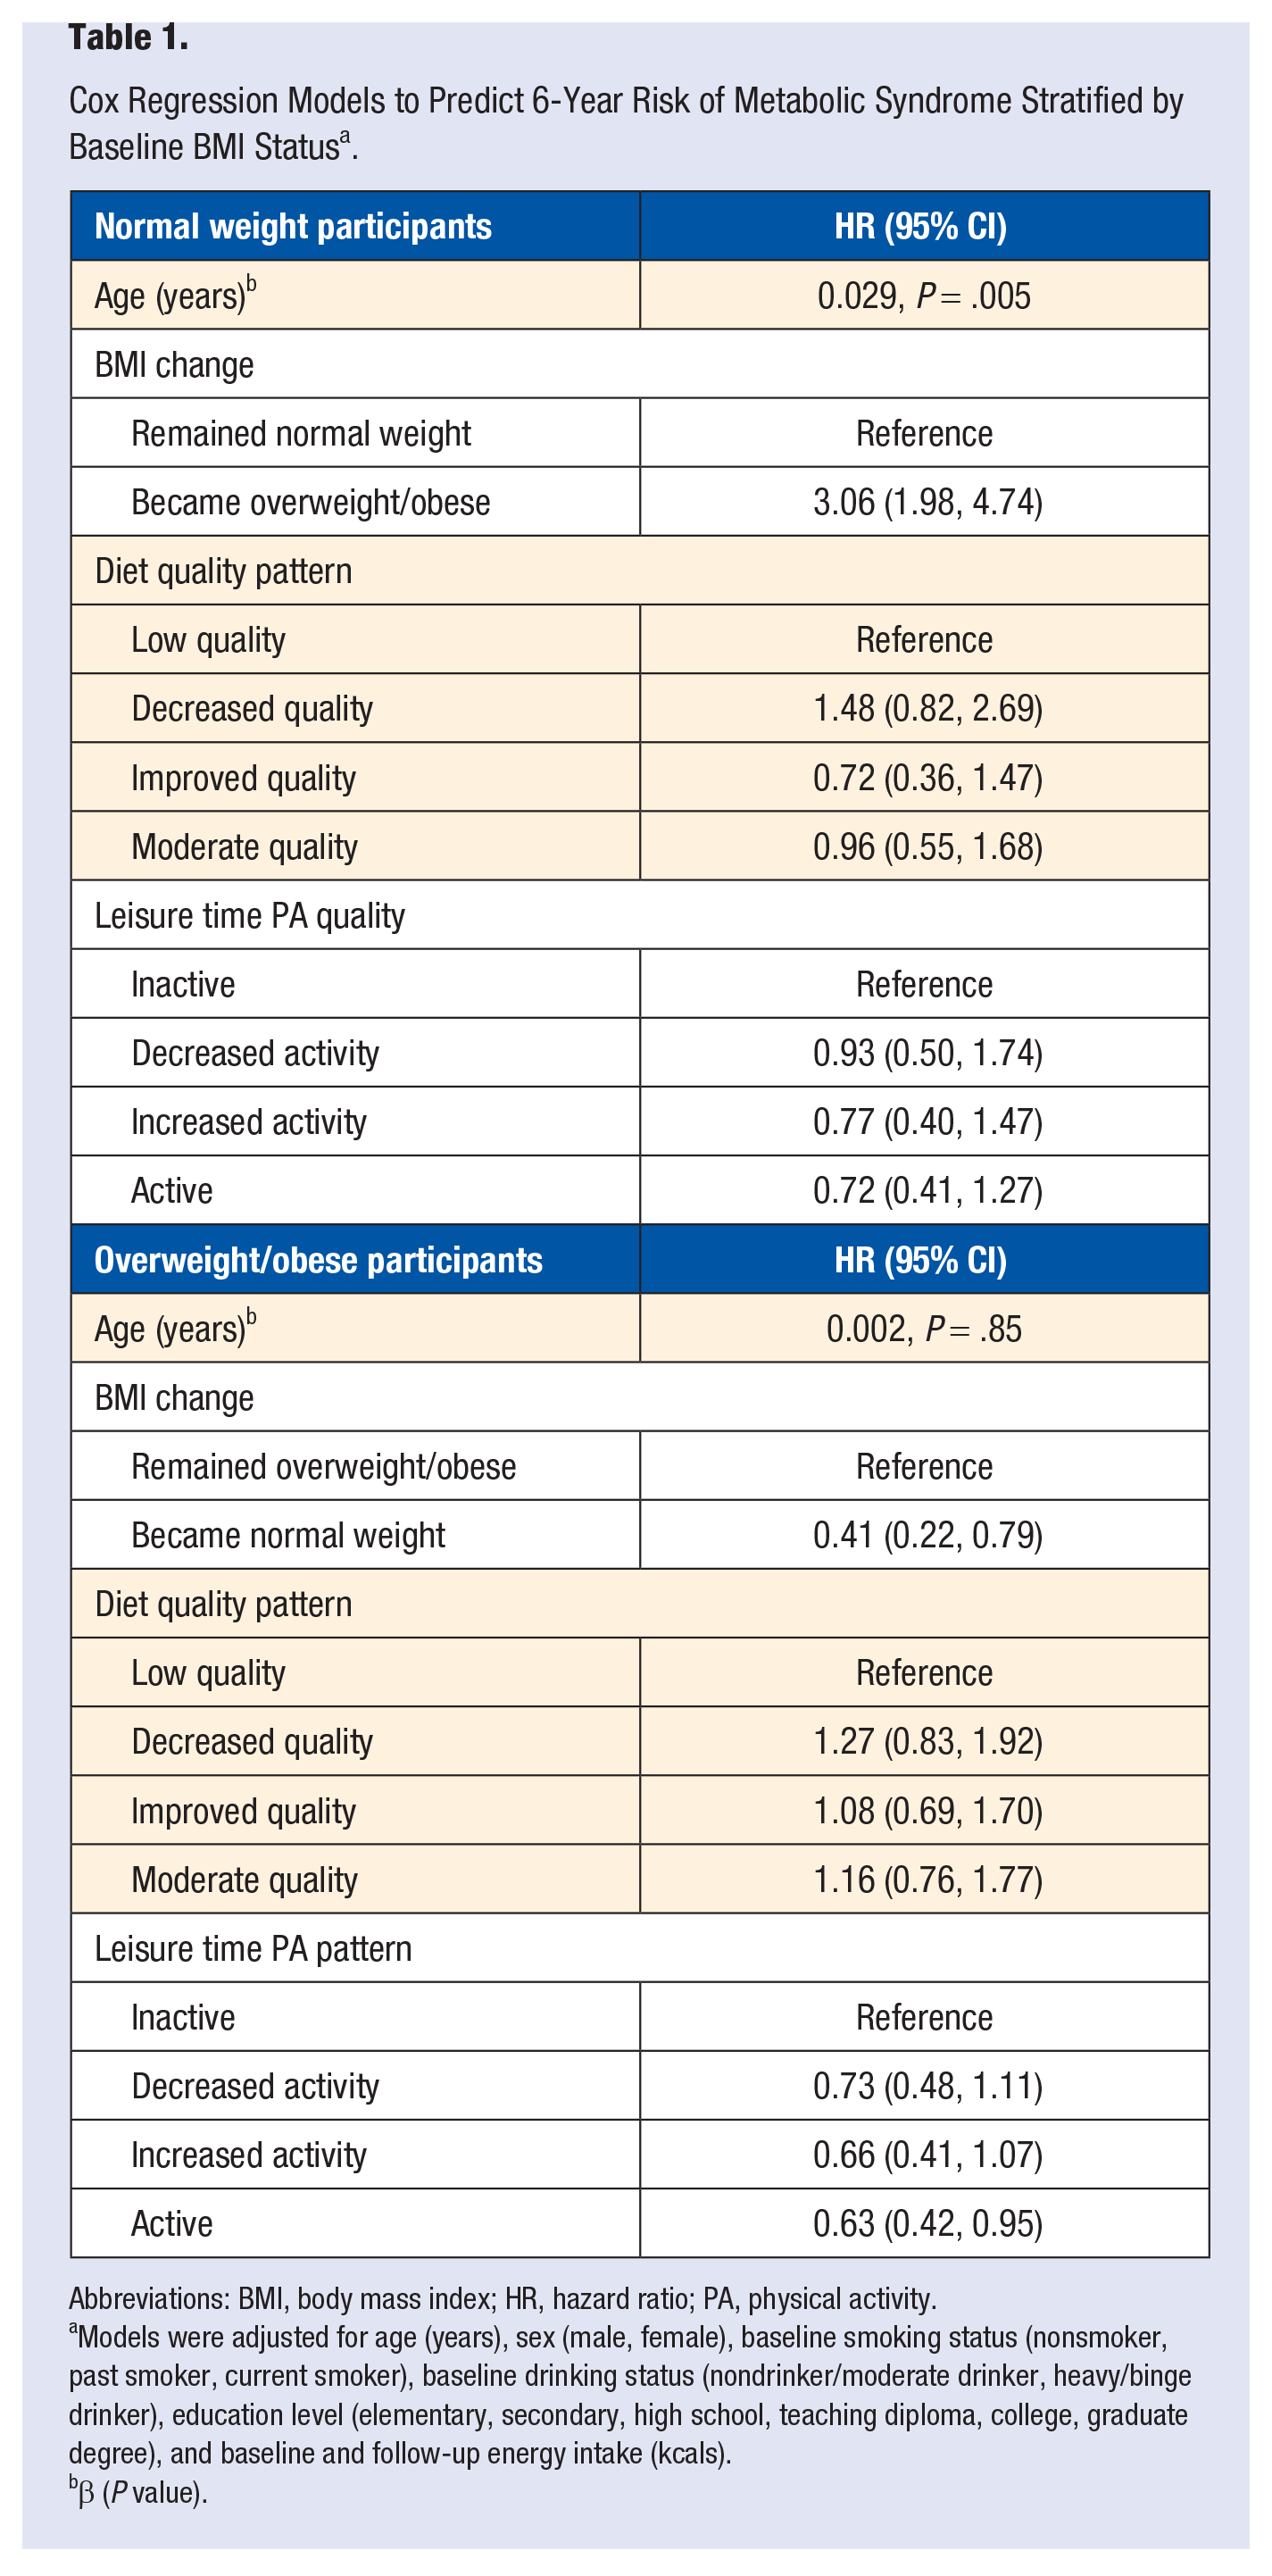
Background. Among lifestyle factors, obesity has been postulated as the most important risk factor for metabolic syndrome (MS). Lifestyle factors such as physical activity (PA), diet quality, and weight management are so closely related, it is not clear if the role of lifestyle factors is exclusively through its effect on weight, or if they contribute independently. Objective. To examine the effect of lifestyle factors such as diet quality, weight change, and leisure time PA on MS occurrence in lean and overweight/obese (OW/OB) adults over a 6-year period. Methods. This was a longitudinal analysis of data from adults participating in the Health Workers Cohort Study. Results. A total of 1046 participants were included; 37.2% of the OW/OB group and 16.2% of the lean participants developed MS. Becoming overweight had a hazard ratio (HR) of 3.06 for developing MS compared with remaining lean (95% CI = 1.98, 4.74). Going from OW/OB to lean was associated with lower risk of MS (HR = 0.41; 95% CI = 0.22, 0.79). Among OW/OB, becoming active was associated with lower risk (HR = 0.63; 95% CI = 0.42, 0.95) in comparison with an inactive pattern; diet quality was not associated with occurrence of MS. Conclusion. Weight change was the most relevant factor predicting MS over a 6-year period.
‘Even though obesity has been postulated to be the most important risk factor for MS,
7
other lifestyle factors have been associated with increased odds of MS and its components.’
Introduction
Metabolic syndrome (MS) is a cluster of metabolic risk factors for cardiovascular diseases and type 2 diabetes mellitus (T2DM). 1 It affects more than 20% of the population in the United States and at least 36% in Mexico.2,3 One generally accepted definition of MS is from the National Cholesterol Education Program/Adult Treatment Panel,4,5 which defines it as having 3 or more of the following 5 dichotomized risk factors: abdominal obesity, hypertriglyceridemia, low high-density lipoprotein cholesterol (HDL-C), high blood pressure or receiving drug treatment, and high fasting plasma glucose. It is estimated that the population-attributable fraction for MS is approximately 6% to 7% for all-cause mortality, 12% to 17% for cardiovascular disease, and 30% to 52% for diabetes. 6
Even though obesity has been postulated to be the most important risk factor for MS, 7 other lifestyle factors have been associated with increased odds of MS and its components. Among them are high-carbohydrate diets, physical inactivity, gaining weight, alcohol consumption, and current smoking to mention some.8-16
Because lifestyle factors such as physical activity (PA), diet quality, and weight management are so closely related, it is not clear if the role of diet and PA is exclusively through their effect on weight or if they contribute to the development of MS independently. Given that some lean individuals (9%-13%) have MS,3,17 it is reasonable to hypothesize that excess weight is not its only cause and that certain aspects of diet and PA might have additional effects to those associated with excess weight.
Therefore, the aim of this study was to examine the effect of lifestyle factors such as diet quality, weight change, and leisure time physical activity (LTPA)on MS occurrence in lean and overweight/obese (OW/OB) adults over a 6-year period.
Methods
Study Population
We performed a longitudinal analysis of data from adults participating in the Health Workers Cohort Study; the specifics of the baseline study design, methodology, and participant characteristics have been detailed elsewhere. 18 Briefly, workers from 2 different health and academic institutions in Morelos and the State of Mexico in Mexico were invited to participate in this cohort study focusing on lifestyle and chronic diseases. Baseline measurement took place in 2004-2006, and the follow-up measurement took place in 2010-2012. A total of 1716 adults participated in the follow-up study. We excluded participants with the following conditions at baseline: hypertension, type 2 diabetes, and MS (n = 543) defined as having ≥3of the MS components: central obesity, waist circumference ≥102 cm in men and ≥88 cm in women, high serum triglycerides (TG; ≥150 mg/dL or ≥1.695 mmol/L), low HDL-C (≤40 mg/dL or ≤1.036 mmol/L in men and ≤50 mg/dL or ≤1.295 mmol/L in women), high blood pressure (systolic blood pressure ≥130 mm Hg, diastolic blood pressure ≥85 mm Hg), and high fasting glucose (≥100 mg/dL or ≥5.6 mmol/L). 4 Other exclusion criteria were taking medications that would affect serum lipoprotein concentrations, blood pressure, and carbohydrate metabolism (n = 84), and history of any type of cancer, chronic kidney failure, gout, bone fracture in the past year (n = 31) and weight loss ≥10 kg in the last year (n = 12), leaving a total of 1046 participants for the present analysis of whom 557 were lean and 489 were overweight or obese at baseline (Figure 1). The rationale for not including participants with bone fracture in the past year is because it can modify PA, and the reason for not including those with a weight loss ≥10 kg is because it is most likely that such an important weight loss is associated with health problems rather than lifestyle behaviors.
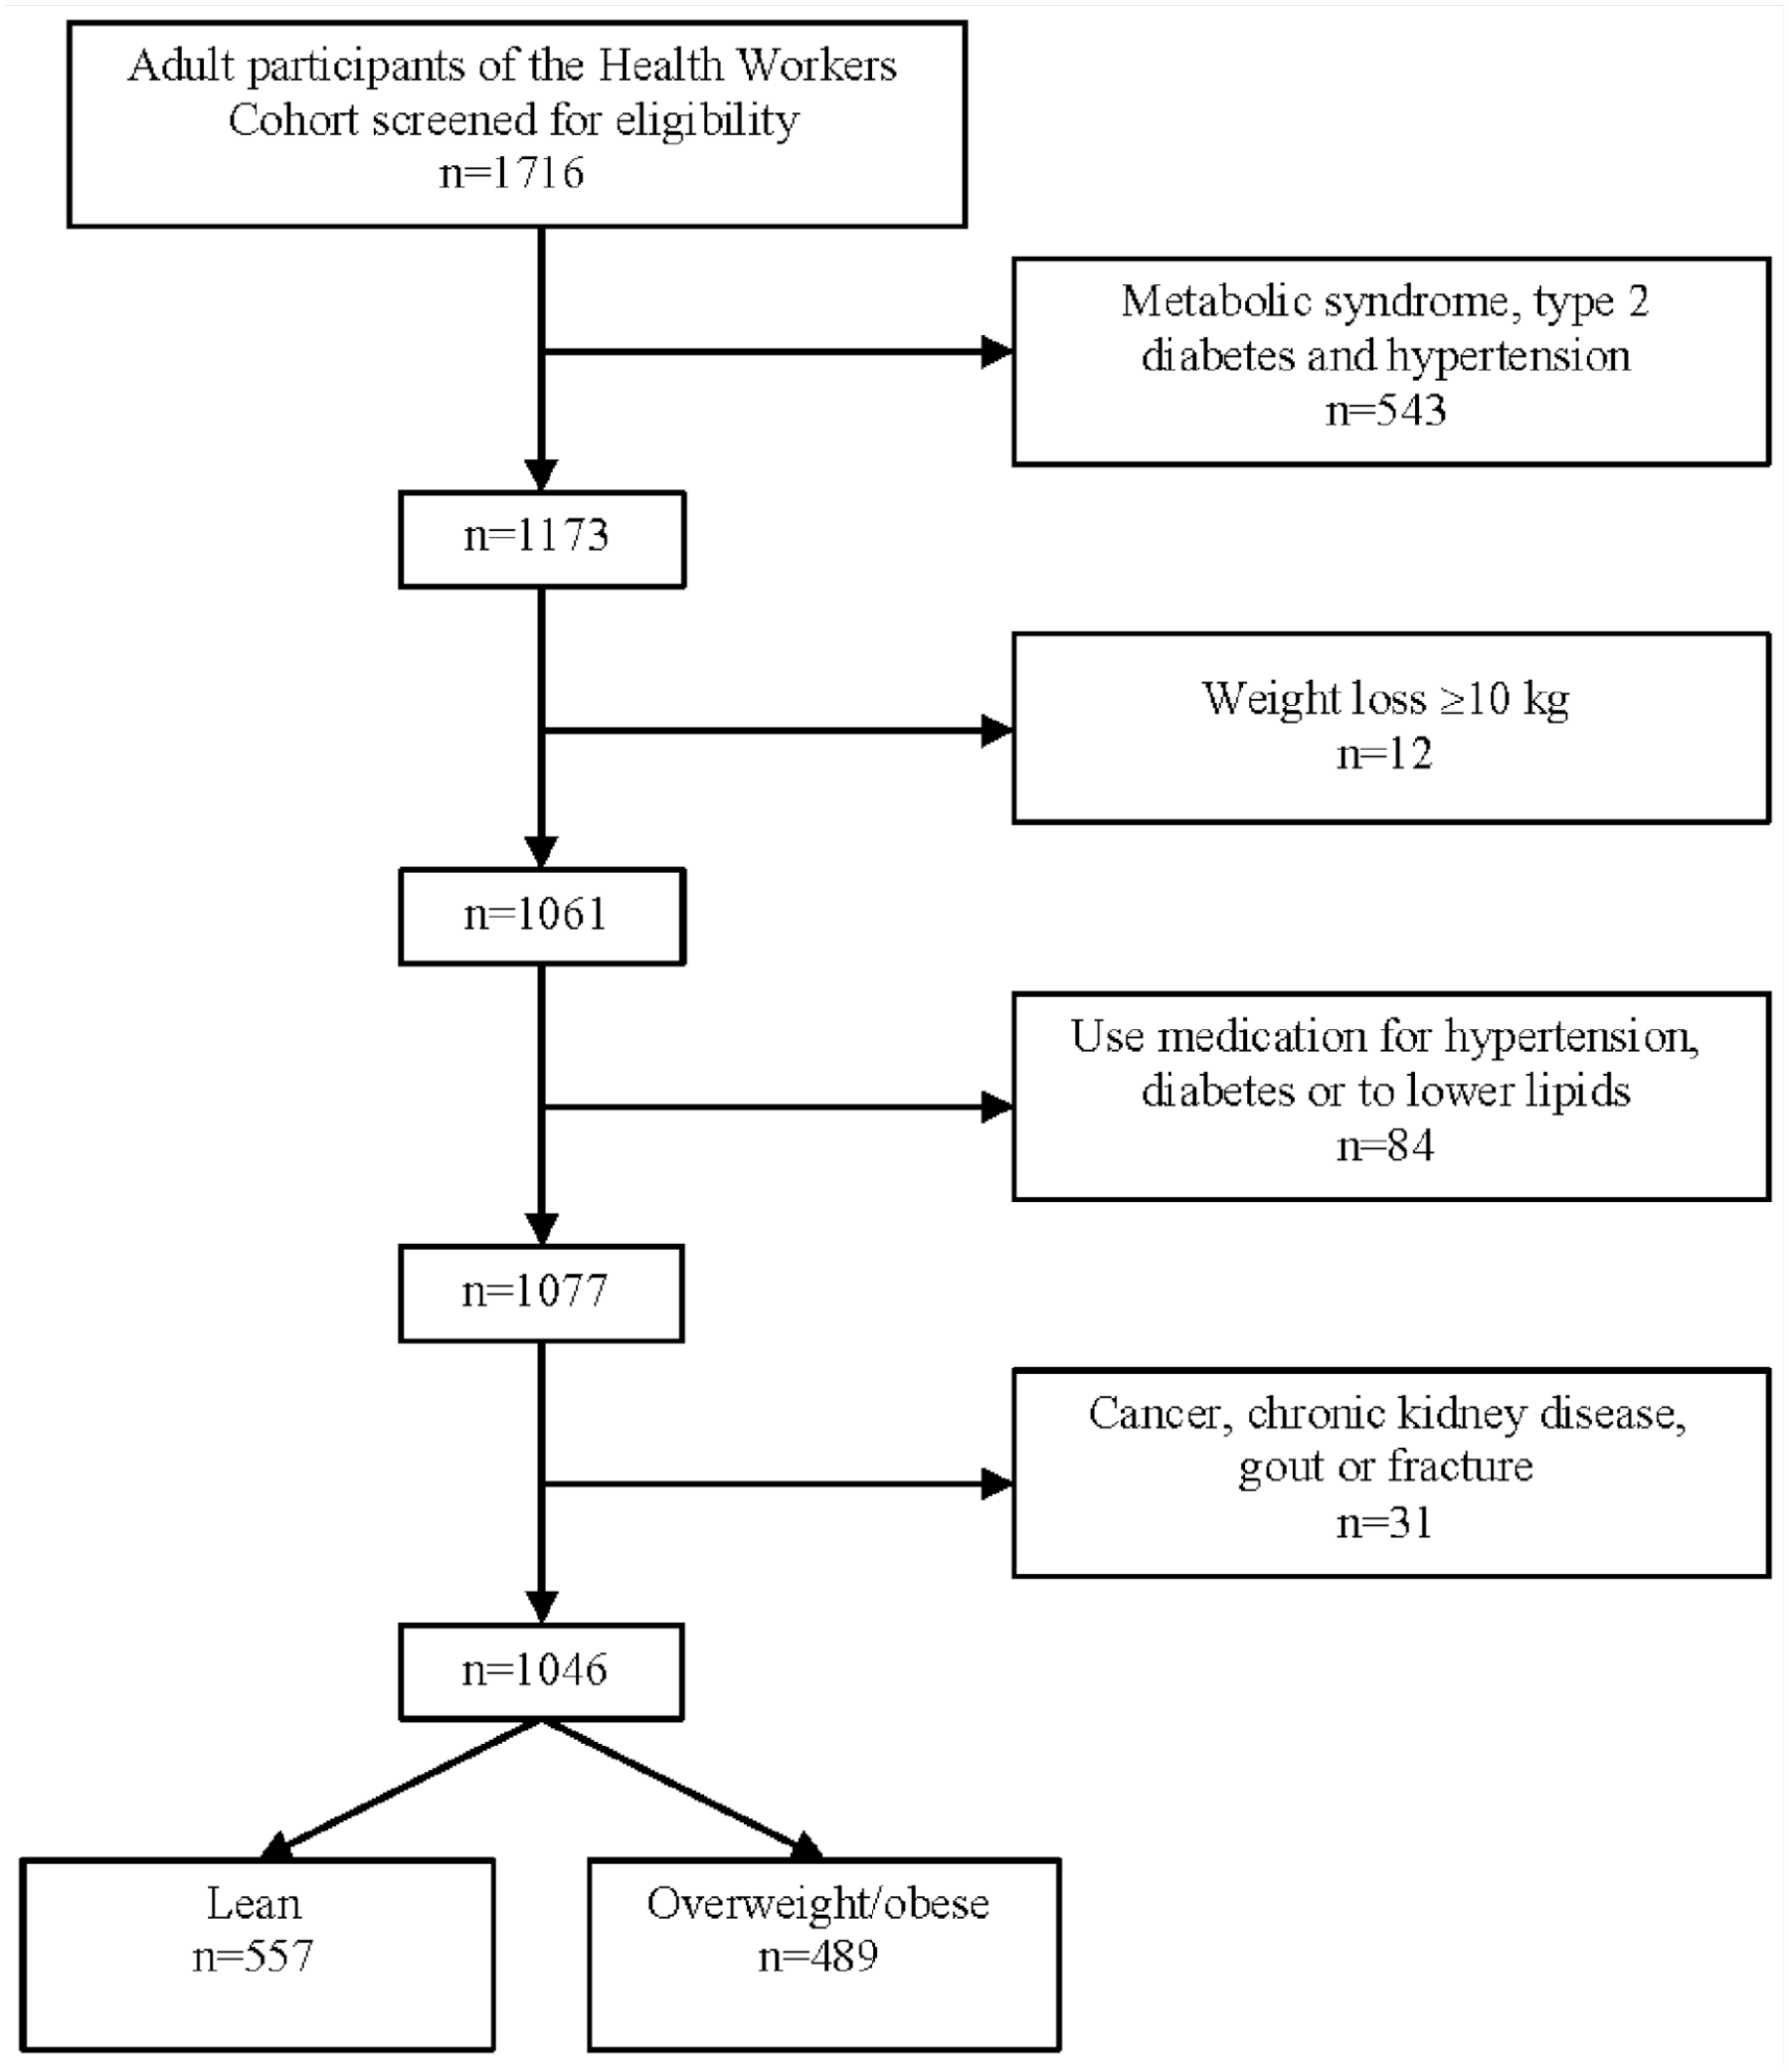
Flow diagram of participant selection.
The ethics committees of all participating institutions reviewed and approved the study protocol at both stages, and written informed consent was obtained from all participants at baseline and again at the follow-up measurement.
The ethics committees of all participating institutions reviewed and approved the study protocol at both stages, and written informed consent was obtained from all participants at baseline and again at the follow-up measurement.
Physical Activity Assessment
The PA level of participants was assessed at baseline and at follow-up using a self-administered questionnaire that was applied in similar follow-up studies. 19 The questionnaire is validated in Spanish 20 and has been adapted for use in the Mexican population. 21 The questionnaire estimates the minutes spent practicing different LTPAs (including walking, running, cycling, aerobics, dancing, and swimming as well as playing football, volleyball, basket-ball, tennis, fronton, baseball, softball, and squash, among other activities). Each item includes time intervals that allow participants to detail the exact number of minutes or hours they dedicate to each one as well as the intensity (light, moderate, vigorous). The total duration of each activity was expressed in minutes per day. We calculated the number of hours per week devoted to each activity, which were then multiplied by the intensity of each activity, defined as multiples of the metabolic equivalent (MET) of sitting quietly. We used the Compendium of Physical Activities to assign METs to each activity. 22 We then added the average weekly energy expenditure attributable to each activity to derive the total MET hours per week.
We calculated the median time spent performing LTPA at baseline and at follow-up in order to classify participants into 1 of the following trajectories: (1) inactive (below median at both time-points), (2) decreased PA (equal to or above median at baseline and below median at follow-up), (3) increased activity (below median at baseline and equal to or above median at follow-up), and (4) active (equal to or above median at both time points).
Diet Quality Assessment
Diet was assessed at baseline and at follow-up using a self-administered semiquantitative food frequency questionnaire (FFQ) validated in a Mexican population. 23 The questionnaire included data on frequency of consumption of 116 food items during the previous year. For each food, a commonly used portion size (eg, 1 slice of bread or 1 cup of coffee) was specified on the FFQ, and participants were asked how frequently they had consumed each specific food over the previous year. Participants chose from 10 possible responses, ranging from “never” to “6 or more times per day.” The reported frequency for each food item was converted into daily intake. Total daily energy and nutrient intake was computed by multiplying the frequency of intake for each food by its nutrient content and adding energy and nutrient contributions across all food items. Diet quality was assessed using the Alternative Healthy Eating Index 2010 (AHEI-2010), 24 which is based on foods and nutrients predictive of chronic disease risk. The highest score possible (110 points) is associated with lower risk of major chronic disease, whereas the lowest score possible (0 points) is associated with greater risk of major chronic disease. Food groups and nutrients included in the index are vegetables, fruits, whole grains, sugar-sweetened beverages, nuts, legumes and vegetable proteins, red meat and processed meats, trans-isomers of fatty acids, long-chain (n-3) fats (eicosapentaenoic acid + docosahexaenoic acid), polyunsaturated fatty acids, sodium, and alcohol. 24 After computing each participant’s AHEI-2010 score at baseline and follow-up, we classified them into 1 of 4 groups: (1) low quality (<55 points at both time points), (2) decreased quality (≥55 points at baseline and <55 points at follow-up), (3) increased quality (<55 points at baseline and ≥55 points at follow-up), and (4) moderate quality (≥55 points at both time points).The cutoff value of 55 points was selected for being the median value on the AHEI-2010 score scale, which ranges from 0 to 110 points.
Anthropometric and Clinical Assessment
Weight was measured in duplicate with a previously calibrated electronic TANITA scale (model BC-533) while participants were barefoot and wearing minimal clothing. Height was obtained in duplicate by using a conventional stadiometer while the participants were standing barefoot with their shoulders in a normal position. Body mass index (BMI; kg/m2) was obtained from standardized measurements of weight and height and was computed as a ratio of weight (kg) to height squared (m2). In the present study, being OW/OB was defined as having a BMI ≥25 kg/m2. Waist circumference was measured at the high point of the iliac crest at the end of normal expiration to the nearest 0.1 cm. All measurements were performed by nurses trained to use standardized procedures, and reproducibility was evaluated, resulting in concordance coefficients between 0.83 and 0.90.
A fasting venous blood sample was collected from each participant; a fasting time of ≥8 hours was used for all assays. Plasma glucose was measured with the enzymatic colorimetric method by using glucose oxidize; serum TG concentrations were assayed with a colorimetric method following enzymatic hydrolysis by lipase, and serum HDL-C was measured by the clearance method. All biomedical assays were performed with a Selectra XL instrument (Randox) in concordance with the proceedings of the International Federation of Clinical Chemistry and Laboratory Medicine. 25 Trained nurses measured blood pressure with an automatic digital blood pressure monitor while participants were seated with their right arm resting at heart level.
Assessment of MS Occurrence
All participants were free of MS at baseline, and occurrence of MS was defined as having ≥3 of the MS components at the follow-up visit: central obesity, waist circumference 102 cm in men and 88 cm in women, high TG (≥150 mg/dL or ≥1.695 mmol/L), low HDL-C (≥40 mg/dL or ≥1.036 mmol/L in men and ≥50 mg/dL or ≥1.295 mmol/L in women), high blood pressure (systolic blood pressure ≥130 mm Hg, diastolic blood pressure >85 mm Hg), and high fasting glucose (≥100 mg/dL or ≥5.6 mmol/L). 4
Covariate Assessment
The following sociodemographic and health data were collected using a self-administered questionnaire: sex, age, education level, tobacco use, energy intake, and alcohol consumption. Participants were also asked about previous medical diagnoses of chronic conditions, such as arthritis, asthma, bronchitis, cirrhosis, diabetes, cardiovascular disease, hypertension, cancer, and chronic renal insufficiency; if they experienced weight loss in the previous year; and if they experienced mobility issues that impeded daily life activities. Additional information regarding menopausal status, estrogen use, medical history, and use of medications was obtained also from the self-administered questionnaires.
Statistical Analysis
All results presented are stratified by baseline BMI status for lean and OW/OB participants. Data were analyzed using SPSS version 22.0 (SPSS, Inc, Chicago, IL). We performed a descriptive analysis for all variables; if there was ≤5% of missing data, we imputed the mean or median value for continuous variables depending on the distribution and mode for dichotomous variables. Distribution of variables was assessed with the Kolmogorov-Smirnov test. We used means and SDs for normally distributed continuous variables, medians and 25th and 75th quartiles for nonnormally distributed continuous variables, and frequencies and percentages for categorical variables. A Cox regression model (Table 1) was used to examine the association between lifestyle characteristics and the presence of MS at the second visit of the study; time-to-event variable was follow-up time, which was computed by subtracting the date of follow-up measurement minus the date of the baseline measurement, which in all cases was about 6 years. The variables that comprised lifestyle were the following: (1) change of BMI category (remained or changed category), (2) PA pattern (inactive, decreased activity, increased activity, or active), and (3) diet quality pattern (low quality, decreased quality, increased quality, or moderate quality). Covariates included in the models were baseline energy intake (kcals), age (years), sex (female or male), education level (primary school, secondary school, high school, normal superior, college, graduate school), smoking status (never, ex-smoker, and smoker), and alcohol consumption status classified into the following categories: nondrinker (no alcohol consumption during the past 12 months), moderate drinker (<2 drinks/d for men and <1 drink/d for women), and heavy/binge drinker (≥2 drinks/d for men and ≥1 drink/d for women).
Cox Regression Models to Predict 6-Year Risk of Metabolic Syndrome Stratified by Baseline BMI Status a .
Abbreviations: BMI, body mass index; HR, hazard ratio; PA, physical activity.
Models were adjusted for age (years), sex (male, female), baseline smoking status (nonsmoker, past smoker, current smoker), baseline drinking status (nondrinker/moderate drinker, heavy/binge drinker), education level (elementary, secondary, high school, teaching diploma, college, graduate degree), and baseline and follow-up energy intake (kcals).
β (P value).
Results
A final sample of 1046 participants of the cohort were included in the present analysis, of whom 557 were classified as lean, and 489 were overweight or obese at baseline (Figure 1). Median age in the lean participants was 38 years and in the OW/OB participants, 42 years (Table 2). The sample was mostly female: 79.9% of lean participants and 69.9% in the OW/OB group were female. Close to 56% of lean participants had a college degree or went to graduate school; among OW/OB participants, about 48% had a college or graduate degree. The majority of participants were nonsmokers, and about 66% to 67% of all were moderate drinkers. There were fewer nondrinkers in the OW/OB group (12.9%) than in the lean group (20.1%) and more heavy/binge drinkers in the OW/OB (19.8%) group than in the lean group (13.8%).
Baseline Characteristics of Participants According to BMI Status.
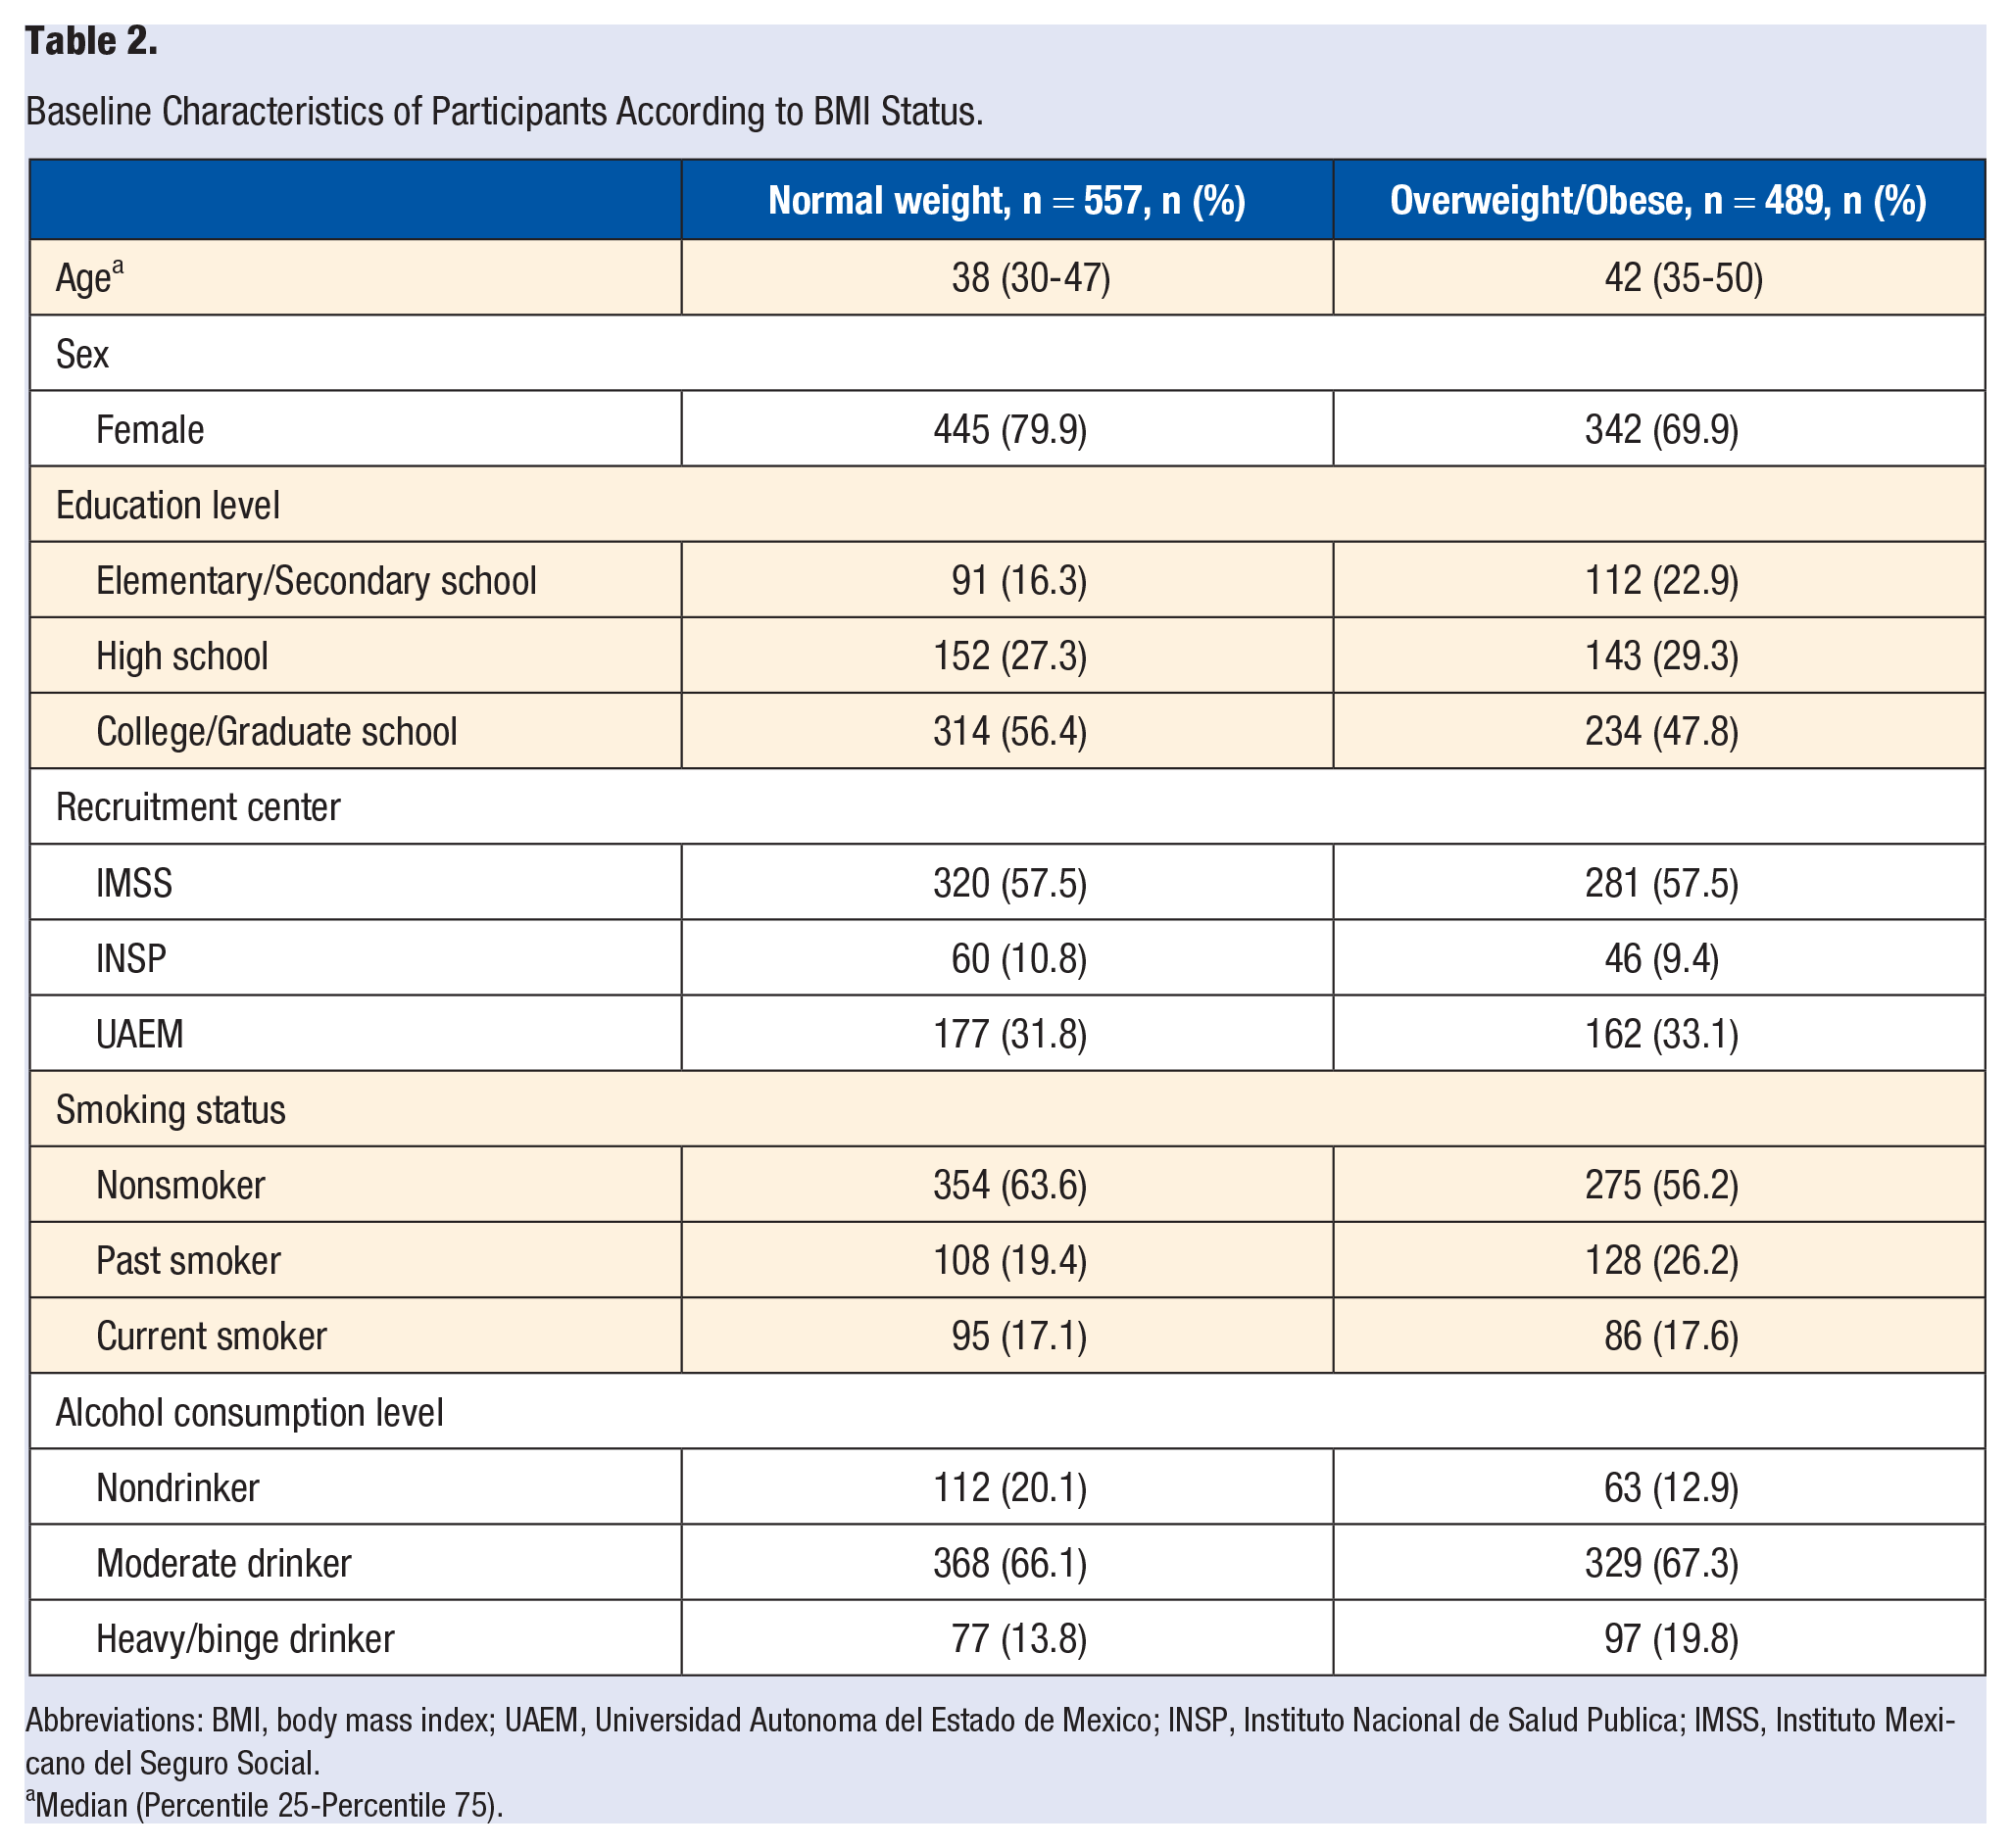
Abbreviations: BMI, body mass index; UAEM, Universidad Autonoma del Estado de Mexico; INSP, Instituto Nacional de Salud Publica; IMSS, Instituto Mexicano del Seguro Social.
Median (Percentile 25-Percentile 75).
Main lifestyle characteristics at baseline and at follow-up are presented in Table 3. Because the aim was to study 6-year risk of MS, none of the participants had MS at the beginning of the study. During the follow-up time, mean BMI increased about a unit in both groups. Most participants remained in the same BMI category during the study; nonetheless, among normal weight participants, 24.2% became overweight or obese, and among the OW/OB participants, 12.5% lost weight and were classified as normal weight in the follow-up. Energy intake was similar between groups; baseline measurement showed an intake close to 2000 kcals in both groups, and it decreased to 1714 kcals/d in the lean and OW/OB groups. Mean AHEI score was also similar in both groups, being close to 40 points at baseline and about 48 points at follow-up. None of the participants in either of the groups had a high AHEI score; 34.3% of lean participants and 29.7% of OW/OB had a low diet quality at both study time points. Those who decreased their diet quality were 18.5% in the lean group and 24.9% in the OW/OB group; on the other hand, 19.7% and 17% of lean and OW/OB participants improved their diet quality. Close to 30% of participants had moderate-quality diets in both measurements. Regarding LTPA, METS decreased during the study period in both groups; also, the percentage of participants achieving ≥150 minutes of leisure time MVPA went from about 40% to 35%. The most frequent LTPA pattern was the inactive; 35.5% of lean participants and 34.8% of OW/OB were classified in this category. Participants who increased their LTPA accounted for 17.8% and 14.9% of lean and OW/OB, respectively; in contrast, the amount who decreased their LTPA were 19.2% and 21.3% of lean and OW/OB, respectively. Participants who reported high PA participation in both measurements accounted for 27.5% of those with normal weight and 29% of those with overweight or obese.
Baseline and Follow-up Metabolic Lifestyle Characteristics by Baseline BMI Status.
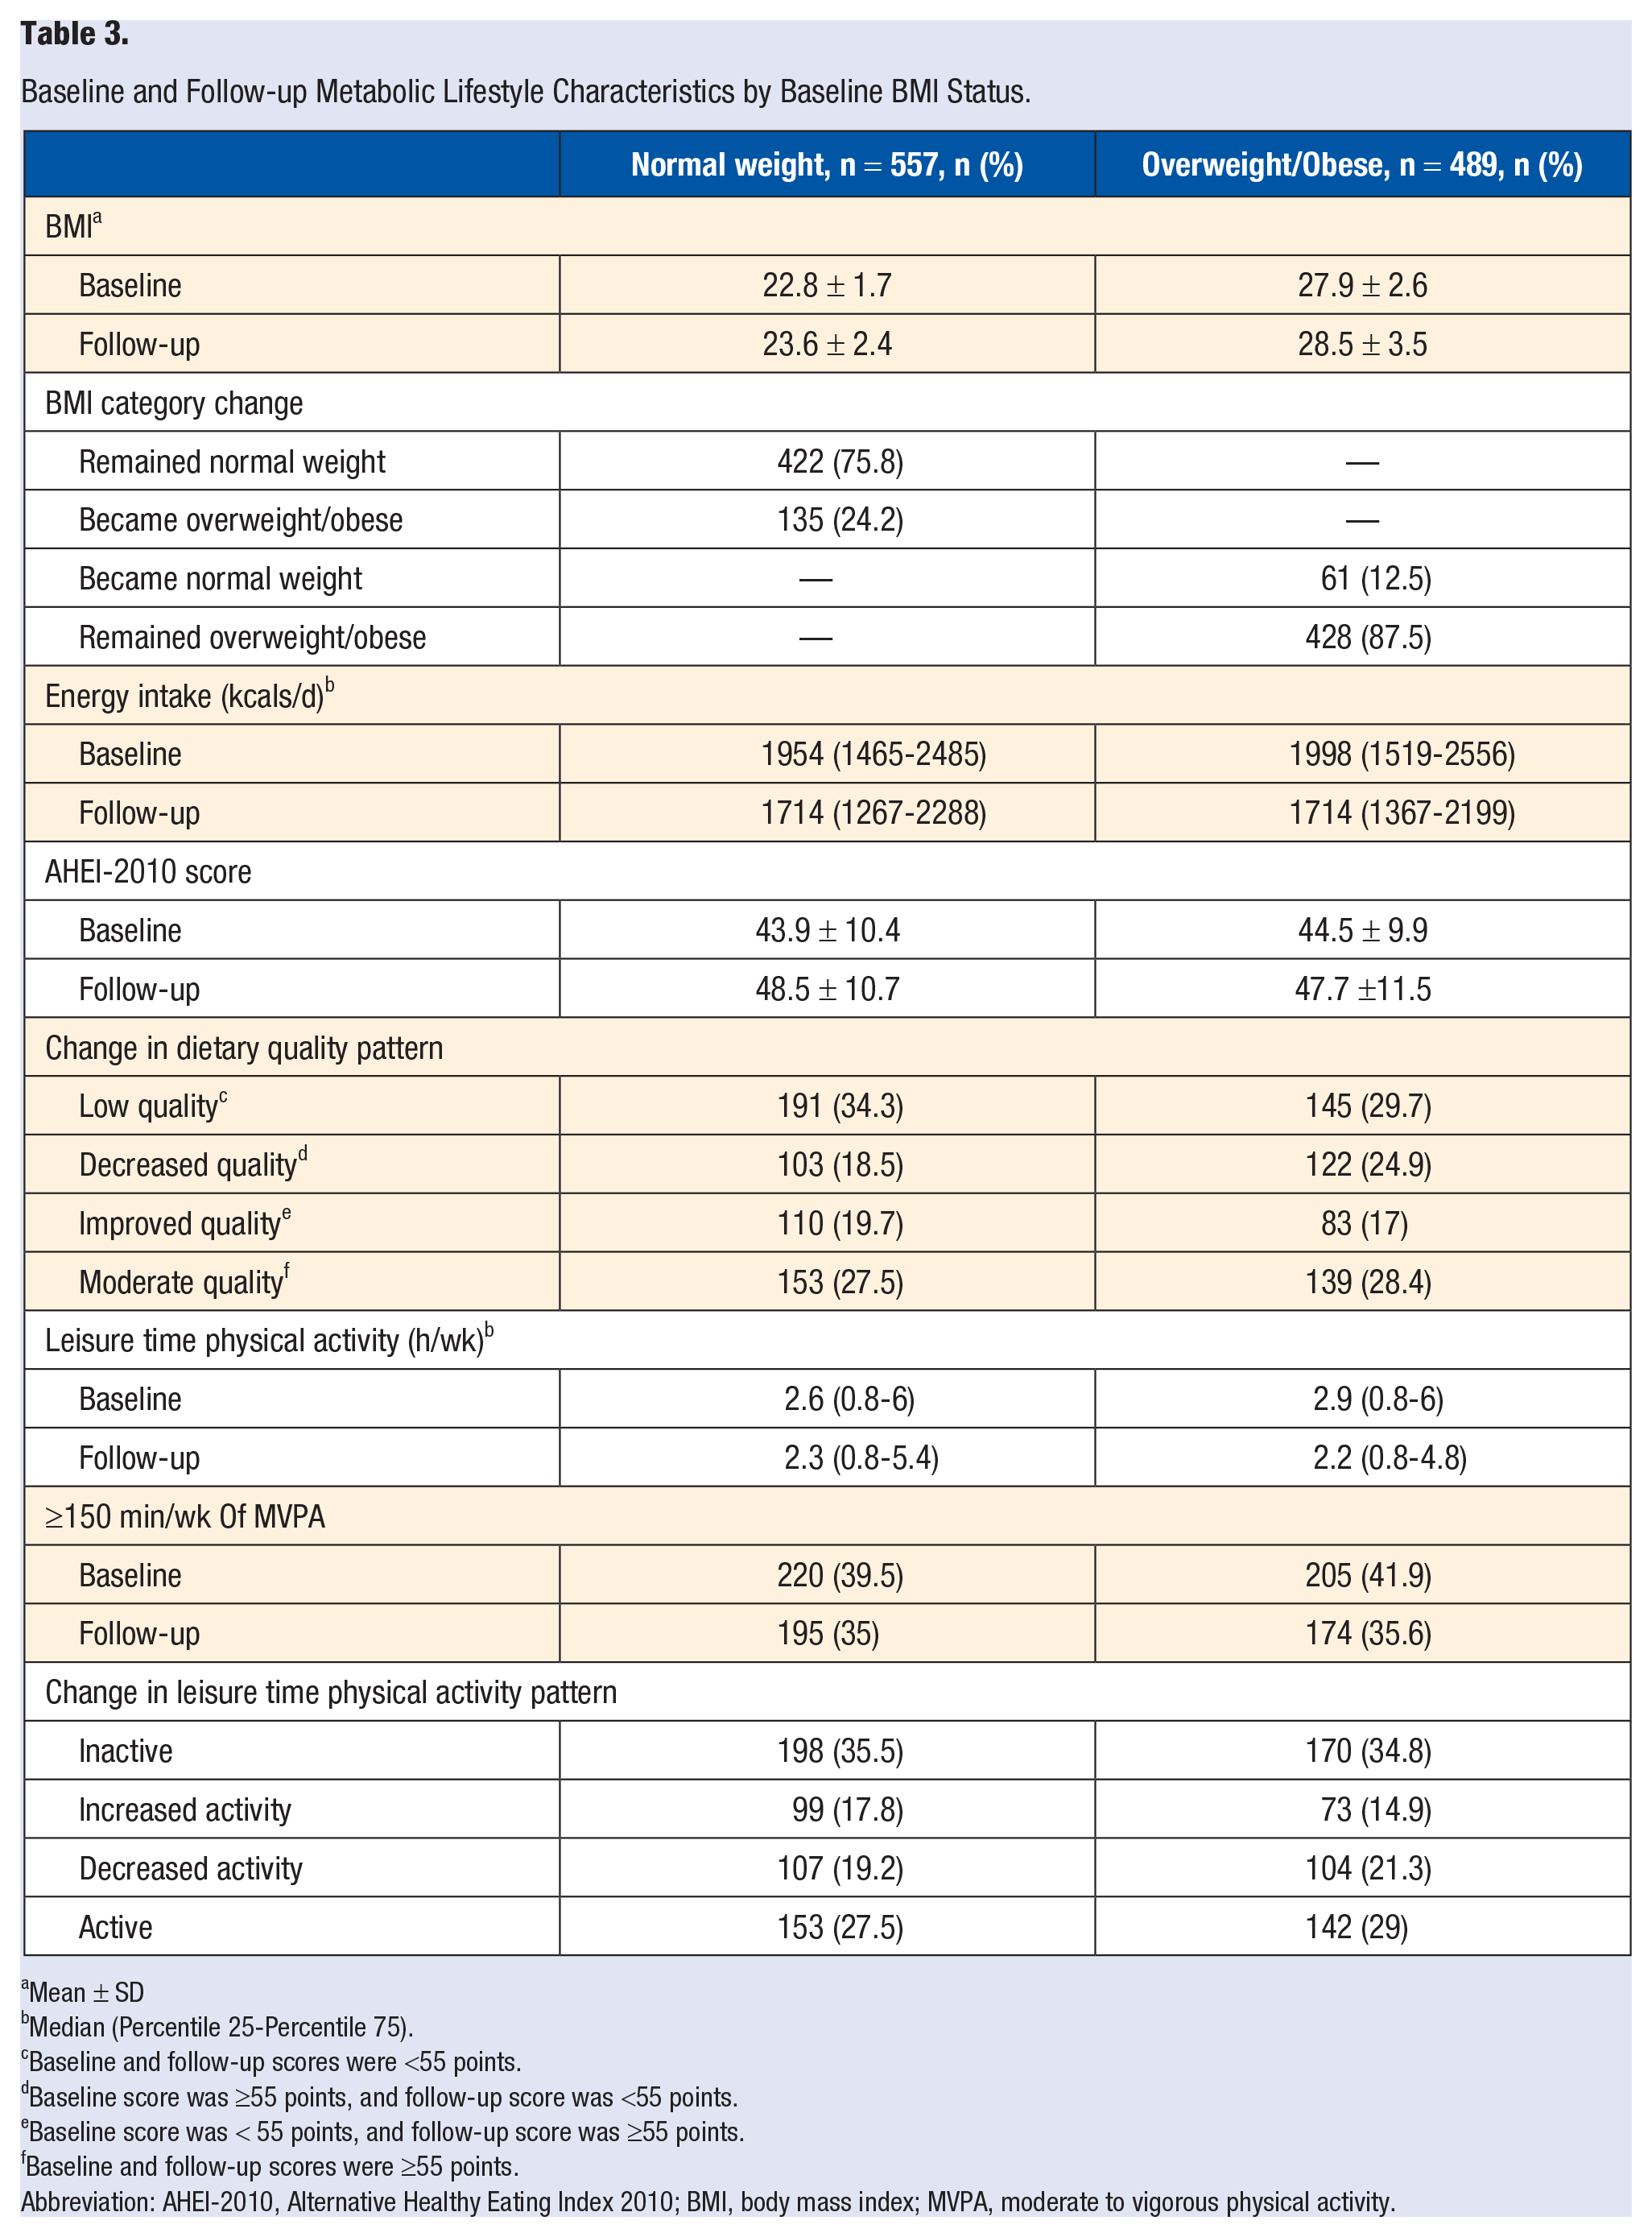
Mean ± SD
Median (Percentile 25-Percentile 75).
Baseline and follow-up scores were <55 points.
Baseline score was ≥55 points, and follow-up score was <55 points.
Baseline score was < 55 points, and follow-up score was ≥55 points.
Baseline and follow-up scores were ≥55 points.
Abbreviation: AHEI-2010, Alternative Healthy Eating Index 2010; BMI, body mass index; MVPA, moderate to vigorous physical activity.
The 6-year risk of MS and its components is shown in Table 4. MS risk was higher in the OW/OB group compared with the normal weight group; 37.2% developed MS by the end of the study, whereas only 16.2% of the lean participants developed it. The OW/OB group presented a higher risk of all components of MS compared with the lean group as well. There were 11% more cases of elevated fasting glucose, 6% more cases of low HDL-C, 3% more cases of elevated TG, 25% more cases of elevated waist circumference, 4% more cases of elevated systolic blood pressure, and 6% more cases of elevated diastolic blood pressure in the OW/OB group than in the normal weight group.
Six-Year Risk of Metabolic Syndrome and Its Components and BMI Status.
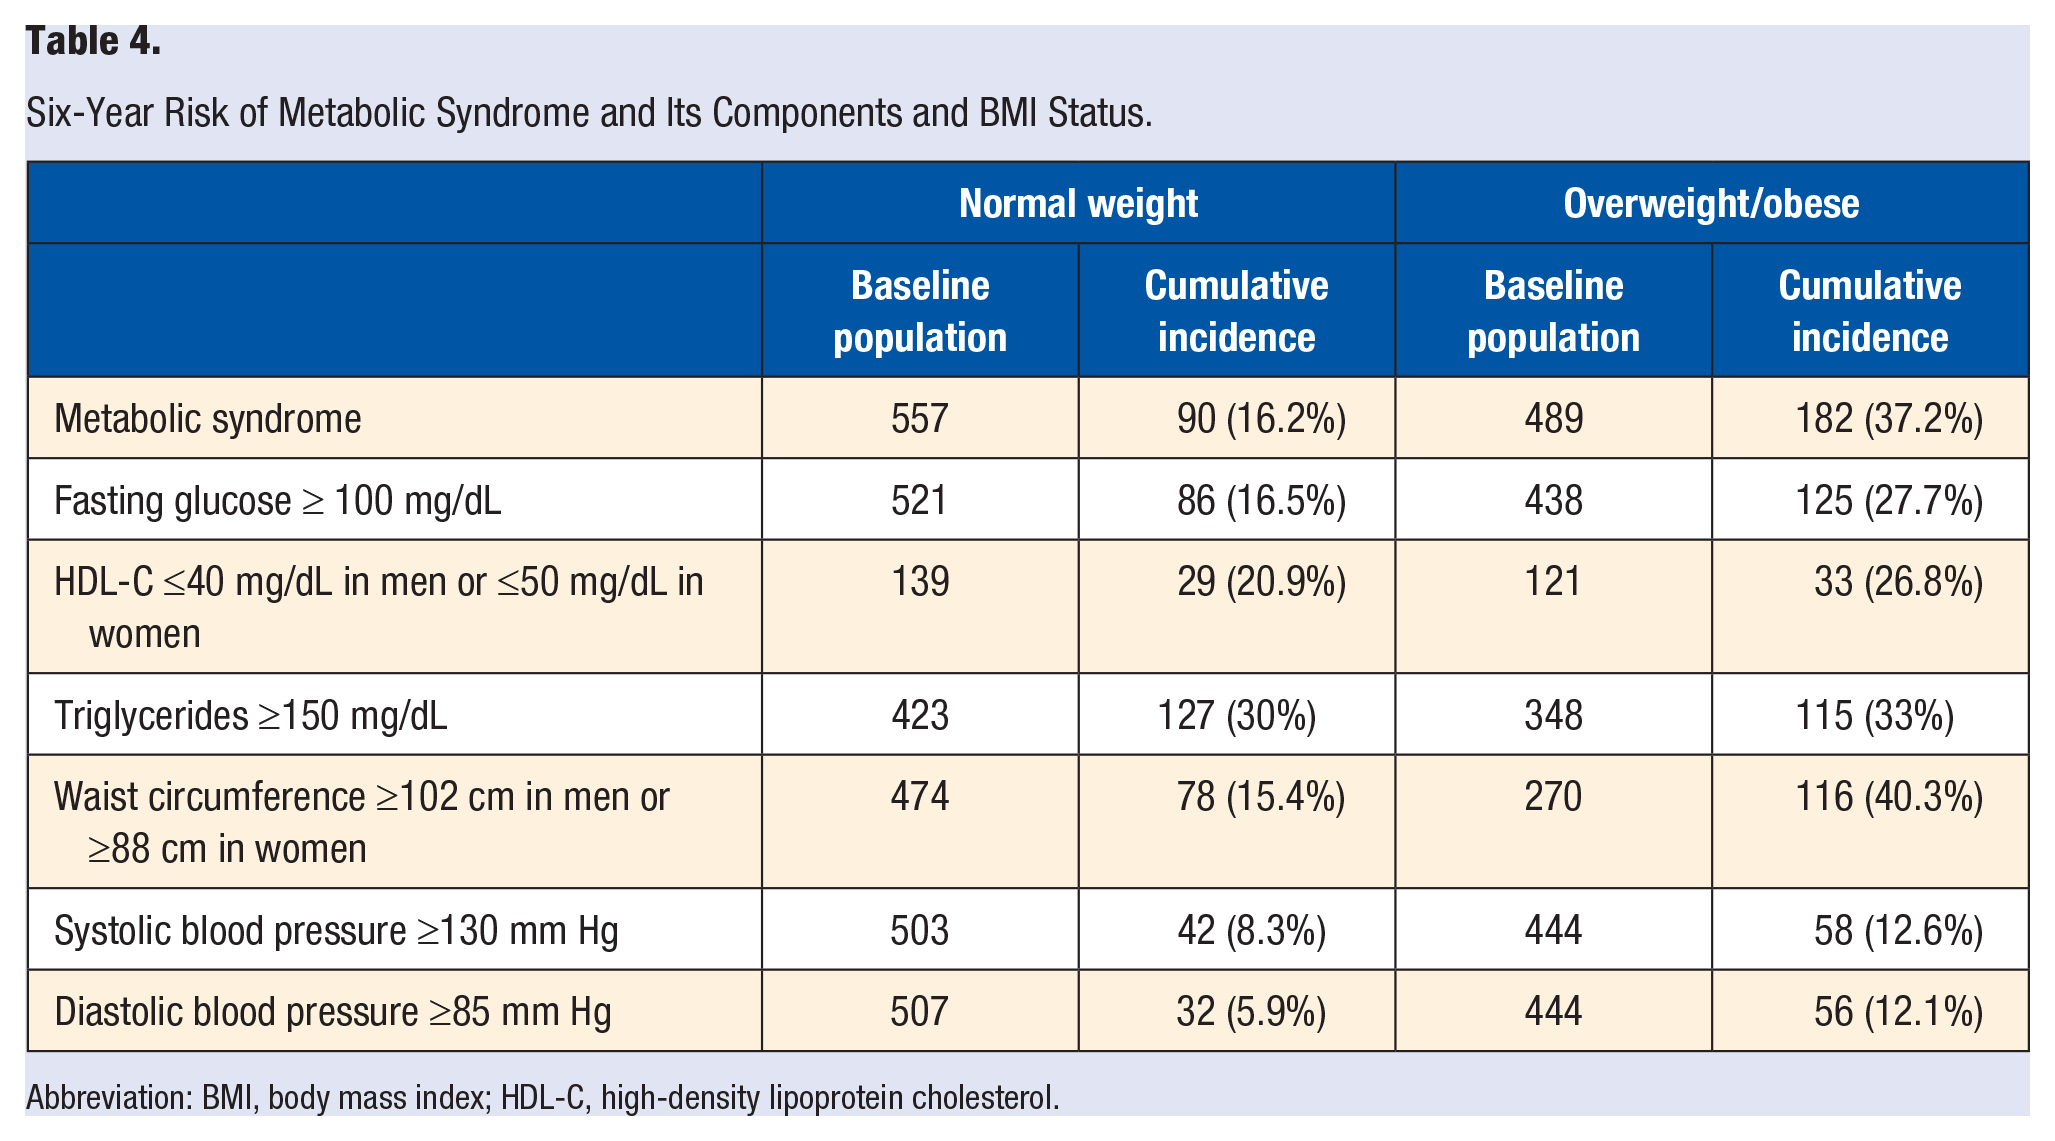
Abbreviation: BMI, body mass index; HDL-C, high-density lipoprotein cholesterol.
To examine the role of lifestyle (weight change, diet quality, and LTPA pattern) on 6-year risk of MS, we performed a multivariate Cox regression model (Table 1) for lean and for OW/OB groups, adjusted for relevant sociodemographic and lifestyle factors. Among lean participants, those who became overweight had a hazard ratio (HR) of 3.06 for developing MS compared with those who remained normal weight (95% CI = 1.98, 4.74). Regarding the other lifestyle variables, neither diet quality pattern nor LTPA pattern increased or decreased the risk of MS. Among the OW/OB participants, becoming normal weight was associated with lower risk of MS, with a HR = 0.41 (95% CI = 0.22, 0.79); also, adopting an active PA pattern was associated with lower risk (HR = 0.63; 95% CI = 0.42, 0.95) in comparison with an inactive pattern. Diet quality was not associated with the incidence of MS.
Discussion
The aim of the present study was to examine the effects of lifestyle factors such as LTPA patterns, diet quality patterns, and weight change on 6-year risk of MS in a sample of lean and OW/OB individuals. We hypothesized that the effect of the studied lifestyle factors would differ between the lean and OW/OB groups. Our main finding was that when examining simultaneously the longitudinal role of the LTPA pattern, diet quality pattern, and BMI change, BMI change was predictive of MS in both lean and OW/OB groups, LTPA pattern was only predictive of MS in OW/OB participants, and diet quality pattern was not associated with development of MS in either group. Consistent with the literature, incidence of MS was higher in the OW/OB 3 and presented higher incidence of all components of MS as well. To our knowledge, no other study has evaluated the concomitant effect of LTPA pattern, diet quality pattern, and weight change on the development of MS stratified by BMI status in individuals without MS; nonetheless, there are other studies evaluating lifestyle factors and its effect on MS in participants with a wide BMI range.
We observed a protective effect for the active pattern but only in the OW/OB group. Even though there is strong evidence in the literature for the protective effect of PA, 26 there are conflicting results in some studies that examine PA as one of multiple lifestyle factors simultaneously. In the Mexican population, it has been shown that a high level of PA was associated with 68% less odds of MS in a cross-sectional study that accounted for diet quality but not for weight change. 27 In a study similar to ours, 28 they followed a cohort of Japanese male workers (mean BMI = 22.6 kg/m2) for 3 years and found that participants who were active on a regular basis had lower odds of MS after controlling for diet and weight change. In contrast, the CARDIA study28,29 also examined lifestyle factors in a cohort of healthy participants with a broad range of BMIs (24.2 ± 4.7 kg/m2) who they followed for 16 years and did not find a protective effect of being physically active over time after controlling for diet and weight change. As mentioned before, in our study, OW/OB participants who were consistently active at leisure time during the study length had lower risk of developing MS than those who did not maintain an active lifestyle, but this feature was not observed in the lean group. Multiple factors may be involved in the explanation of these inconsistent results. One factor is that the definition of physically active differs among studies: whereas some authors classify the PA level based only on baseline measurement, 28 other authors classify PA level through time depending on its variation over time. 29 Another factor is the fact that neither of the studies mentioned above studied lean and OW/OB participants apart. Other factors that could influence the conflicting results of the studies mentioned above are the inherent characteristics of participants, such as their mean BMI and age; also, the covariates used in the models can radically change the results of a study. Regarding the BMI selective effect observed in the active PA pattern, one possible explanation might be that overweight and obese people have a greater total mass consisting of both fat and lean tissue. 30 Thus, OW/OB people have a greater total energy expenditure when performing PA, increasing its beneficial effects. It is also possible that there are other biological mechanisms by which PA positively influences health, such as a more effective modulation of the body’s main stress responsive systems—the HPA axis, the autonomic nervous system, and immune system 31 might be involved to a greater extent with increasing body mass.
In our sample, diet quality pattern was not associated with MS; nonetheless, there was no high adherence to a healthy dietary pattern measured by the AHEI-2010 index among our participants. There are very few studies examining the role of diet quality and lifestyle on MS risk to compare our results with; in the past, research has focused mainly on the role of certain foods32-35 or nutrients,36-39 instead of the characteristics of the whole diet. It is only recently that the association between MS and complete dietary patterns, using either a priori approaches (adherence to dietary guidelines/diet quality indexes) or a posteriori approaches (clusters/principal component analysis) has received more attention. There is controversy regarding the results among the available studies27,40-46; some of them report a protective effect of healthy dietary patterns or better diet quality, whereas others have not found such results.
The majority of the studies finding a significant association between dietary patterns and MS share a common feature—that is, cross-sectional design of the study. They report that participants with better adherence to dietary guidelines (higher dietary quality) have lower odds of MS or its components.27,40,41,43-45 It is interesting to note that some cross-sectional studies that found a protective effect of high diet quality lack the dose-dependent effect expected for a causal relation. For instance, Lassale et al 40 and Nicklas et al 43 reported lower odds for quartiles 2 and 4 than for quartile 3. There is also high heterogeneity with respect to participant BMI, age range, and covariate adjustment in the models, whereas some of them do not account for the effect of BMI in their analysis.41,44 On the other hand, most of the studies that do not find an association between healthier dietary patterns or better diet quality with lower risk of MS have longitudinal designs.28,47
Diet is such a complex construct comprising quantity, quality, physiological effects of foods such as glycemic index, specific behaviors such as snacking, or hours of fasting, among other features, that examining its effect is highly challenging. In our study, we incorporated quality and quantity; nonetheless, there is no one standardized way to measure the construct of “diet quality.” Some authors use diverse validated indexes finding different results with one or another method. For example, Zamora et al 48 used the HEI-2005 and found that there was no association between higher diet quality and lower risk of type 2 diabetes, which is one of the main consequences of MS, 48 whereas another study that used both the HEI-2005 and the AHEI-2010 found that when using the HEI-2005, no association between diet quality and T2DM was evident, but when they used the AHEI-2010 score, a significant dose-dependent association between diet quality and odds of T2DM was found. 24 In our study, diet quality was not associated with MS, but as mentioned before, participants’ diet quality was low and moderate; we were unable to observe good quality diets. Some authors have only found a protective association of diet quality in the highest adherence group 41 in observational studies, and in a clinical trial where high adherence levels were granted, there was a reversal of 10% of cases of MS among the participants who were randomized to follow a healthy dietary pattern as compared with no reversal in the control group. 49 Therefore, it is likely that high adherence to healthy dietary patterns is needed to have an impact on MS.
Overall, the lifestyle factor that was more strongly associated with risk of MS was weight change; lean individuals who became OW/OB had a 3-fold risk of developing MS than those who remained lean, and OW/OB individuals who became lean had about a 60% less risk of developing MS than those who remained the same. Other authors have also shown that having stable BMI or losing weight is associated with only minimal worsening or no change in MS components50,51even for overweight and obese individuals. Our results are consistent with other cohorts where participants who remained in the normal BMI range compared with those who gained weight, reduced their odds of developing MS by 36% independently of other lifestyle factors.28,29
The main limitation of the study is the lack of possibility to examine the role of high diet quality simultaneously with weight change and PA pattern given the fact that virtually none of the participants adhered to a healthy dietary pattern.
Conclusion
After studying the effect of lifestyle factors such as diet quality pattern, weight change, and PA pattern over a 6-year period in lean and OW/OB adults free of chronic diseases, weight change was the most relevant factor predicting incident MS both in lean and overweight individuals. Nonetheless, there was a differential effect of PA pattern: OW/OB participants benefited from being active, whereas maintaining an active lifestyle did not provide additional protection in lean individuals; finally, moderate diet quality was not associated with MS risk. In conclusion, maintaining or achieving a normal BMI is the most important factor for MS risk in a 6-year period, independently of PA pattern and diet quality.
Footnotes
Acknowledgements
We would like to thank all the staff who took part in the Health Workers Cohort Study. We would also like to acknowledge the participants of the study for their time and interest in the study.
Declaration of Conflicting Interests
The authors declared no potential conflicts of interest with respect to the research, authorship, and/or publication of this article.
Funding
The authors received no financial support for the research, authorship, and/or publication of this article.
Ethical Approval
Not applicable, because this article does not contain any studies with human or animal subjects.
Informed Consent
Not applicable, because this article does not contain any studies with human or animal subjects.
Trial Registration
Not applicable, because this article does not contain any clinical trials.