
Abstract
There have been dramatic increases over the past several decades in the prevalence of childhood obesity and childhood metabolic syndrome in the United States and other industrialized nations. Since the 2 conditions carry negative health implications, both during childhood and later in life, it is important for health care professionals to stay abreast of the current literature relative to both conditions. This review will examine definitional issues, prevalence rates, causative factors, and health consequences associated with childhood obesity and the metabolic syndrome, as well as current thinking regarding prevention and treatment efforts. The review will conclude with recommendations relative to future research needs.
“. . . a complicated interplay of risk factors, an obesogenic environment, and genetic susceptibility appear responsible for the current epidemic in childhood obesity.”
Childhood Obesity
In the past 3 decades, the United States and other industrialized nations have experienced a dramatic increase in the prevalence of childhood obesity and the metabolic syndrome (MetS). Since interactions with affected children are likely to become increasingly more frequent for many health care professionals, it is important that these professionals stay informed of the latest research in the field.
This review will present an overview of the current state of knowledge relative to childhood obesity and the MetS. Childhood obesity issues will be presented first, followed by issues related to childhood MetS.
Defining Childhood Obesity
Defining childhood obesity has proven challenging and no single, universally employed definition based on children’s body fatness has emerged. 1 Instead, because of its simplicity, cost, subject acceptability, and presence of published reference values, most large-scale national surveys have described and assessed childhood obesity using body mass index (BMI), which is calculated as weight in kilograms divided by height in meters squared. In the United States, The Centers for Disease Control and Prevention (CDC) year 2000 growth charts serve as reference values. 2 The National Center for Health Statistics and the CDC use the term overweight for childhood BMI values between the 85th and 95th percentiles (formerly called “at risk for overweight”) and the term obesity for childhood BMI values at or above the 95th percentile (formerly called “overweight”). 2
Researchers outside the United States often use cut-points for childhood obesity established by the International Obesity Task Force, 3 which developed BMI criteria that could be used for international comparisons of prevalence without depending solely on US reference data. 1 As a consequence, the same data set can yield differing obesity prevalence estimates depending on whether CDC or International Obesity Task Force cut-points are applied.
Despite limitations, such as being an imprecise measure of body fat, BMI-based definitions of childhood overweight and obesity provide practical working definitions that are valuable for general public health surveillance and screening. 1 At the level of the individual child, however, BMI should be seen more as a screening tool rather than a diagnostic tool. This would seem especially true around the time of puberty when height is often changing rapidly. A child with a BMI over an established cut-point does not necessarily have clinical complications or health risks related to over-fatness. More in-depth assessment is required to ascertain health status. 1
Prevalence of Childhood Obesity
The prevalence of childhood overweight and obesity has more than tripled in the United States over the past 3 decades with rates high among most age, gender, racial/ethnic, and socioeconomic groups. 4 The most recent (2012) nationwide report for the United States, based on the 2009-2010 National Health and Nutrition Examination Survey (NHANES) data set, observed an obesity prevalence of 16.9% among children and adolescents aged 2 to 19 years with 31.8% being either overweight or obese. 5 Males aged 2 to 19 years had a significantly higher obesity prevalence than females (18.6% vs 15.0%). Significant differences by race/ethnicity were also observed. Obesity prevalence was 24.3% among non-Hispanic black children and adolescents, 21.2% among Hispanic children and adolescents, and 14.0% among non-Hispanic white children and adolescents. Although the report concludes by noting that the rapid increases in childhood obesity prevalence seen in the 1980s and 1990s may be leveling off, current prevalence levels are unacceptably high and represent a major public health challenge.
Causes of Childhood Obesity
At the fundamental level, childhood obesity can be seen as an imbalance between energy intake and energy expenditure needed for normal growth and development. 6 At the same time, it is well established that childhood obesity is a complex and multifactorial condition in which environmental, psychological, and genetic causative factors are implicated. 7 Table 1 lists some of the implicated factors.
Factors Implicated in the Development of Childhood Obesity. a
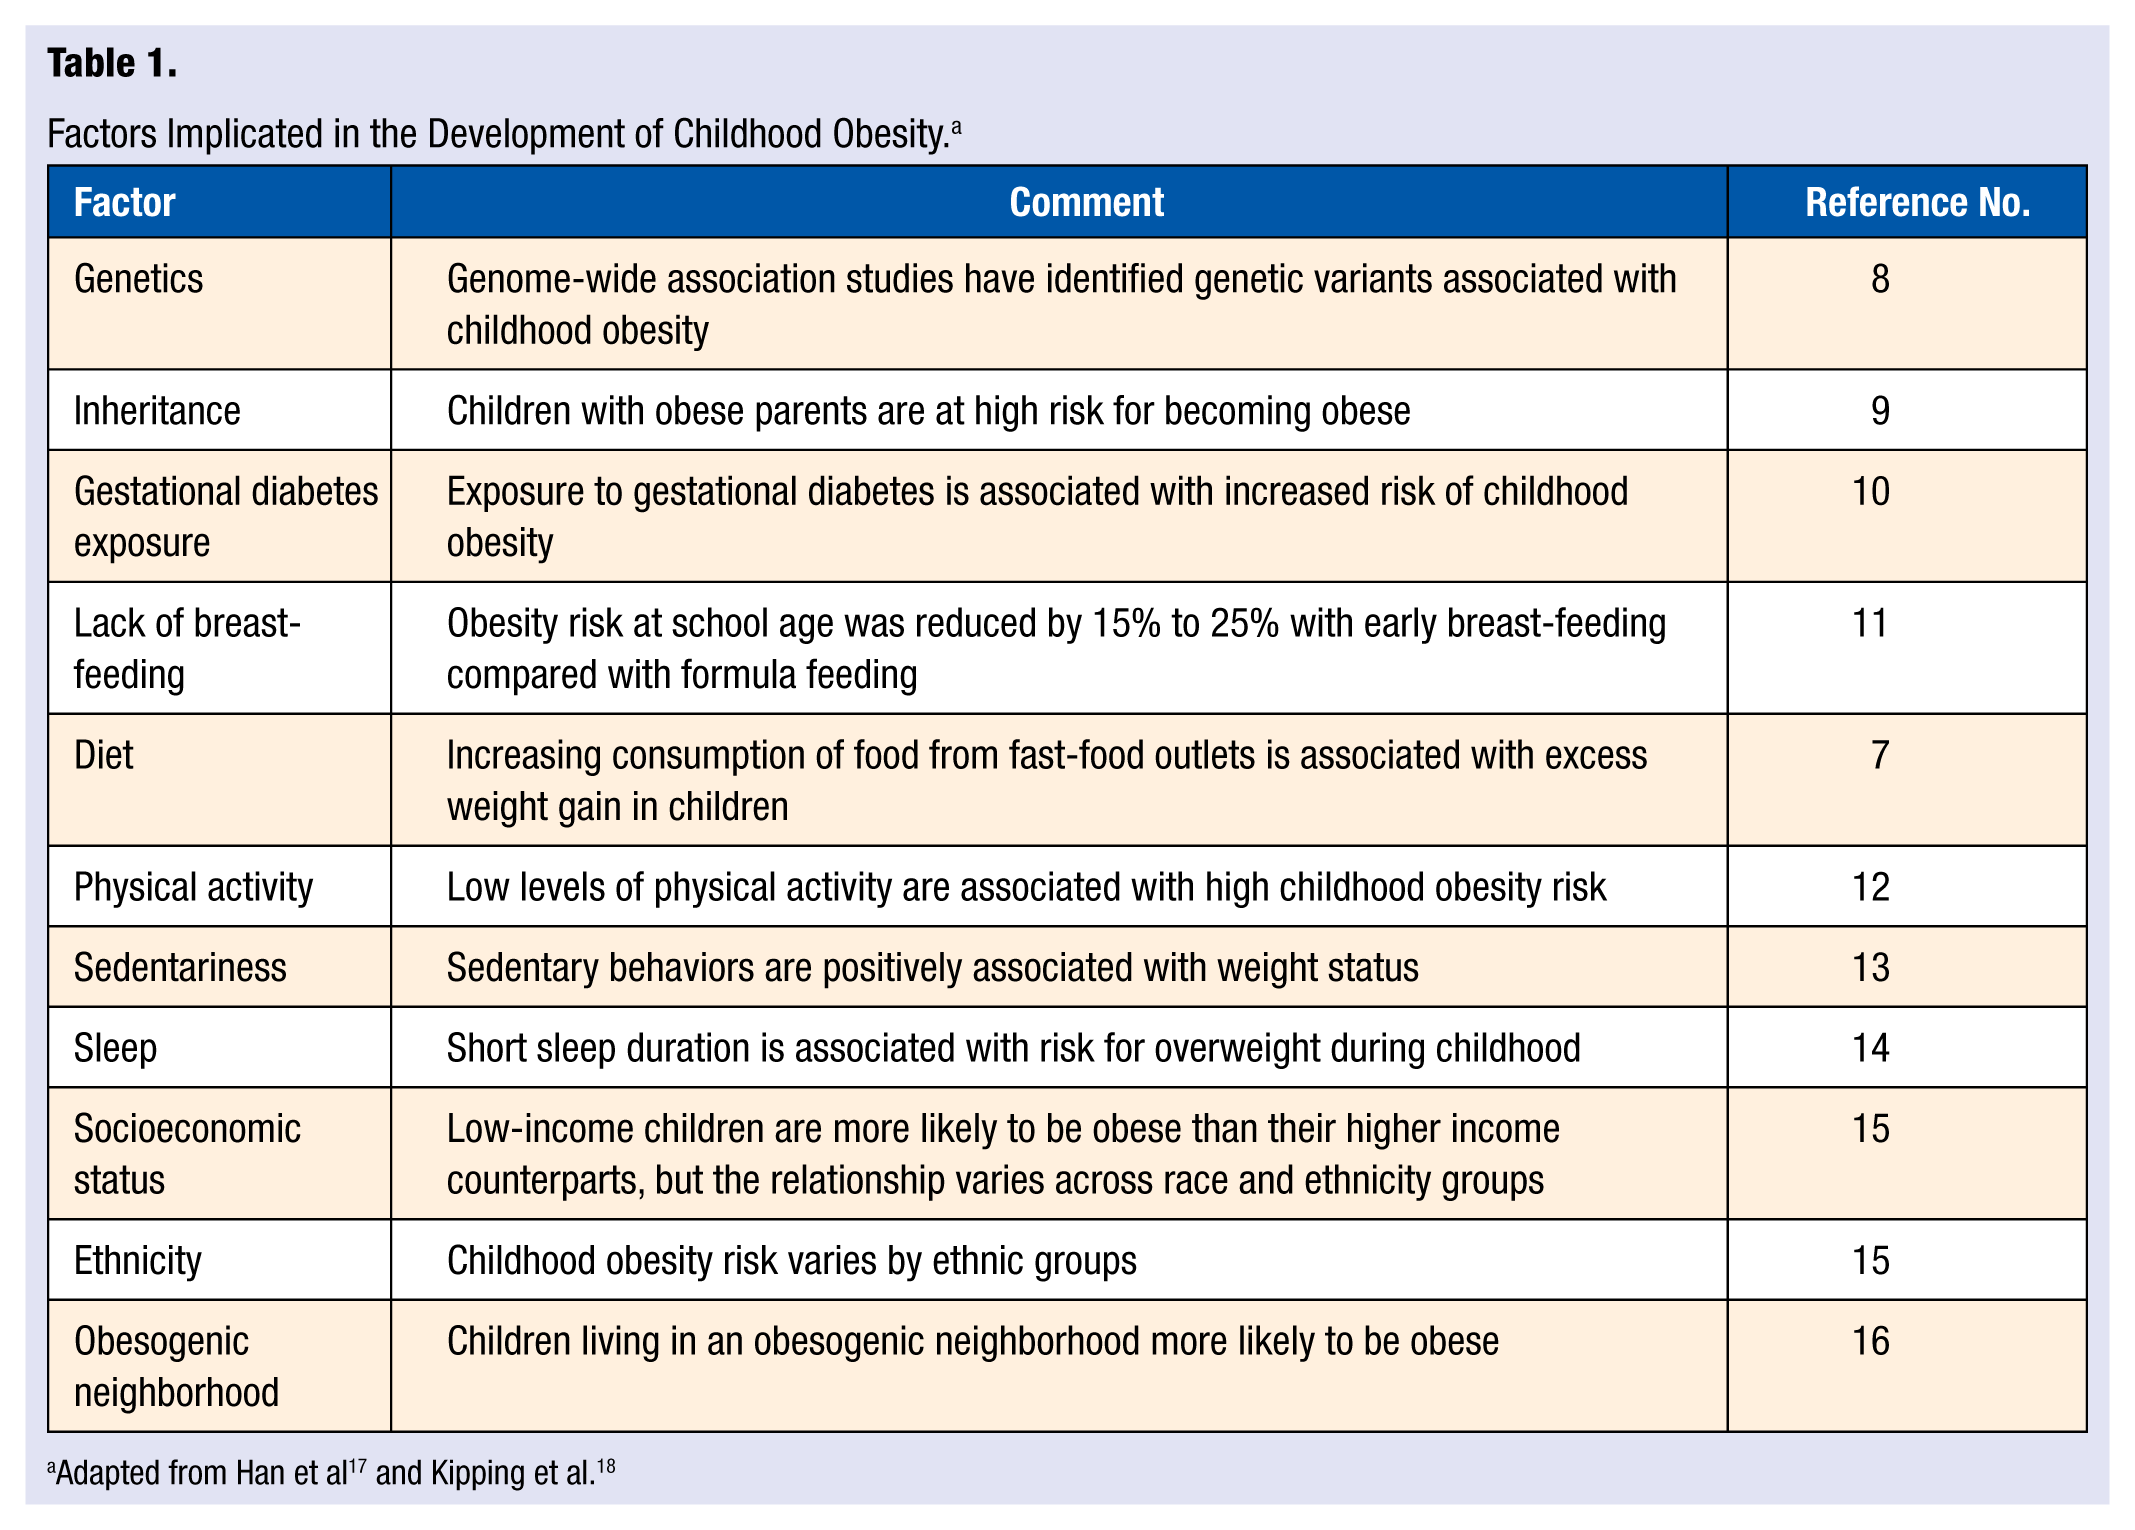
Concomitant with the risk factor perspective is the notion that childhood obesity has been fostered by the presence of an “obesogenic” culture that relentlessly exposes children to a food environment that promotes overconsumption of calorie-dense, nutrient-poor foods while supporting a physical activity environment that favors sedentary behavior. 19 Thus, a complicated interplay of risk factors, an obesogenic environment, and genetic susceptibility appear responsible for the current epidemic in childhood obesity.
Consequences of Childhood Obesity
Obesity places children at increased risk for significant health problems both during their youth and as adults. Obese children are at increased risk for dyslipidemia, 20 hypertension, 21 atherosclerosis, 22 sleep apnea, 17 insulin resistance, 23 nonalcoholic fatty liver disease, 24 and lower limb malalignment. 25 Not only are obese children more likely to become obese adults, 26 but obesity during childhood also carries risk for adult mortality and morbidity. Greater BMI in childhood was associated with increased adult mortality risk from cardiovascular disease 27 and being overweight or obese between the ages of 14 and 19 years was associated with increased mortality (after age 30) from various systemic diseases. 28 In addition to the significant health risks, obesity influences children’s quality of life, adversely affecting their physical, social, and psychological functioning. 29
Prevention and Treatment of Childhood Obesity
Prevention and treatment of childhood obesity have progressed along dual tracks, employing both the medical and public health models. According to Schwartz and Brownell, 19 the medical model tends to frame childhood obesity as a disease that strikes individuals due to internal or external causes, whereas the public health model frames childhood obesity as a disease that strikes a population as a consequence of individual vulnerability combined with exposure to environmental elements. Within the medical model, childhood obesity is identified in specific children by a health professional leading to a targeted treatment. Researchers and clinicians have developed individual and family treatments that address the needs of individual cases. From a public health perspective, epidemiological questions related to childhood obesity are addressed, causal factors for the population are identified, and community, state, or national changes are proposed that appear feasible and likely to have an impact on prevalence. Aspects of both approaches are discussed below.
Murray and Battista 30 note that primary care clinicians are in a unique position relative to preventing childhood obesity; no other professional has access to the child and the family in the early critical period before the influences of the obesogenic lifestyle have become fully manifest. They suggest that primary care clinicians need to be unambiguous and direct about what the family should and should not do relative to the obesity threat. As a starting point they recommend the 10 core evidence-based messages and suggestions developed by the Expert Committee on the Prevention and Treatment of Childhood Obesity. 31 Those 10 recommendations are as follows:
Support exclusive breast-feeding for the first 6 months
Limit sweetened drinks
Limit TV to 2 hours per day and no TV in the child’s bedroom
Do 60 minutes per day of moderate-to-vigorous physical activity
Consume 5 to 9 servings of fruits and vegetables per day
Consume a nutrient-rich diet, high in calcium and fiber
Eat dinner as a family 5 to 6 times per week
Limit eating away from home, especially fast foods
Limit portion sizes
Consume a nutritious breakfast everyday
Although primary care clinicians cannot curb the childhood obesity epidemic in isolation from other allied health professions, it is of paramount importance that they continually encourage families to establish daily habits that strengthen their children’s nutrition and activity levels. 30 Providing referrals to dieticians, behavioral psychologists, or exercise physiologists can be helpful in this regard.
Outside the clinical setting, childhood obesity prevention efforts occur in a variety of locales including schools, child care centers, the community, and the home. A recent Cochrane systematic review examined the effectiveness of obesity prevention programs in these nonclinical settings. 32 The review included a meta-analysis of 37 intervention studies involving more than 27 000 children and found that programs were in general effective at reducing adiposity, although not all individual interventions were effective. Overall, children in the intervention groups had a mean decline in adiposity (measured as BMI or BMI z- scores) of −0.15 kg/m2. Intervention effects tended to differ by age-group, with the largest declines in ages 0 to 5 years (−0.26 kg/m2), smallest in those aged 13 to 18 years (−0.09 kg/m2), with 6- to 12-year-olds in between (−0.15 kg/m2). Although the magnitudes of the declines in BMI appear to be modest, it has been noted that a small reduction in BMI in a population wide meta-analysis is significant. 33 The review also noted that no evidence of adverse outcomes such as unhealthy dieting practices, increased prevalence of underweight, or body image sensitivities was found. 32 Authors of the Cochrane review suggested the following as promising obesity prevention policies and strategies for nonclinical settings:
School curriculum that includes healthy eating, physical activity, and body image
Increased sessions for physical activity and the development of fundamental movement skills throughout the school week
Improvements in the nutritional quality of the food supply in schools
Environments and cultural practices that support children eating healthier foods and being active throughout each day
Support for teachers and other staff to implement health promotion strategies and activities (eg, professional development, capacity-building activities)
Parent support and home-building activities that encourage children to be more active, to eat more nutritious foods, and spend less time in screen-based activities
Although some successes in childhood obesity prevention can be pointed to, it has been suggested that legislative and regulatory action will be needed if substantial progress is to be made. 19 Several recent national initiatives are worth noting. The 2010 Affordable Care Act requires worksites provide nursing mothers reasonable break time to express milk to a nursing child for 1 year after the child’s birth in a place other than a bathroom that is shielded from view and free from intrusion of coworkers and the public. 34 The Healthy, Hunger-Free Kids Act was enacted in December 2010 and requires the US Department of Agriculture to establish national nutrition standards for all food sold and served in schools at any time during the school day. 35 The act also requires the development of a technical assistance program to promote healthy eating using behavioral research and allows states to implement nutrition education and obesity prevention programs. The White House Task Force on Childhood Obesity was created in 2010 and included a national action plan, with all agencies of the federal government participating, that included the goal of reducing childhood obesity rates from 17% to 5% by 2030. 36
State-level initiatives are also taking place. Twenty-eight states and the District of Columbia have set nutritional standards for school lunches, breakfasts, and snacks that are stricter than current US Department of Agriculture requirements; 20 states have passed requirements for BMI screenings for children and adolescents or have passed legislation requiring other weight-related assessments in schools; 23 states and the District of Columbia have laws that establish programs linking local farms to schools; and 23 states impose a sales tax on soda. 36
The impact of these recent legislative actions awaits evaluation. Schwartz and Brownell 19 note a prime challenge for the future is to discover which childhood obesity interventions, policies, or programs have the greatest impact. They argue this will require a major research effort, one that is much larger than currently funded by the government. It must involve sensitivity to global factors that affect diet and activity and take into account broad social forces such as economics and the influence of industry.
Childhood Obesity: Summary
The prevalence of childhood obesity has risen to unacceptable levels. Progress has been made regarding our understanding of the causes of this epidemic, its current and future health consequences, and potentially effective prevention and treatment interventions. Much work is yet to be done, including increasing our knowledge of childhood obesity and its relationship to MetS.
Childhood Metabolic Syndrome
The notion of a metabolic syndrome (MetS), that is, the clustering in an individual of a set of risk factors thought to put the individual at increased risk for cardiovascular disease and type 2 diabetes, was developed more than 20 years ago. 37 Originally and most commonly applied to adults, the utility of a MetS designation for children has generated considerable clinical and research interest, coincident with the rise in childhood obesity. Although divergent opinions exist regarding the diagnostic value of MetS in children, 38 it has been argued that the presence of several cardiometabolic risk factors in a given child, even at subclinical levels, predict future progression to overt chronic disease and potentially make MetS a sentinel marker for highlighting the need for more aggressive intervention efforts beyond the traditional treatment options for overweight and obese youths. 39 At the same time, the clinical utility of a MetS designation in children has been questioned, 40 and some advocate addressing individual risk factors in their clinical context instead of using a “syndromic” approach. 38
Definition of Childhood Metabolic Syndrome
Various criteria have been used to identify MetS in children. 41 However, despite numerous review articles and consensus conferences, no standardized set of criteria for what constitutes the pediatric MetS has earned universal acceptance. 42 The various definitions share common features, however: All include an obesity component (BMI or waist circumference), blood lipid measures (triglycerides and high-density lipoprotein cholesterol), blood pressure, and a component assessing glucose metabolism (fasting glucose or glucose tolerance). 38 Table 2 compares components and cutpoints from 2 of the most widely used MetS definitions, the National Cholesterol Education Program Adult Treatment Panel III definition as modified for adolescents 43 and the 2011 International Diabetes Foundation (IDF) definition for adolescents. 44 As discussed below, prevalence rates for childhood MetS can vary widely, even in the same study population, depending on which definition of MetS is used. Adding complexity to the definitions of childhood MetS is the problematic generalizability for populations of different ethnicities. 38 Calls for ethnic-specific MetS criteria45,46 emphasize the challenge of creating a “one-size-fits-all” MetS definition for children. 38
Criteria for Diagnosis of Metabolic Syndrome in Adolescents.
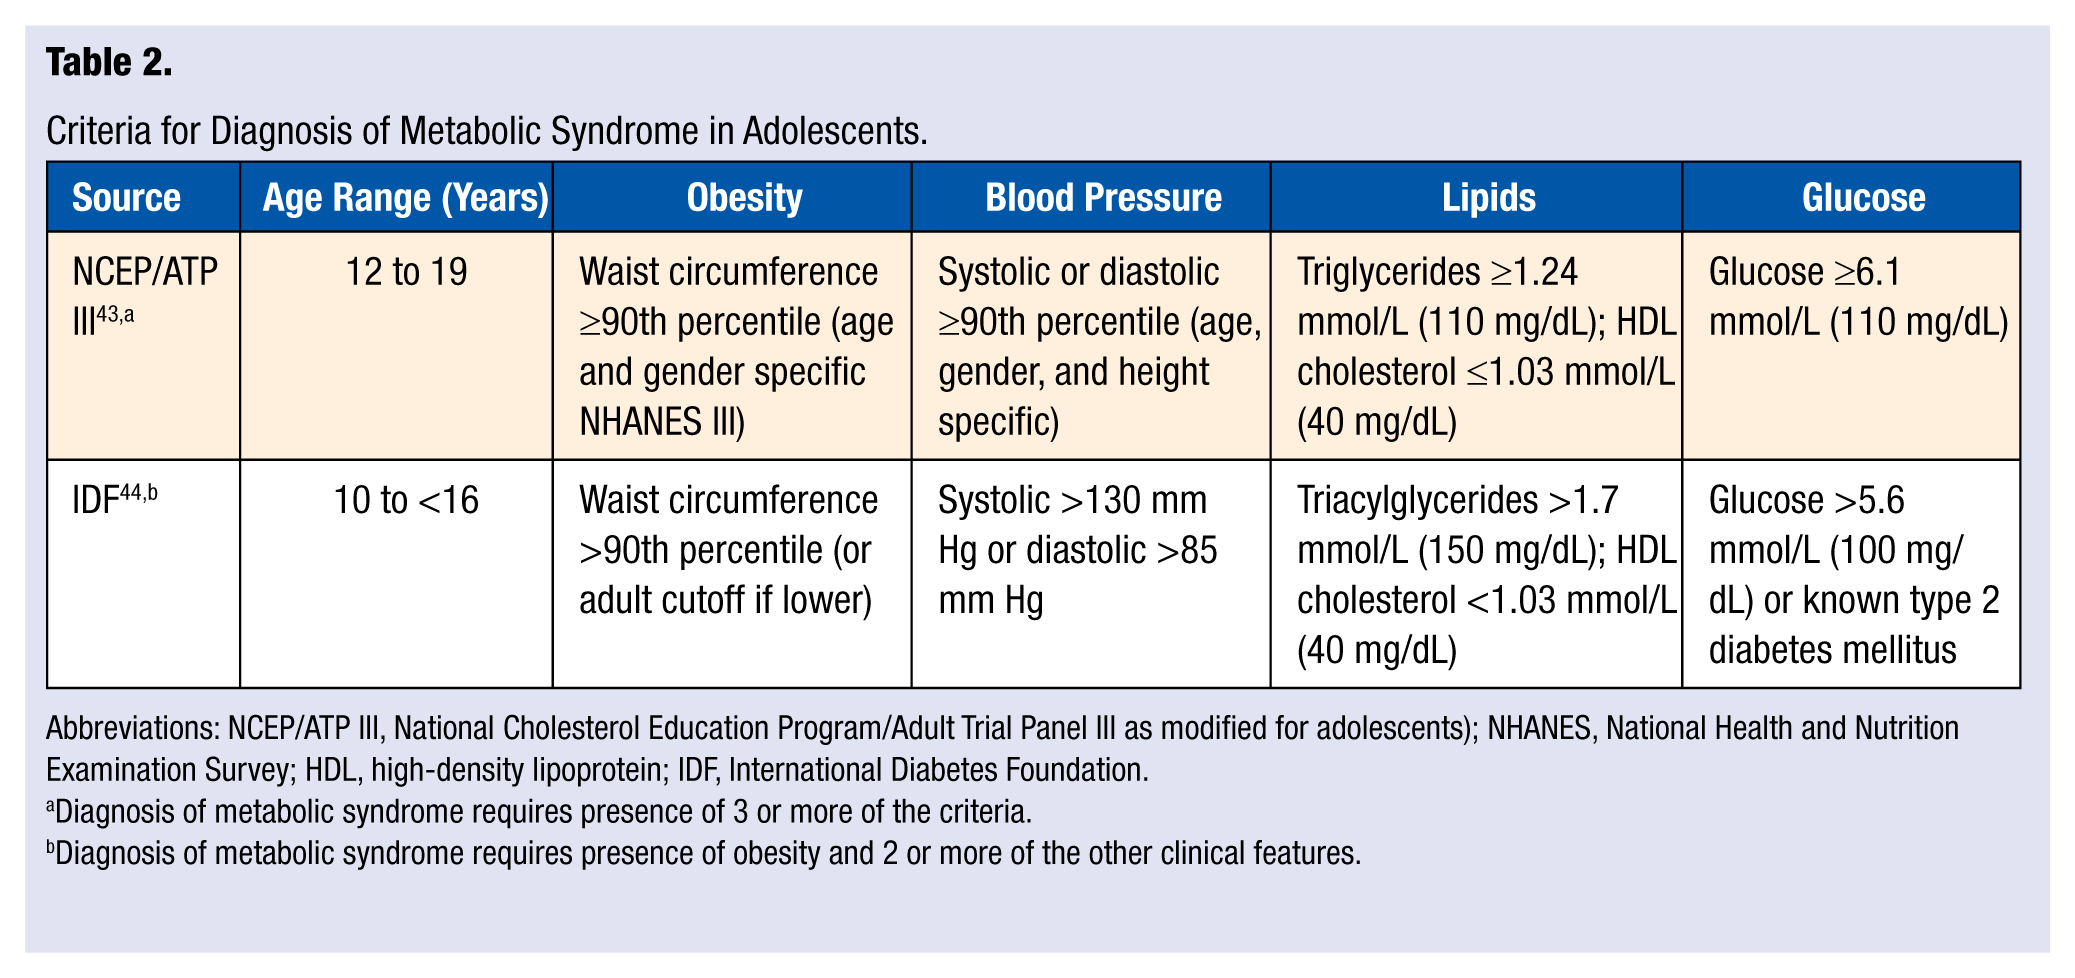
Abbreviations: NCEP/ATP III, National Cholesterol Education Program/Adult Trial Panel III as modified for adolescents); NHANES, National Health and Nutrition Examination Survey; HDL, high-density lipoprotein; IDF, International Diabetes Foundation.
Diagnosis of metabolic syndrome requires presence of 3 or more of the criteria.
Diagnosis of metabolic syndrome requires presence of obesity and 2 or more of the other clinical features.
It has also been suggested that use of a continuous metabolic risk score might be more useful with children than the dichotomized MetS definitions described above, although the net value of such a score is unclear. 47
Prevalence of Childhood Metabolic Syndrome
Prevalence of childhood MetS varies depending on which definition is applied. For example, Goodman et al 48 studied 1098 students in an Ohio public school district and reported a MetS prevalence of 3.4% using criteria suggested by the American Heart Association (AHA) but a prevalence of 4.5% when using the criteria suggested by the IDF. When the 2 sets of criteria were applied to a subset of obese children (BMI ≥95th percentile or BMI ≥30 kg/m2), the MetS prevalence rates were 14.8% using the AHA criteria and 18.5% using the IDF criteria. Cook et al 49 applied several different MetS criteria to the 1999-2002 NHANES data set and obtained MetS prevalence rates that ranged between 2.0% and 9.4% for a nationwide sample of 12- to 19-year-olds. In obese children, the different criteria yielded prevalence rates that varied from 12% to 44%. Olza et al 50 applied 7 different MetS definitions to data collected from a group of 478 obese children (213 females and 265 males) and found that the prevalence of MetS varied from 8.3% to 34.2%.
Although different childhood MetS definitions can result in considerable variability in prevalence rates, the same MetS definition applied to individuals within a population show relatively consistent patterns with respect to age, gender, ethnicity, and obesity status. Relative to age, Andersen et al 51 prospectively examined clustering of metabolic risk factors in 434 children starting at age 6 years and again at age 9 years. Clustering of risk factors was not observed at the earlier age, but by age 9 years the observed number of children with 3 or more risk factors was 3.3 times greater than expected if the risk factors had been independently distributed. In a cross-sectional study of 614 obese children, Sangun et al 52 observed a MetS prevalence of 33% in the 7-to 11-year-old age-group compared with 47% in those aged 12 to 18 years. When examined according to pubertal status, 30% of the prepubertal children were diagnosed with MetS whereas 47% of the pubertal children were positive for MetS.
Relative to gender, NHANES data 39 have consistently shown higher MetS prevalence in adolescent boys than girls (Table 3). In a non-US population, Barzin et al 53 reported that in a group of 5439 children and adolescents aged 6 to 18 years, MetS prevalence was 13.2% in boys and 11.8% in girls.
Prevalence of Metabolic Syndrome in US Adolescents by Gender. a
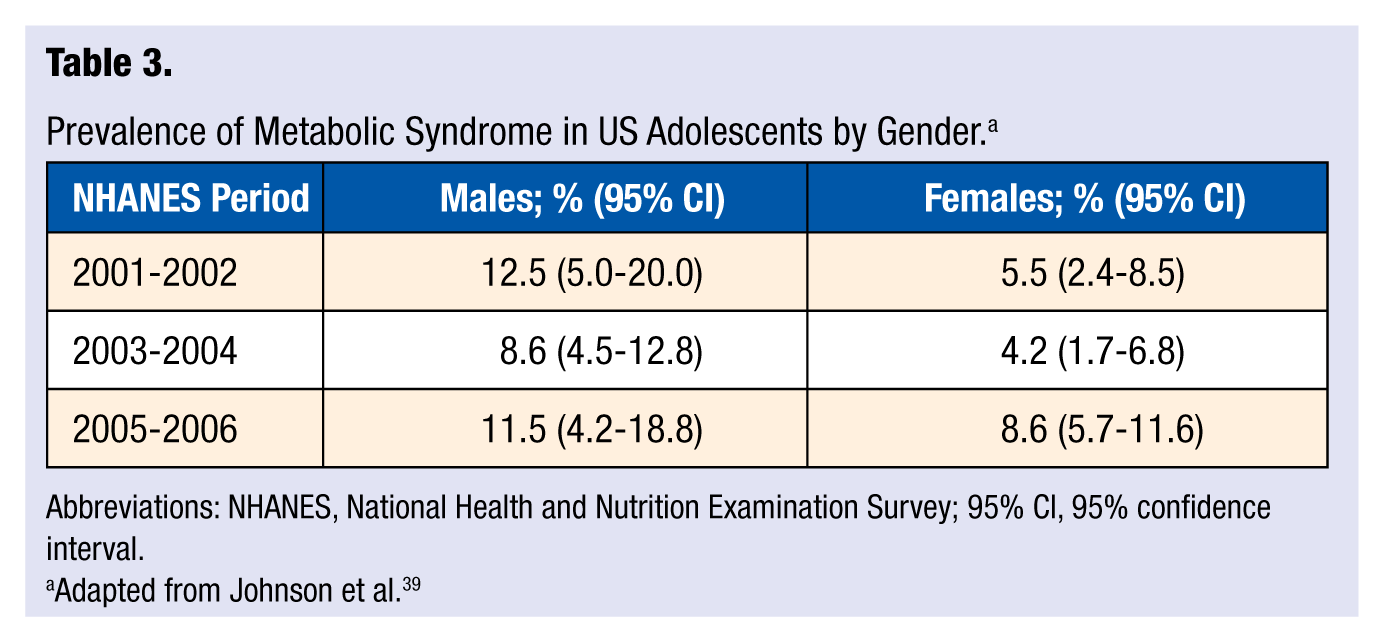
Abbreviations: NHANES, National Health and Nutrition Examination Survey; 95% CI, 95% confidence interval.
Adapted from Johnson et al. 39
Relative to ethnicity, several group differences have been observed. The NHANES data encompassing 2001-200639 show the MetS prevalence for adolescents to be 11.2% for Hispanics, 8.9% for whites, and 4.0% for blacks. Weiss et al 54 reported an overall MetS prevalence of 47.9% in a group of severely obese adolescents but a prevalence of only 39% in severely obese blacks.
Obesity has been consistently associated with increased MetS prevalence in childhood. Using IDF criteria, Goodman et al 48 observed a MetS prevalence of 18.5% in a subset of obese students (BMI ≥95th percentile or BMI ≥30 kg/m2) compared with a prevalence of 4.5% in the general population. Using NHANES data, Cook et al 43 reported that MetS was present in 28.7% of overweight adolescents (BMI ≥95th percentile), compared with 6.8% of at-risk adolescents (BMI = 85th to <95th percentile) and 0.1% in adolescents with a BMI less than the 85th percentile. Elizondo-Montemayor et al 55 studied 261 Mexican children across a continuum of BMI z scores and observed a MetS prevalence of 0% in normal weight children (BMI z score <1.0), a prevalence of 11% in overweight children (BMI z score of 1.0-1.9), a prevalence of 42.6% in moderately obese children (BMI z score of 2.0-2.5), and a prevalence of 73.9% in severely obese children (BMI z score >2.5).
It is not clear whether the prevalence of childhood MetS is continuing to increase or has stabilized. Elizondo-Montemayor et al 55 noted a 37% increase in MetS among Mexican children between 1999 and 2006. On the other hand, the NHANES data for 2001-2006 (Table 2) for US adolescents seem inconclusive. 39 As with childhood obesity rates, MetS prevalence rates are unacceptably high.
Consequences of Childhood Metabolic Syndrome
Presence of the MetS in childhood is an important health consideration, both during childhood and projected later into life. Iannuzzi et al 56 found that children meeting the diagnostic criteria for MetS had higher common carotid artery stiffness and higher C-reactive protein concentrations than children without the MetS. Morrison et al 57 analyzed data from the National Heart Lung and Blood Institute Lipid Research Clinics Princeton Prevalence Study and Princeton Follow-up Study and found that children with MetS were 9.4 times more likely to develop adult MetS and 11.5 times more likely to develop type 2 diabetes mellitus 2 to 3 decades after childhood. Because components of the MetS tend to track from childhood to adulthood, primary prevention of their development or early reversal of their presence in childhood should be of paramount importance. 38
Prevention of Childhood Metabolic Syndrome
While innate factors such as gender, age, and ethnicity affect MetS prevalence, 2 important lifestyle correlates of MetS are diet and physical activity. Relative to diet, the role of dietary fiber appears be of particular importance. For example, Carlson et al 58 examined the association between MetS and dietary fiber, saturated fat, and cholesterol intake in 2128 adolescents (aged 12-19 years) from the 1999-2002 NHANES database. After controlling for the effects of age, gender, ethnicity, and family income using multivariate logistic regression, the analysis indicated that intake of dietary fiber, but not intake of saturated fat or cholesterol, was significantly, and inversely, associated (P < .001) with the presence of MetS. The odds of the presence of MetS was reduced by approximately 20% for each quintile increase in fiber index score (grams of fiber/1000 kcal). The authors suggested that dietary fiber might affect the risk for MetS through its positive impact on body weight, waist circumference, blood glucose, and blood lipids. In a study 59 of 109 overweight Hispanic children 10 to 17 years old, as little as a 1.1 g difference in soluble fiber intake distinguished between subjects with 3 features of the MetS and those with no features of MetS. Dietary intake of cholesterol was not associated with MetS in these subjects. The authors of both studies recommended a dietary strategy for adolescents that emphasizes a positive message of including fiber-rich foods (eg, fruits and vegetables) in the diet as opposed to focusing on restriction or exclusion of foods based on fat or cholesterol content.
Physical activity and aerobic fitness have also emerged as an important correlates of childhood MetS, at least cross-sectionally. In their recent review of the influence of physical activity on MetS in youth, McMurray and Andersen 42 found that in studies that assessed physical activity in children using accelerometry (as opposed to less precise recall questionnaires), low levels of physical activity were consistently associated with increased risk of developing MetS. High levels of moderate and vigorous physical activity were associated with reduced MetS risk. Similarly, low levels of aerobic fitness increased the likelihood of MetS. They also reported that these associations appeared to be independent of obesity. Ekelund et al 60 used meta-analysis to examine associations between MetS risk factors and accelerometer-derived time spent in moderate-to-vigorous physical activity or in sedentary behaviors. Data were pooled from 14 studies from 1998 to 2009 and included 20 871 children aged 4 to 18 years from Australia, Brazil, Europe, and the United States. Time spend in moderate-to-vigorous physical activity was significantly associated with all cardiometabolic outcomes independent of age or gender. Waist circumference differed by as much as 5.6 cm between those in the top tertiles of moderate-to-vigorous physical activity compared with those in the bottom tertiles. The authors noted that the magnitude of differences in cardiometabolic risk factors between high- and low-active youth appears clinically significantly. On the other hand, sedentary time was not associated with any cardiometabolic outcome independent of time in moderate-to-vigorous physical activity.
Data from 2 recent studies suggest that (a) vigorous physical activity may be especially efficacious for children 61 and (b) aerobic fitness may be a more important correlate of MetS than physical activity per se. 51 As for the potential importance of vigorous physical activity, Hong et al 61 examined 275 youth aged 12 to 13 years and found that although low, moderate, and vigorous physical activity (measured by accelerometry) were all significantly lower in children with high versus low MetS risk scores, stepwise multiple regression analysis revealed that only vigorous physical activity was retained in the final prediction model for MetS risk score (along with aerobic fitness and serum leptin concentration). At the same time, Andersen et al 51 found that in a group of 434 nine-year-old children, aerobic fitness as determined by a treadmill test was more highly correlated (r = −0.49, P < .001) with MetS risk score than was physical activity as measured by accelerometry (r = 0.11, P < .05). In addition, children in the lowest quartile of aerobic fitness were 34.4 times more likely to have a poor MetS risk score compared with children in the highest aerobic fitness quartile. Children in the lowest physical activity quartile were only 1.1 times more likely to have a poor MetS risk score compared with children in the highest physical activity quartile.
Treatment of Childhood Metabolic Syndrome
Since obesity is related to all MetS risk factors, it has been suggested that interventions targeting MetS should focus on obesity and emphasize good nutrition and physical activity.38,42 The number of such interventions is limited, however. Coppen et al 62 examined the impact on MetS of a 10-week medically supervised weight loss intervention that emphasized healthy eating and increased physical activity (at least 10 000 steps per day) in a group of 53 children and adolescents (aged 6-19 years) diagnosed with MetS. Forty (75.5%) of the participants no longer had MetS after completion of the intervention. Of the 13 who still had MetS following the intervention, the mean number of MetS components declined from 3.8 to 3.3. Reinehr et al 63 examined changes in the prevalence of MetS in 288 obese adolescents aged 10 to 16 years assigned to a year-long lifestyle intervention that emphasized improved diet and increased physical activity. Changes were compared with a group of 186 similarly aged obese adolescents not receiving the intervention. Prevalence of the MetS (using IDF criteria) declined in the intervention group from 20% at baseline to 10% after 1 year. No decline in MetS prevalence was observed in the control group. Change in MetS prevalence was a function of change in z-BMI. In the 69 adolescents with a z-BMI reduction of between 0.25 and 0.50, MetS prevalence declined from 19% at baseline to 10% one year later. In the 50 adolescents with a z-BMI reduction of ≥0.50, MetS prevalence declined from 36% at baseline to 0% one year later. Caranti et al 64 reported that the prevalence of MetS (World Health Organization criteria) declined from 27% to 8% in a group of 81 obese adolescents following a 1-year multidisciplinary intervention consisting of nutritional, exercise, behavioral, and clinical therapy.
Regarding the physical activity component of treatment, the ideal prescription in terms of frequency, intensity, and duration for affecting the MetS has not been identified. 42 The general physical activity recommendation for children from the American College of Sports Medicine is 60 minutes per day of moderate-to-vigorous physical activity. 65 In addition, a recent intervention by de Mello et al 66 suggests that including resistance training in the exercise component may be beneficial. Prevalence of the MetS (IDF criteria) was resolved in 12 out of 15 obese adolescents after 1 year of following an interdisciplinary therapy that included only aerobic exercise. In a second group, MetS was resolved in all 15 obese adolescents after 1 year of following an identical therapy with the exception that it also included a resistance training component.
A recent AHA special committee report 40 summarized its recommendations regarding the physical activity component for treatment of MetS in children as follows:
Obtain a specific physical activity history for each child, focusing on time spent in active play and screen time (television + computer + video games)
Set as a goal ≥1 hour of active play per day
Limit total screen time to ≤2 hours per day
Encourage physical activity at every encounter
Future Metabolic Syndrome Directions
Although much progress has been made in our understanding of childhood MetS, additional research is needed in a number of areas. A more in-depth understanding is needed of the ethnic disparities associated with childhood MetS. 39 A better understanding of the role of adipocytokines such as leptin and adiponectin in childhood MetS could affect eventual screening and treatment strategies.40,45 Also, it is not clear whether there is an optimal physical activity recommendation for preventing and treating childhood MetS or whether it might differ in a meaningful way from the general physical activity recommendation for children. 42 Specific areas of research need identified in the AHA special report 40 on childhood MetS include the following:
Large-scale observational/outcomes studies on the stability of MetS phenotypes in childhood and adolescence
Studies of the molecular basis of childhood MetS
Studies of environmental exposures and toxins and their role in promoting childhood MetS
Studies of genetic predisposition and the prenatal and neonatal milieu in promoting future insulin resistance and MetS
Conclusions
Childhood obesity and the MetS represent significant challenges to the health care community. Prevalence rates are unacceptably high for both conditions. There appears to be unanimity that the twin lifestyle behaviors of good nutrition and habitual physical activity are the cornerstones of prevention and treatment efforts for both conditions. If we are to avoid the reality of the dire projection that because of obesity the current generation of children in America may become the first to have a shorter life expectancy than their parents, 67 increased research efforts and continued vigilance regarding childhood obesity and the MetS are essential.