
Abstract
Background. People living with HIV (PLWH) have increased risk of cardiovascular disease (CVD). Dietary behavior modification may assist in the treatment of CVD, but the optimal dose of nutrition education is unknown. The current aim was to determine if a weekly 1-hour nutrition education program would improve multiple outcomes among PLWH. Methods. Participants (n = 62) were assessed on dietary intake, serum biomarkers, and physical characteristics at baseline and 3 months, and percent change was calculated. Participants were grouped into 3 attendance categories of the classes: none, fair, or good. Analyses of covariance were performed on the outcomes. Results. Calories, protein, fat, saturated fat, carbohydrate, sugar, added sugar, and glycemic load were significantly different (all P values <.05). Those who attended no class typically had increases in these variables versus those with fair or good attendance. High-density lipoprotein cholesterol (HDL-C; P = .006) and total cholesterol/HDL-C ratio (P = .083) were different, as those who attended no class or had fair attendance worsened, but those with good attendance improved. Conclusions. Several outcomes improved more so among those with good class attendance versus those with either fair or no attendance. Thus, an interactive nutrition education program may be an effective tool to help improve the health of PLWH.
‘Dietary behavior modification may be a useful adjunct in the treatment of HIV disease.’
Chronic diseases cause 7 out of 10 deaths in the United States today, killing more than 1.7 million Americans each year, 1 and they occur largely due to lifestyle. Diet-related factors are arguably the most important modifiable behaviors for lowering the overall risk of chronic diseases. 2 Unfortunately, much of the nutrition information in the mass media is confusing to the average person due to the vast differences in research and evolving public health messages over time, for example, the daily recommended/allowable amount of salt, saturated fat, and cholesterol. Nonetheless, a comprehensive nutrition education program, covering a wide variety of topics, including clearing confusion and addressing myths, can be effective for improving habits and clinical outcomes.3,4
Over 1 million people are living with HIV (PLWH) in the United States. 5 This lifelong condition and the use of antiretroviral therapy (ART) contribute to a greater incidence of cardiometabolic abnormalities known to be risk factors for diabetes and cardiovascular events in this population. 6 Studies conducted before the widespread use of ART suggest that HIV infection is associated with a pro-atherogenic lipid profile, characterized by an increase in insulin resistance and triglycerides (TG), a decrease in high-density lipoprotein cholesterol (HDL-C), and the presence of small, dense low-density lipoprotein cholesterol (LDL-C) particles.7,8 The addition of ART, particularly protease inhibitors (PIs), has had further deleterious effects on related risk factors, such as hyperlipidemia.9,10 The initiation of PI-based ART is also associated with the development of insulin resistance in 25% to 62% of PLWH and the development of overt new-onset diabetes mellitus in 6% to 7%.11,12
Dietary behavior modification may be a useful adjunct in the treatment of HIV disease.13,14 It is effective for reducing the risks of heart disease and diabetes by improving lipid and glucose control without side effects. 15 Body mass index (BMI), waist circumference, blood pressure, LDL-C, total cholesterol (T-Chol), and quality of life have also improved in PLWH in response to dietary change.16-19 Nonetheless, to be ultimately effective, it is important for a nutrition education program to be comprehensive and cover many topics of interest, to dispel myths, to separate marketing and hype from science, and to demonstrate practical ways to eat healthy. The purpose of the current study was to determine if a weekly 1-hour nutrition education program would improve dietary behaviors, nutritional factors, serum biomarkers, and physical characteristics among a mostly minority sample of PLWH in 3 months.
Methods
Healthy Living for Better Days was a 12-month nutrition education program to improve the cardiovascular health of PLWH of predominantly low socioeconomic status. Recruitment commenced in March 2013, and enrollment closed in November 2013. The program was approved by the institutional review board for human subjects research at the University of Miami Miller School of Medicine (ID# 20121029) and was conducted in accordance with the ethical standards of the Declarations of Helsinki. All participants signed informed consent and HIPAA (Health Insurance Portability and Accountability Act) forms before enrolling in the program.
Eighty-nine HIV+ subjects were enrolled in the program after referral from the Special Immunology Clinic at University of Miami Miller School of Medicine/Jackson Health System and other local clinics. Inclusion criteria included (1) confirmed HIV by external laboratory reports from the referring physician, (2) men or women ≥18 years of age, and (3) ability to attend weekly sessions at the University of Miami. Exclusion criteria included (1) any medical condition in which participation would be contraindicated and (2) pregnancy for women.
Nutrition Education Program
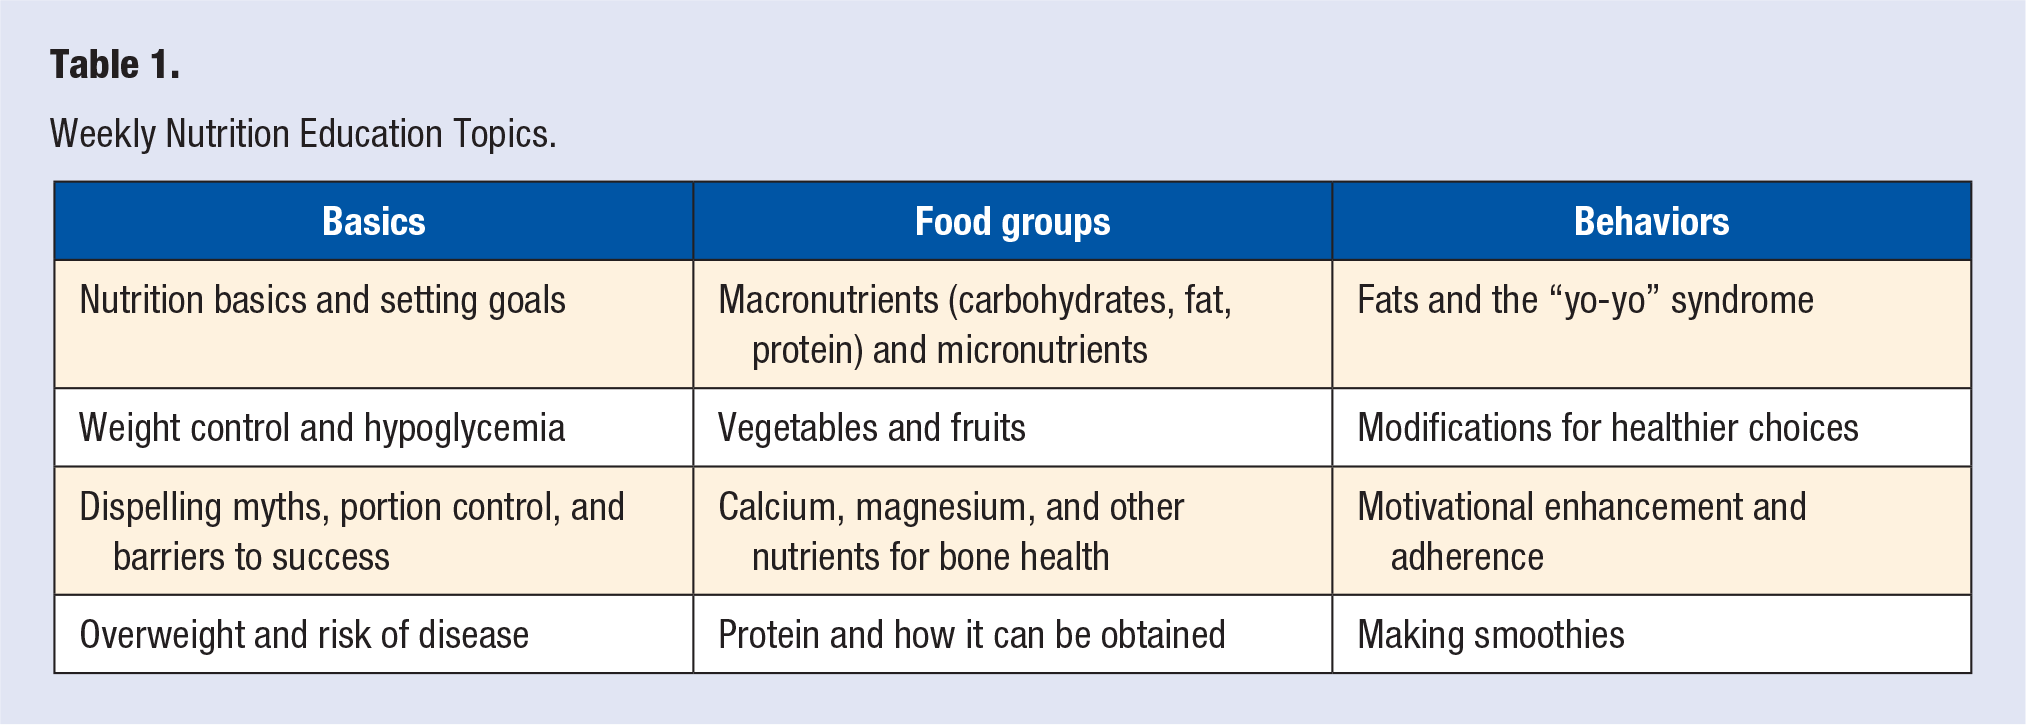
The program included a weekly 1-hour nutrition education and food preparation demonstration class. Experiential, firsthand observation and hands-on completion of tasks (eg, preparing a salad or a smoothie or selecting foods at a grocery store) were accentuated to enhance learning and promote adherence. The emphasis of the classes was to select and prepare not only healthy but also affordable foods (eg, healthy items, easy-to-prepare, and under $5 per serving to account for the socioeconomic status of the participants). Information was presented in an easily understandable format underscored with a science base by our team who has training and experience not only in nutrition but also in curriculum development, educational delivery, and program evaluation. Table 1 shows the weekly topics of the program.
Weekly Nutrition Education Topics.
Nutrition Education Program Attendance
Attendance of classes was optional, but strongly encouraged. Attendance was recorded every week between baseline and the 3-month follow-up assessment and was used to create these attendance groups for analysis: (1) none (no classes attended), (2) fair (1-3 classes attended), and (3) good (4 or more classes attended).
Assessments
Outcome variables were obtained with questionnaires, blood sampling, and physical evaluations by trained investigators using standard techniques. Participants completed a sociodemographic and health history questionnaire at baseline that included age, gender, race/ethnicity, employment status, the use of lipid-lowering, antihypertensive, diabetes, and PIs/ART HIV medications, and years since HIV diagnosis.
Dietary Intake Variables
Dietary intake was collected at baseline and 3-month follow-up using a self-report Block Brief Food Frequency 55-item questionnaire 20 that asked participants their usual intake over the previous year. Individual portion size was asked for each food, and pictures were provided to improve the accuracy of responses. The data were analyzed by NutritionQuest (Berkeley, CA) to determine average daily consumption of the following: total calories (kcal), protein (g), total fat (g), saturated fat (g), trans fat (g), carbohydrates (g; including naturally occurring sugar and added sugar), sugar (g; simple sugars, eg, sucrose), added sugar (g; sugar and syrup added to food and beverages during processing), fiber (g), fruits (cup equivalent), vegetables (cup equivalent), combined fruits and vegetables (cup equivalent), average daily glycemic load (GL; g), and average daily glycemic index (GI; g).
Serum Biomarkers
Blood was drawn during the morning in at least an 8-hour fasted state at baseline and 3-month follow-up. Chemistry and immunoassays were performed by an automated analyzer (Roche Cobas-6000; Roche Diagnostics) utilizing the manufacturer’s reagents and following manufacturer’s instructions. Serum was used to quantify C-reactive protein (CRP) in a high sensitivity latex-particle enhanced immunoturbidimetric assay with a detection limit of 0.1 mg/L with intra- and interassay coefficients of variations of 1.1% and 2.2%, respectively. T-Chol and TG were determined in serum or plasma by enzymatic, colorimetric assays. Intra- and interassay coefficients of variation were 0.7% and 1.8%, respectively, for T-Chol and 0.9% and 2.3%, respectively, for TG. HDL-C was measured using a third-generation homogeneous enzymatic colorimetric assay, and the intra- and interassay coefficients of variations were 0.6% and 1.9%, respectively. LDL-C was calculated using the Friedewald formula: LDL-C = T-Chol − (HDL-C − 0.20 × TG). Very low-density lipoprotein cholesterol (VLDL-C) was calculated as TG divided by 5, unless TG exceeded 400 mg/dL in which case it was measured by enzymatic methods (Vitros 750 Analyzer, Johnson & Johnson). Fasting glucose was measured by the hexokinase method with intra- and interassay coefficients of variations as 1.9% and 2.7%, respectively. Fasting insulin was measured by laboratory analysis. Homeostatic model assessment for insulin resistance (HOMA-IR) was calculated according to the formula: fasting insulin (µU/L) × fasting glucose (nmol/L)/22.5. 21 Hemoglobin A1c (HbA1c) in whole blood was measured by high-performance liquid chromatography using a fully automated analyzer (Variant II Hemoglobin Testing System, BioRad), and intra- and interassay coefficients of variations were 1.7% and 2.0%, respectively.
Physical Characteristics
All physical characteristics were measured at baseline and 3-month follow-up. Systolic blood pressure (SBP), diastolic blood pressure (DBP), and resting heart rate (RHR) were recorded with an automatic oscillometric device (Omron BP monitor). Three readings were made with subjects seated after resting for 5 minutes. The average of the second and third readings was used in the analysis. Waist circumference was measured in inches at the narrowest point halfway between the lowest rib and iliac crest, and hip circumference was measured in inches at the widest point of the pelvis. Waist circumference was divided by hip circumference to obtain the waist to hip ratio (WHR). Weight and height were documented to the nearest 0.1 kg and 0.1 cm, respectively, to calculate BMI.
Statistical Analyses
Frequency and descriptive statistics were calculated on all variables by attendance group. To account for large variance in dietary intake variables that typically occurs in free-living individuals, skew and kurtosis were examined, and, if necessary, variables were normalized by substituting outliers with the last normal value within 3 standard deviations of the mean. Resulting transformed normal variables were used in subsequent analyses. Chi-squares (for degree of association of categorical variables) and 1-way analyses of variance (ANOVAs; to assess differences in continuous variables) were used with attendance categories at baseline to assess sociodemographic variables. Percent change from baseline to 3-month follow-up was calculated on all outcome variables. One-way analyses of covariance (ANCOVAs) were used to compare the difference in all outcome variables with the attendance variable (ie, no, fair, or good attendance) as the between-subjects factor and with age as the covariate, given its significant difference among attendance groups. For any significant F value, post hoc multiple comparisons using the least squared difference were performed to determine pairwise mean differences (MD) between the attendance categories. IBM SPSS 26 for Windows (IBM, Inc) was used for all statistical analyses, and α ≤ .05 was considered significant.
Results
Sample Demographics
Out of the 89 subjects enrolled in the program, class attendance data were available for 62 subjects at both baseline and 3-month follow-up. These subjects were used for all subsequent analyses. Table 2 shows the descriptive information of the sample for age, gender, race/ethnicity, and employment status. Apart from age (F[2, 61] = 4.6, P = .01), all other sociodemographic and health history variables were not significantly different among attendance groups. Those who attended no nutrition classes were younger than those subjects in the fair (MD = −7.3; SE = 2.4, P = .004) and good (MD = −5.7; SE = 2.4, P = .02) attendance groups.
Sociodemographic Characteristics of the Sample at Baseline.
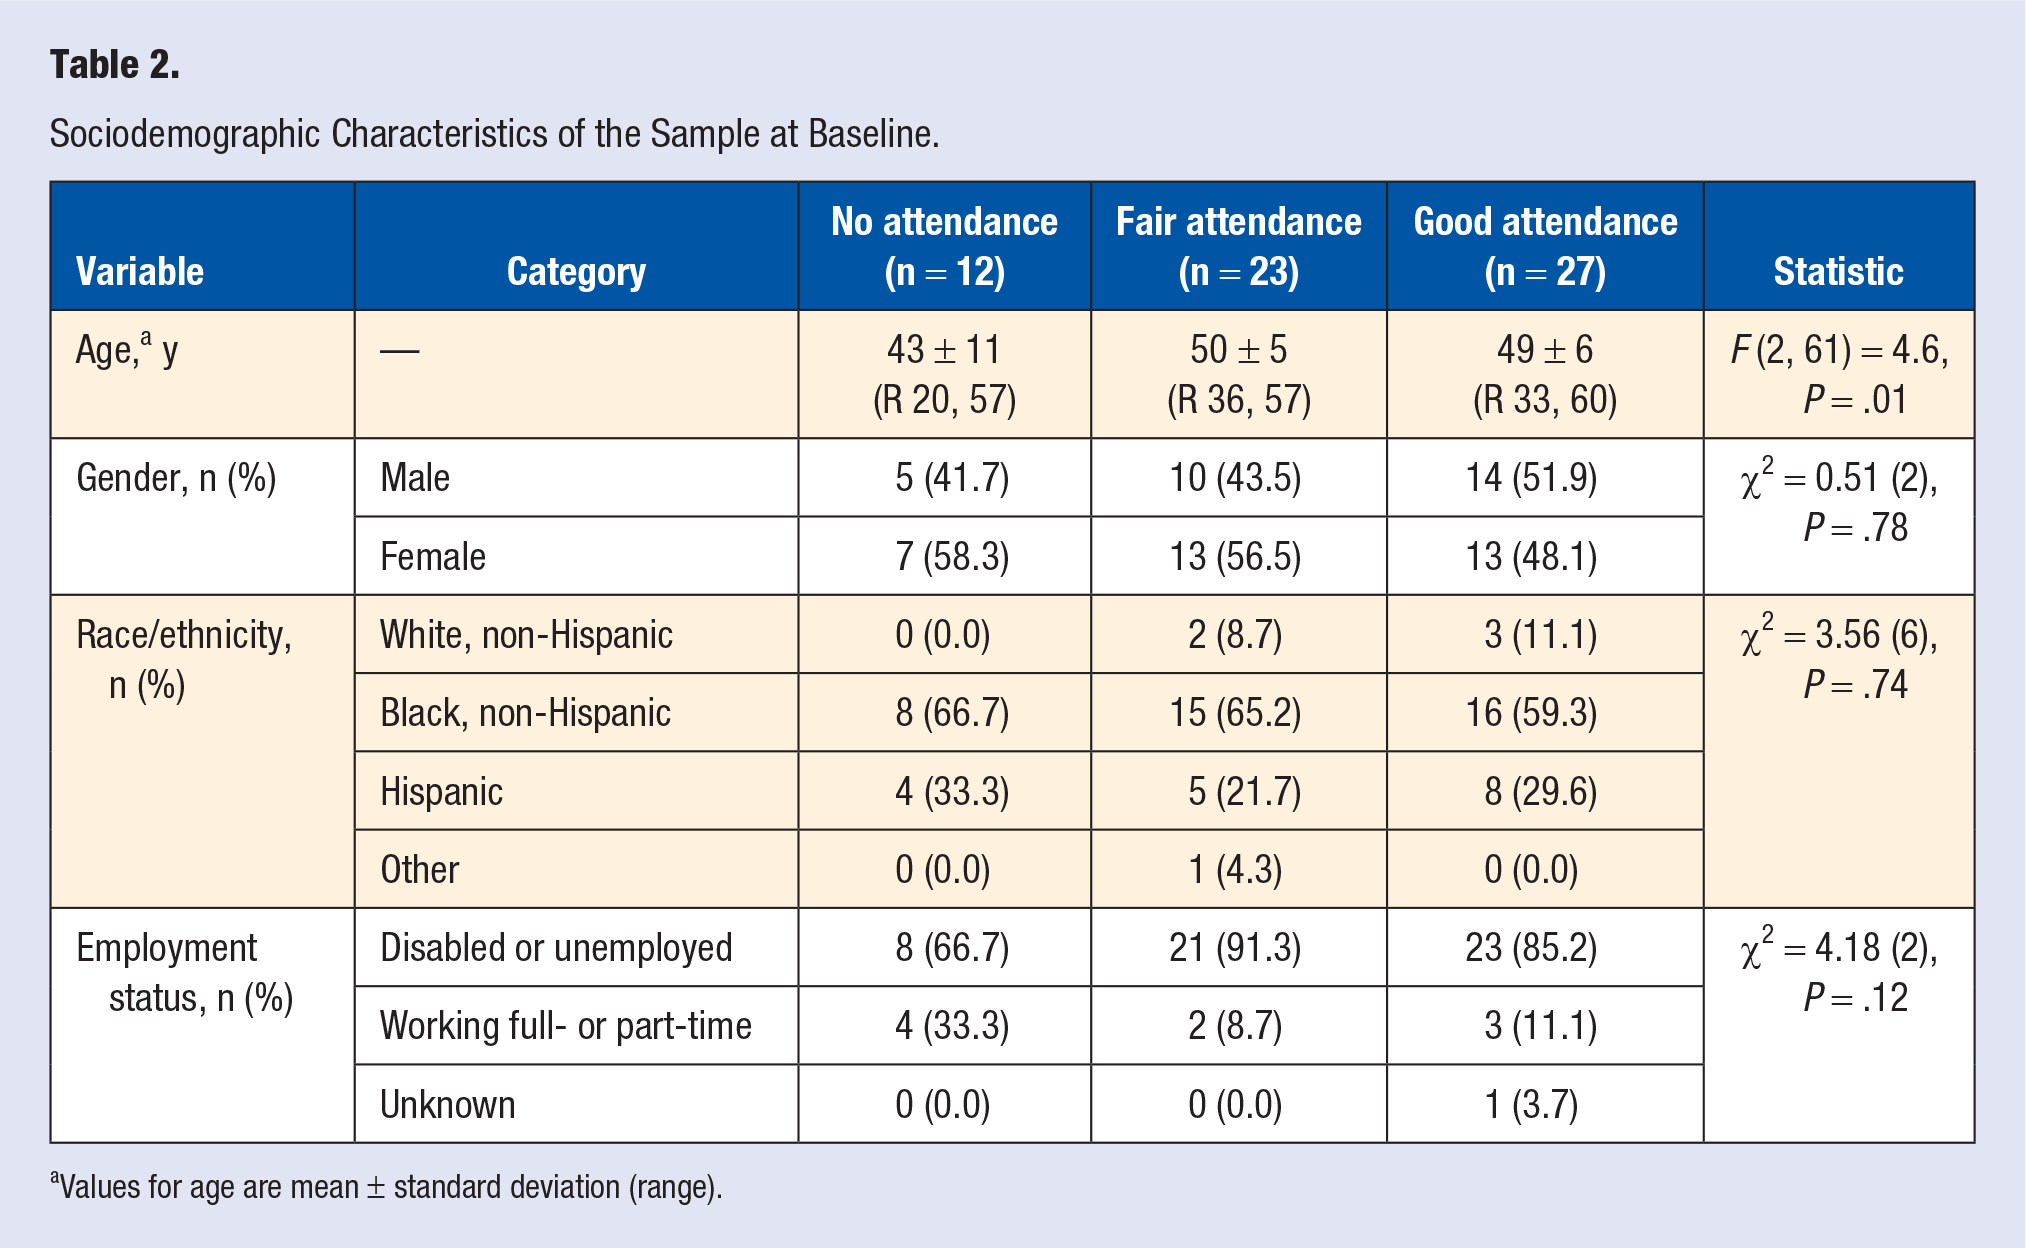
Values for age are mean ± standard deviation (range).
Analysis for Dietary Intake Factors
Table 3 displays the descriptive information for each dietary intake variable at baseline and 3-month follow-up. Percent change in total calories was significant (F[2, 50] = 7.5, P = .001), increasing in the no (M = 45.1%; SD = 77.2) and fair (M = 2.4%; SD = 57.5) attendance groups and decreasing in the good attendance group (M = −29.5%; SD = 30.3). Pairwise comparisons revealed that the no attendance group was significantly higher than the fair (MD = 50.7; SE = 21.7, P = .024) and the good (MD = 80.7; SE = 20.9, P < .001) attendance groups. Percent change in protein was significant (F[2, 50] = 8.5, P = .001), increasing in the no attendance group (M = 54.2%; SD = 90) and decreasing in the fair (M = −2.0%; SD = 64.3) and good (M = −27.5%; SD = 24.3) attendance groups. The no attendance group was significantly higher than the fair (MD = 70.3; SE = 23.4, P = .004) and good (MD = 92.6; SE = 22.5, P < .001) attendance groups. Percent change in total fat was significant (F[2, 50] = 6.7, P = .003), increasing in the no attendance group (M = 42.9%; SD = 74.3) and decreasing in the fair (M = −0.15%; SD = 64.3) and good (M = −29.7%; SD = 27.9) attendance groups. The no attendance group was significantly higher than the fair (MD = 50.9; SE = 22.4, P = .03) and good (MD = 78.6, SE = 21.6, P = .001) attendance groups. Percent change in saturated fat was significant (F[2, 50] = 5.7, P = .006), increasing in the no attendance group (M = 31.6%; SD = 64.7) and decreasing in the fair (M = −8.4%; SD = 59.8) and good (M = −30.7%; SD = 32.6) attendance groups. The no attendance group was significantly higher than the fair (MD = 48.1; SE = 21.0, P = .03) and good (MD = 68.6; SE = 20.2, P = .001) attendance groups. Percent change in trans fat was marginally significant (F[2, 50] = 2.4, P = .10), increasing in the no (M = 54.9%; SD = 81.7) and fair (M = 22.3%; SD = 85) attendance groups and decreasing in the good attendance group (M = −14.3%; SD = 79). The no attendance group was significantly higher than the good attendance group (MD = 67.4; SE = 32.9, P = .05). Percent change in carbohydrate was significant (F[2, 50] = 4.6, P = .02), increasing in the no (M = 43.3%; SD = 80) and fair (M = 15.4%; SD = 70.2) attendance groups and decreasing in the good attendance group (M = −25.6%; SD = 42.9). The good attendance group was significantly lower than the no (MD = −71.3; SE = 26, P = .007) and fair (MD = −40.3; SE = 20, P = .05) attendance groups. Percent change in sugar was significant (F[2, 50] = 4.2, P = .02), increasing in the no (M = 36.4%; SD = 71.1) and fair (M = 14.4%; SD = 69.8) attendance groups and decreasing in the good attendance group (M = −26.2%; SD = 52). The good attendance group was significantly lower than the no (MD = −61.5; SE = 23.7, P = .01) and fair (MD = −40.9; SE = 19.0, P = .04) attendance groups. Percent change in added sugar was significant (F[2, 50] = 5.3, P = .008), increasing in the no (M = 67.0%; SD = 103.3) and fair (M = 28.7%; SD = 89.6) attendance groups and decreasing in the good attendance group (M = −32.7%; SD = 60.6). The good attendance group was significantly lower than the no (MD = −95.8; SE = 32.8, P = .005) and fair (MD = −62.6; SE = 26.2, P = .02) attendance groups. Percent change in average daily GL was significant (F[2, 50] = 4.8, P = .01), increasing in the no (M = 43.8%; SD = 79) and fair (M = 16.6%; SD = 77.3) attendance groups and decreasing in the good attendance group (M = −27.7%; SD = 39.9). The good attendance group was significantly lower than the no (MD = −74.3; SE = 25.9, P = .006) and fair (MD = −43.5; SE = 20.7, P = .04) attendance groups. Percent change in vegetable intake was marginally significant (F[2, 49] = 2.5, P = .10), increasing in the no attendance group (M = 26.9%; SD = 61.4) and decreasing in the fair (M = −17.7%; SD = 59.4) and good (M = −0.5%; SD = 56.1) attendance groups. The no attendance group was significantly higher than the fair attendance group (MD = 53.2; SE = 24.0, P = .03). Percent change in combined fruit and vegetable intake was significant (F[2, 50] = 3.3, P = .05), increasing in the no (M = 59.1%; SD = 75) and good (M = 6.6%; SD = 67.7) attendance groups and decreasing in the fair attendance group (M = −2.7%; SD = 67.7). The no attendance group was significantly higher than the fair (MD = 71.4; SE = 28.5, P = .02) and good (MD = 59.9; SE = 27.5, P = .03) attendance groups. Percent changes in fiber, fruits, and average daily GI were not significantly different among attendance groups.
Dietary Intake Factors at Baseline and 3 Months (Mean ± SD Values).
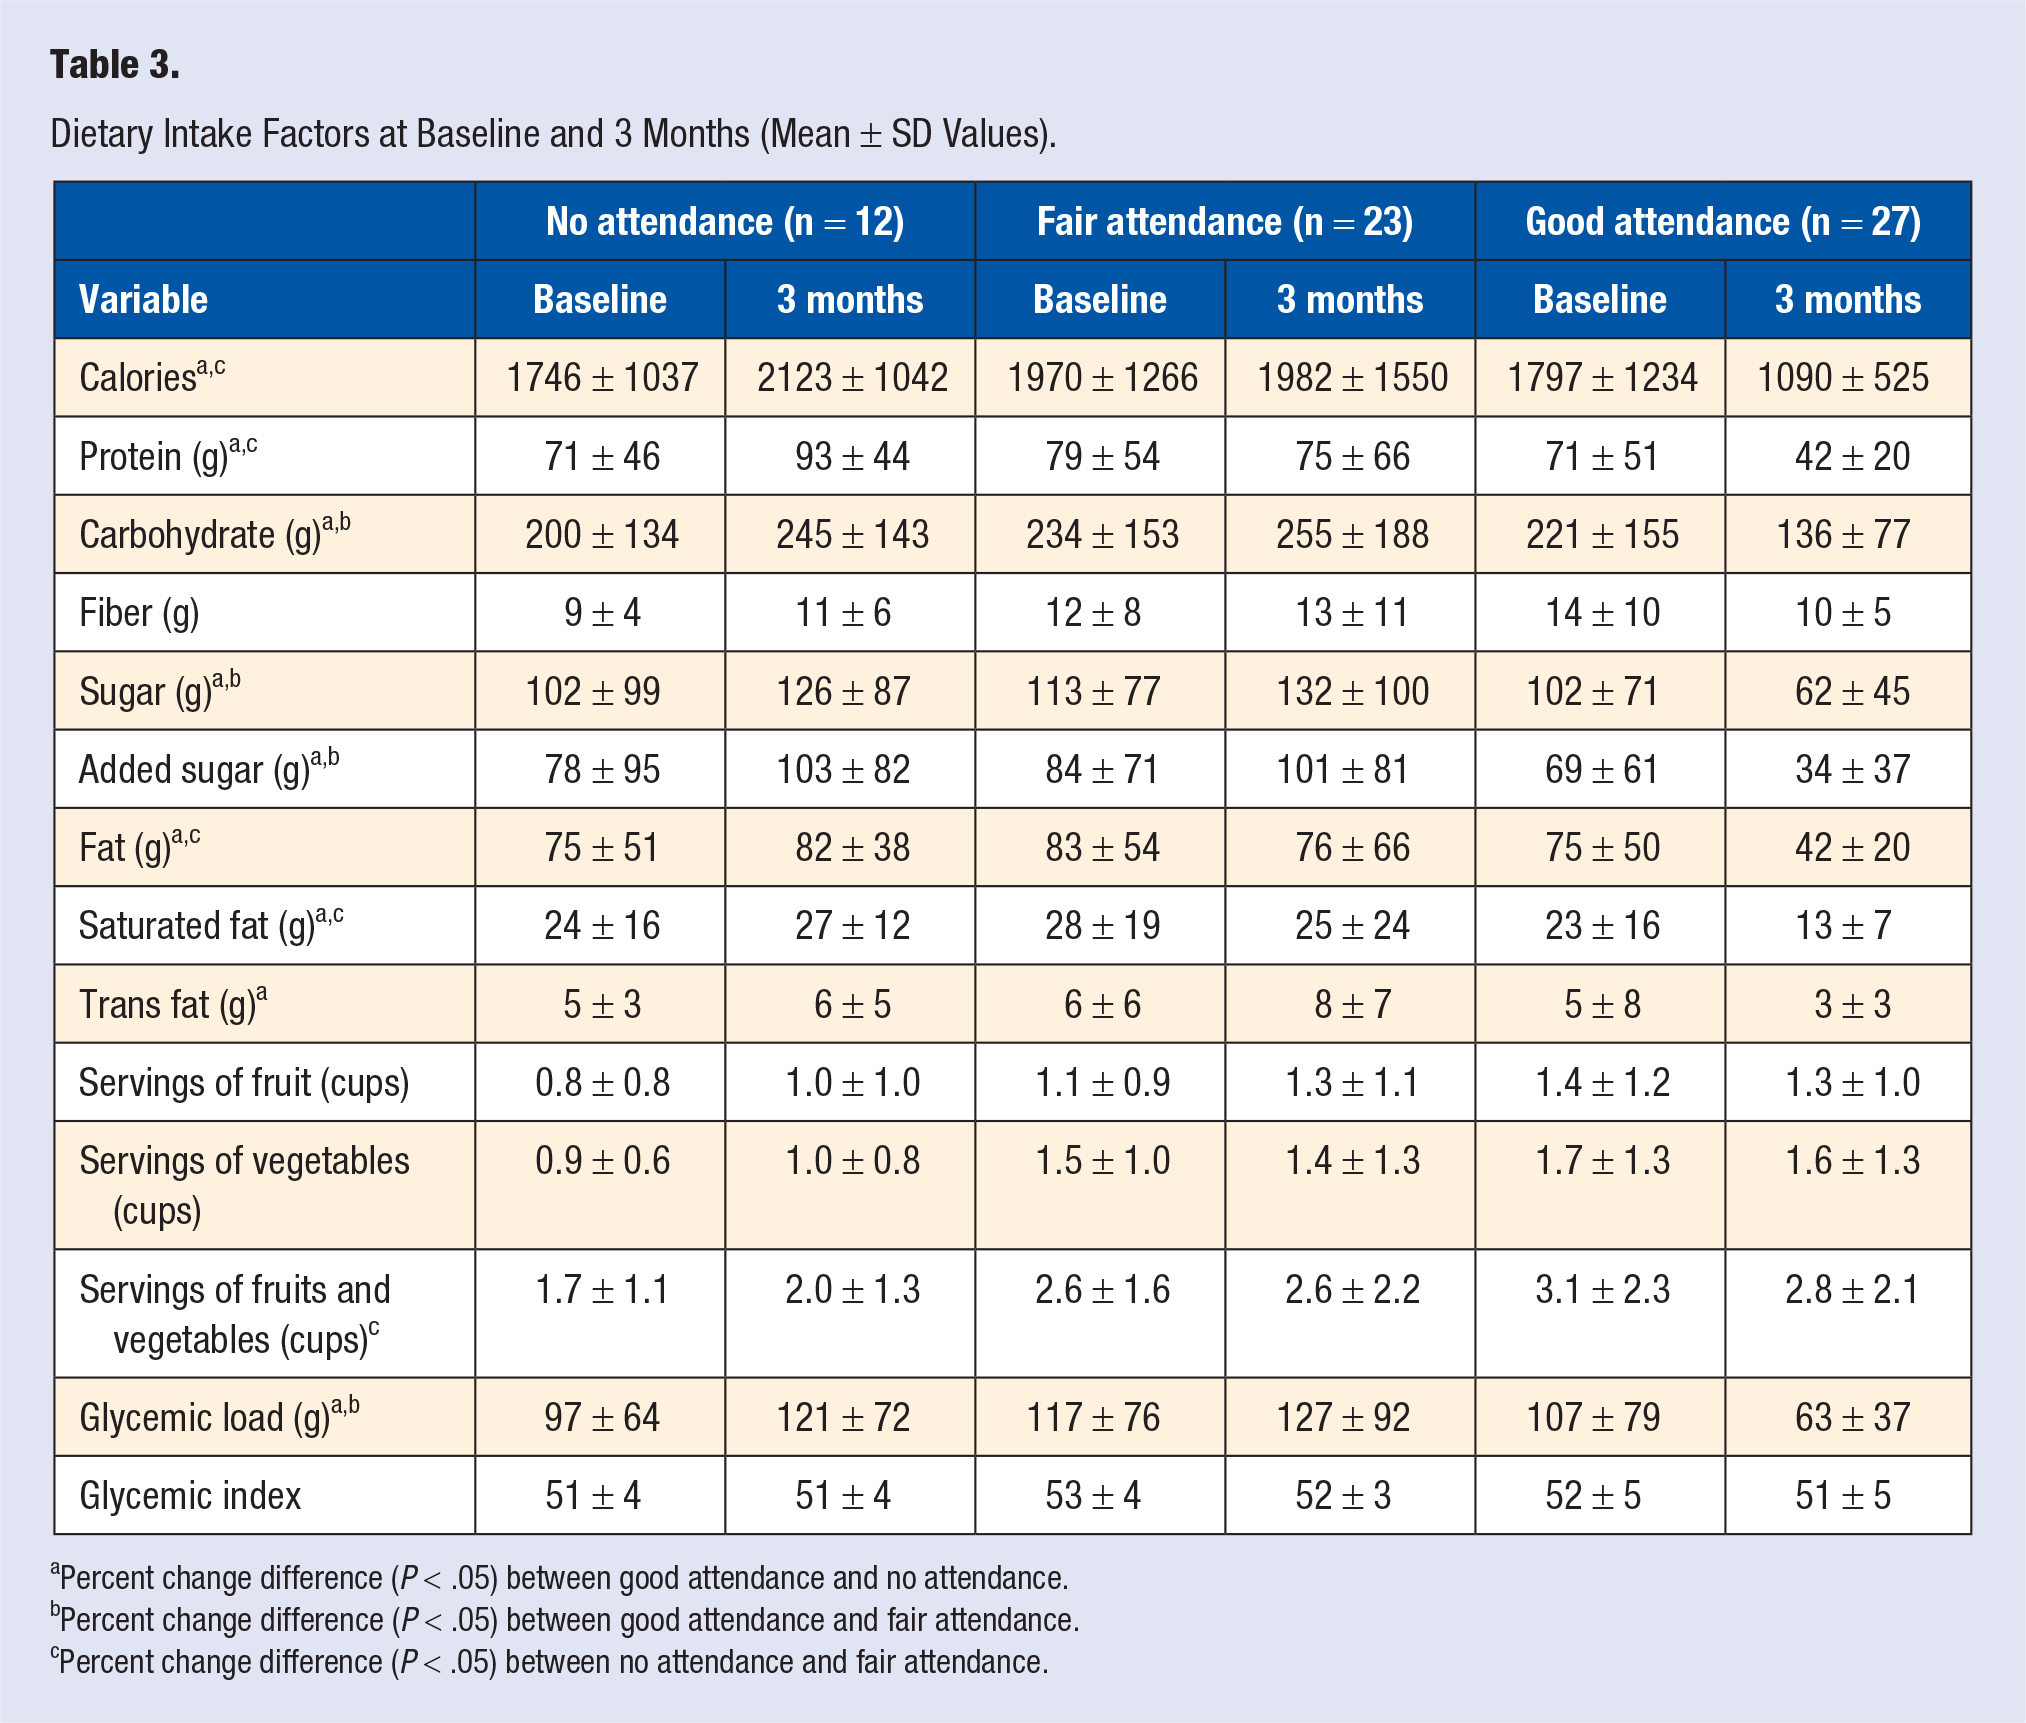
Percent change difference (P < .05) between good attendance and no attendance.
Percent change difference (P < .05) between good attendance and fair attendance.
Percent change difference (P < .05) between no attendance and fair attendance.
Analysis for Serum Biomarkers
Table 4 displays the descriptive information for each serum biomarker at baseline and 3-month follow-up. Percent change in HDL-C was significant (F[2, 61] = 5.6, P = .006), decreasing in the no (M = −10.1%; SD = 23.6) and fair (M = −6.6%; SD = 13.7) attendance groups and increasing in the good attendance group (M = 6.1%; SD = 13.2). The good attendance group was significantly higher than the no (MD = 11.9; SE = 5.8, P = .04) and fair (MD = 13.8; SE = 4.4, P = .003) attendance groups. Percent change in T-Chol/HDL-C ratio was marginally significant (F[2, 61] = 2.6, P = .08), increasing in the no (M = 13.5%; SD = 24.8) and fair (M = 5.1%; SD = 16.1) attendance groups and decreasing in the good attendance group (M = 1.8%; SD = 12.6). The good attendance group was significantly higher than the no attendance group (MD = −12.9; SE = 6.1, P = .04). Percent change in HOMA-IR was marginally significant (F[2, 59] = 2.5, P = .09), decreasing in the no (M = −1.8%; SD = 49.4) and good (M = −2.1%; SD = 48.5) attendance groups and increasing in the fair attendance group (M = 32.2%; SD = 59.8). The fair attendance group was significantly higher than the good attendance group (MD = 33.2; SE = 15.5, P = .04). The percent changes in glucose, HbA1c, T-Chol, TG, LDL-C, VLDL-C, non-HDL-C, and CRP were not significantly different among attendance groups.
Serum Biomarkers at Baseline and 3 Months (Mean ± SD Values).
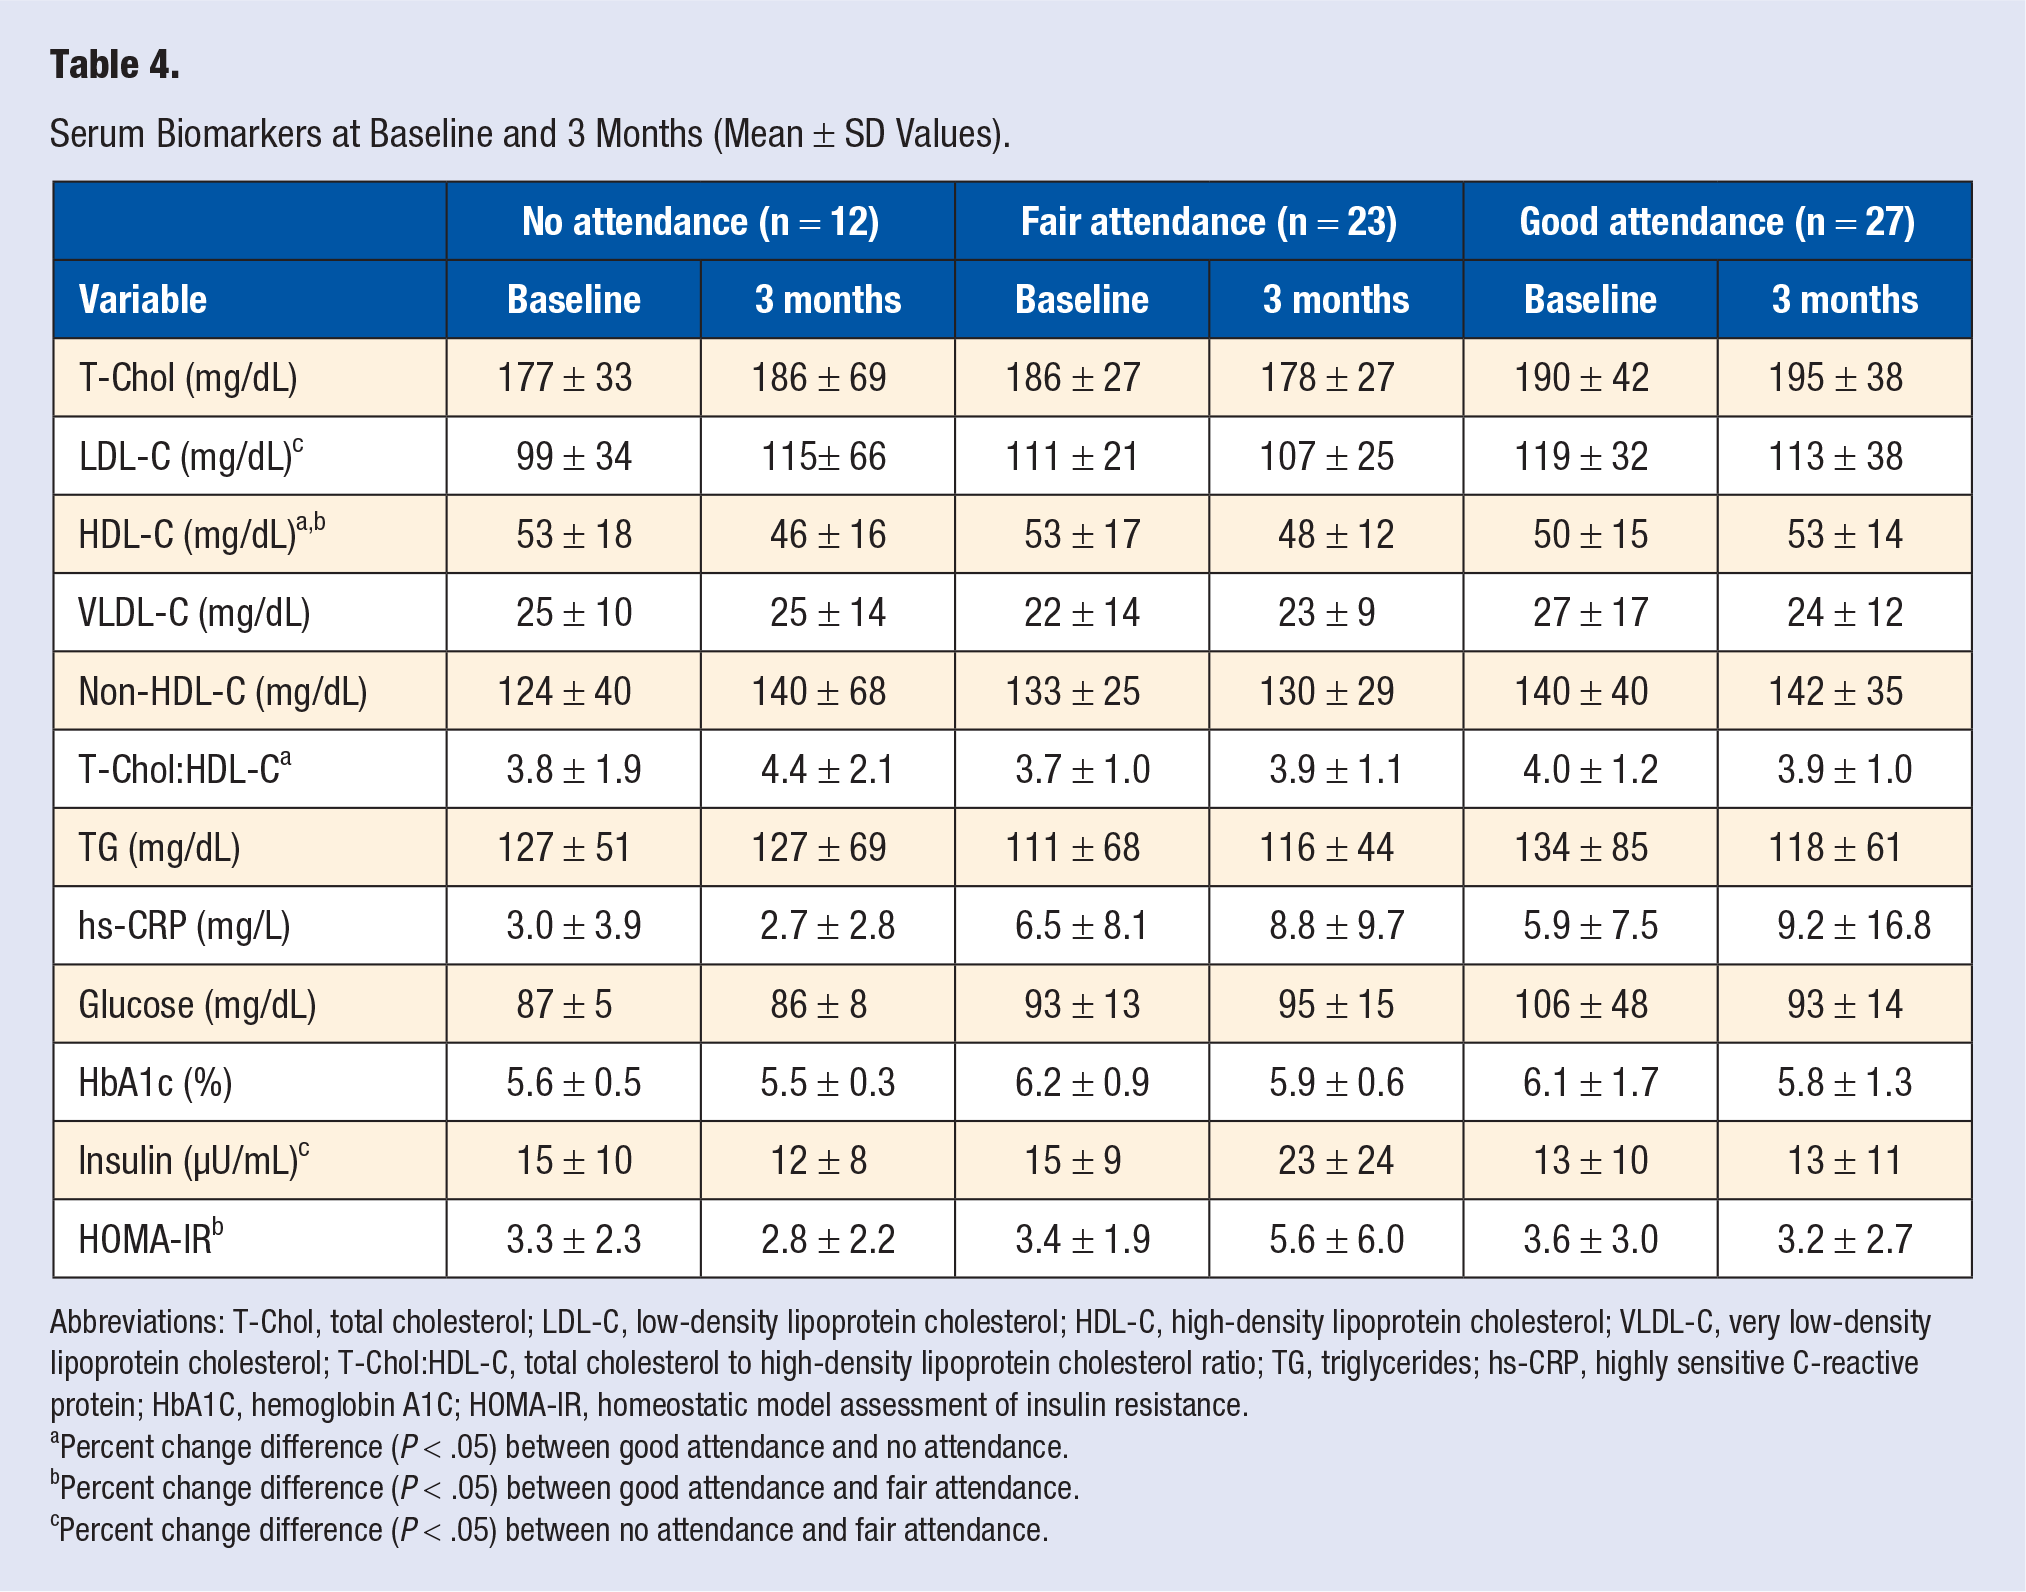
Abbreviations: T-Chol, total cholesterol; LDL-C, low-density lipoprotein cholesterol; HDL-C, high-density lipoprotein cholesterol; VLDL-C, very low-density lipoprotein cholesterol; T-Chol:HDL-C, total cholesterol to high-density lipoprotein cholesterol ratio; TG, triglycerides; hs-CRP, highly sensitive C-reactive protein; HbA1C, hemoglobin A1C; HOMA-IR, homeostatic model assessment of insulin resistance.
Percent change difference (P < .05) between good attendance and no attendance.
Percent change difference (P < .05) between good attendance and fair attendance.
Percent change difference (P < .05) between no attendance and fair attendance.
Analysis for Physical Characteristics
Table 5 displays the descriptive information for each physical characteristic at baseline and 3-month follow-up. The percent changes in SBP, DBP, RHR, weight, BMI, waist circumference, hip circumference, and WHR were not significantly different among attendance groups.
Physical Characteristics at Baseline and 3 Months (Mean ± SD Values).
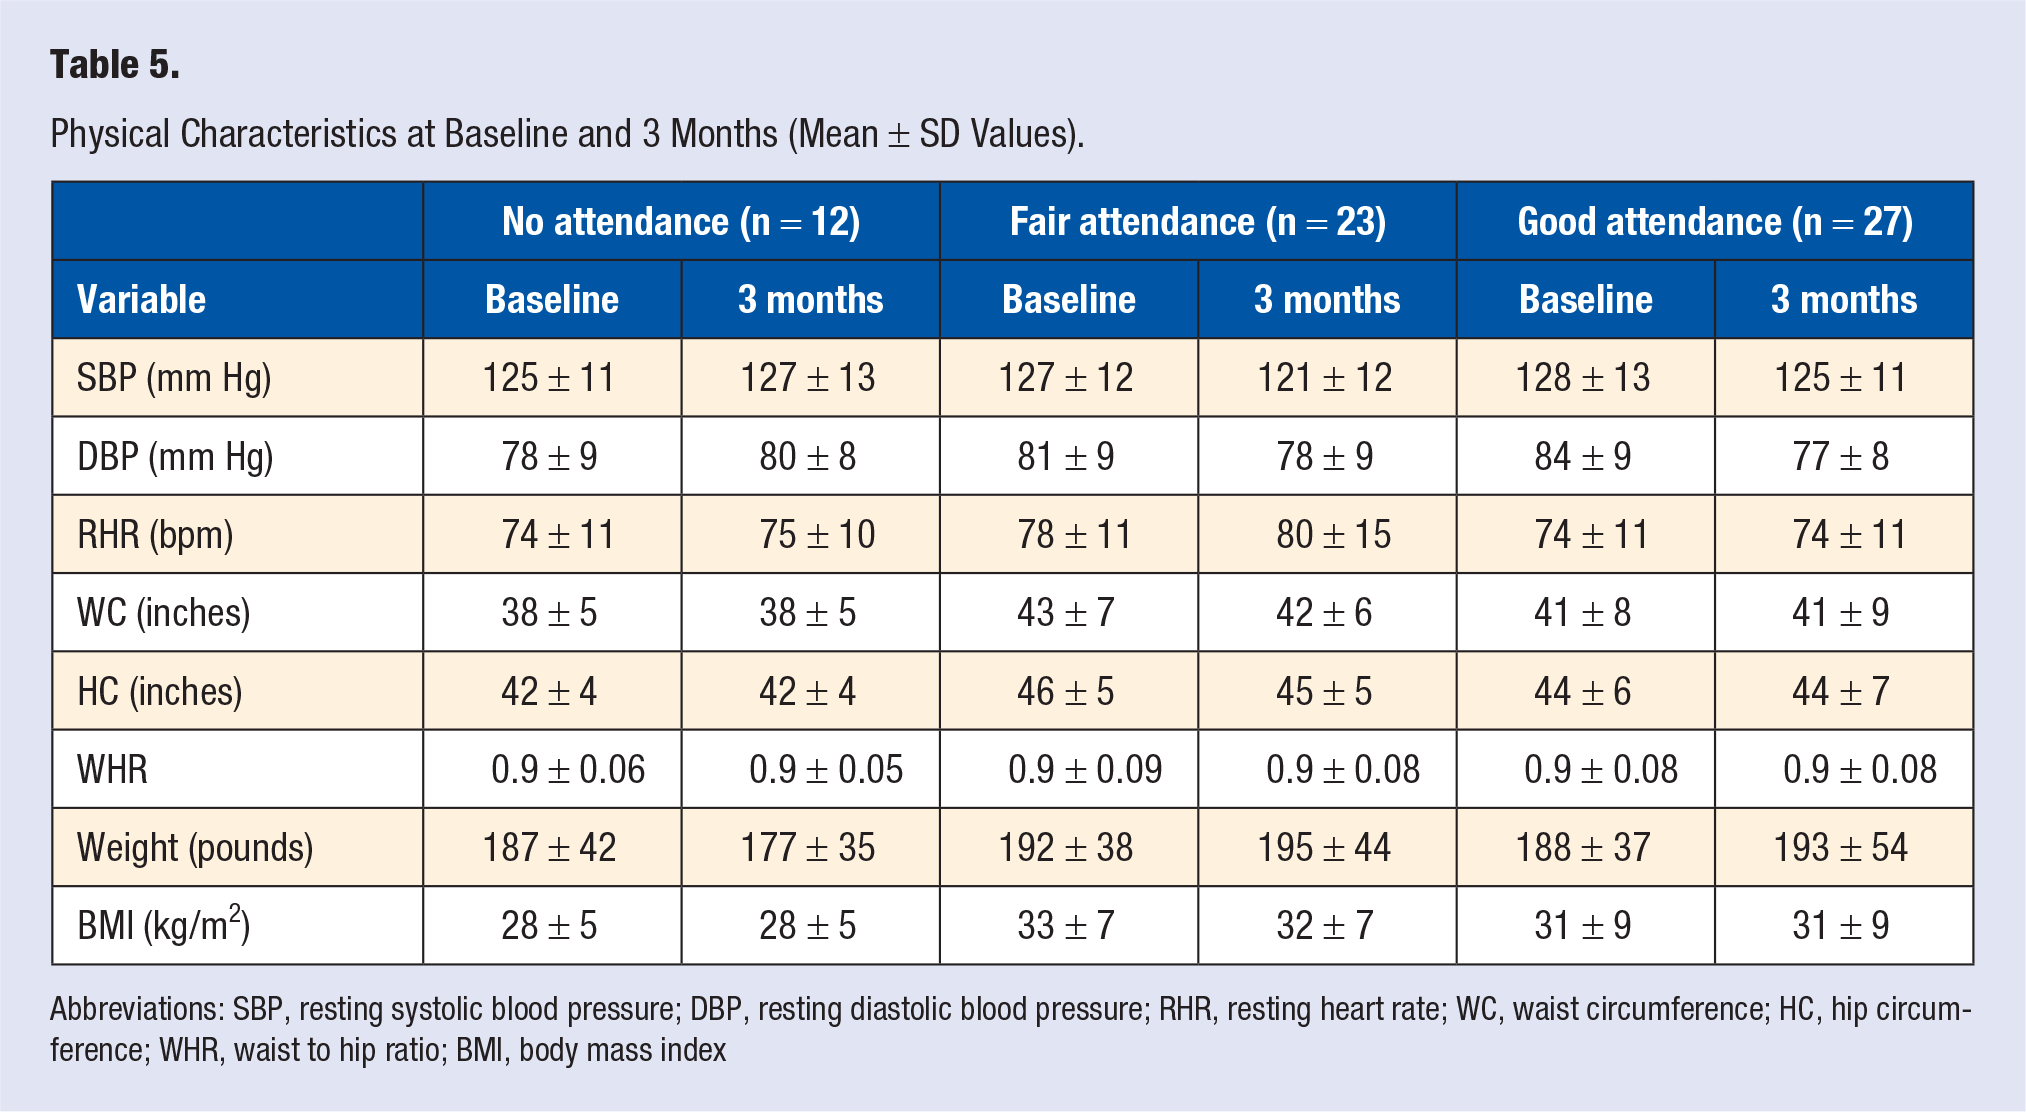
Abbreviations: SBP, resting systolic blood pressure; DBP, resting diastolic blood pressure; RHR, resting heart rate; WC, waist circumference; HC, hip circumference; WHR, waist to hip ratio; BMI, body mass index
Discussion
In this study of predominantly minority PLWH, we showed that a weekly 1-hour nutrition education and demonstration program resulted in significant improvements in dietary variables, such as total calories, protein, total fat, saturated fat, carbohydrate, sugar, added sugar, GL, and combined fruit and vegetable intake over 3 months. The changes in trans fat and vegetable intake were marginally significant. Additionally, HDL-C significantly improved, while changes in T-Chol/HDL-C ratio and HOMA-IR were moderately significant. Generally, these changes were related to frequency of the attendance of the class. Higher class attendance was associated with a more favorable health profile in both dietary behaviors and biomarkers, providing support for this kind of program as a potentially effective adjunct therapy for addressing cardiovascular disease (CVD) risk in PWLH. Our findings are encouraging because they occurred in a relatively short period of time (3 months), and no particular diet was prescribed during the intervention period. Thus, it would appear that subjects who attended more of the classes actually applied the information taught and demonstrated. Many dietary intervention studies have been conducted to improve health outcomes using difficult constraints, such as hypocaloric requirements and/or restricting one type of macronutrient or another, and they have struggled with attrition due to the requirements of the protocol.22,23 Our program may be more effective, as education is provided and hands-on skills are practiced, but the subjects can still determine how they want to eat ad libitum.
Overall, the most statistically significant changes occurred in the good attendance group. After 3 months, the good attendance group had the greatest decreases in intake of calories, carbohydrate, total sugar, added sugar, total fat, saturated fat, and trans fat. Less beneficially, they also had a decrease in protein intake, but this is likely a result of the overall decrease in calories. Although not as significant as the good attendance group, the fair attendance group saw some improvement, with decreases in calories, protein, total fat, and saturated fat. Most notably, the good attendance group had decreases in saturated fat, trans fat, and added sugar compared to those with fair attendance. These nutrients are notorious for inducing hyperlipidemia and insulin resistance, and these changes may have been responsible for the changes that were observed in the biomarkers.
While the change in vegetable intake was marginally significant and the change in combined fruit and vegetable intake was significant, these findings were a bit counterintuitive in that they often increased in the no attendance group and either decreased in just the fair, or both the fair and good attendance groups. However, these changes were minimal in every attendance group with changes of ±0.1 servings of vegetables, for example. Furthermore, although the percent change in combined fruit and vegetable intake was significant, the changes in absolute consumption of both individually were minimal. Therefore, these changes appear clinically meaningless, despite their statistical significance.
HDL-C significantly improved in those subjects with good class attendance, compared to those with no and fair attendance, and the T-Chol/HDL-C ratio significantly improved in the good attendance group, compared to the no attendance group. These findings are especially important, considering the association between HDL-C and CVD risk. According to the American Heart Association, CVD risk decreases 2% to 3% for every 1 mg/dL increase in HDL-C. 24 LDL-C also modestly improved in the fair attendance group relative to the no attendance group, and improved slightly, but not significantly, in the good attendance group. The improvements in blood lipids are beneficial for potentially mitigating the common pro-atherogenic profile in PLWH. This is especially crucial for those patients on ART such as PIs, which represents over half of our sample, as they are at a higher risk of hyperlipidemia and CVD.6,9,10
The observed lipid changes may have been facilitated by changes in fat and carbohydrate intake. A diet higher in total fat is associated with increased postprandial triglyceride-rich lipoprotein content and plasma TG, which correlate with increased development of atherosclerosis and coronary artery disease. 25 More specifically, high trans fat intake is associated with a greater risk of CVD.26-28 Trans fat intake can cause adverse cardiovascular effects by elevating inflammatory cytokines such as tumor necrosis factor-α (TNF-α), interleukin-6 (IL-6), and CRP, 29 which increase systemic inflammation, often causing endothelial dysfunction.30,31 Trans fat intake is also positively associated with LDL-C 32 and small VLDL-C 33 concentrations and inversely related to HDL-C concentration.29,34,35 Therefore, the significant decrease in trans fat intake in the good attendance group is consistent with their increase in HDL-C and decreases in T-Chol/HDL-C ratio and LDL-C. In contrast, the no attendance group had increased trans fat intake, with a decrease in HDL-C and increases in LDL-C and T-Chol/HDL-C ratio. Studies have also shown that a reduction in saturated fat intake lowers T-Chol and LDL-C levels36,37 and decreases CVD risk.38,39
HOMA-IR and insulin marginally changed, but those in the good attendance group virtually stayed the same, −2.1% and 3.7%, respectively. These statistical changes were primarily driven by those subjects in the fair attendance group, who showed increases of 32.2% and 30.2%, respectively. The increases in HOMA-IR and insulin in the fair attendance group appear counterintuitive at first, considering their moderate improvement in dietary behavior. However, even though this group reported less total fat intake, they reported increases in total carbohydrate intake and total and added sugar intake. High carbohydrate consumption increases insulin secretion, which leads to an inhibition of VLDL production and thus a greater propensity to store fat. 25 Not only can this chronic behavior increase the risk of insulin resistance and type 2 diabetes,40,41 but it can also increase the risk of CVD. 6 Therefore, for education programs attempting to improve health outcomes related to CVD, it may be prudent to underscore balance in the macronutrient content of the diet and to emphasize adequate consumption of the recommended daily allowances for micronutrients. It is also crucial to educate participants about the importance of choosing intrinsic over extrinsic sugar and complex over simple carbohydrates, rather than just modifying the quantity of the macronutrient. In contrast, the good attendance group significantly decreased their carbohydrate intake, including both their total and added sugar intakes, and had a concurrent decrease in HOMA-IR. However, it is worth noting that their average daily caloric intake at 3-month follow-up was low (1090 ± 525), as it is not generally recommended for an adult to consume less than 1200 calories per day. 42 This minimum caloric requirement is also important to emphasize in such a nutrition education program, especially if weight loss is incentivized to improve outcomes related to disease risk. Finally, HOMA-IR unexpectedly decreased in the no attendance group. One possible explanation we have for this is that many members of our cohort had gotten to know each other personally, and therefore those who attended classes may have been sharing nutritional information with those who did not attend. Another possibility is that these subjects may have been exposed to nutritional information via mass media, such as television and the internet.
Although none of the changes in physical characteristics reached statistical significance, many of them showed a positive trend. Both SBP and DBP, commonly measured to check cardiovascular health, slightly improved in those with good and fair class attendance.
Overall, our improvements in fat consumption 43 are consistent with previous studies in PLWH, but our study showed even more significant results pertaining to changes in biomarkers related to CVD risk. Our lack of changes in physical assessments was inconsistent with a 6-month nutrition education study that found significant changes in body composition, such as a decreased lipodystrophy score and waist circumference. 18 This inconsistency is likely due to the study length, as well as differences in study design and programmatic content.
Limitations
The results of this study were compelling, but it had some limitations. First and foremost, the lack of a control group for comparison prevents us from being able to infer causation; we can only state associations between our program and the changes in the study sample. The program ran for a year, but significant attrition at the 6- and 12-month assessments prevented us from analyzing those data. This may partially explain the lack of significant findings in lipids, as they may require more than 3 months to change in PLWH. 44 Furthermore, large standard deviations for our biomarkers may indicate inconsistent results across our sample. Additionally, self-report of dietary intake is inconsistent, as subjects tend to underreport and/or skew their behavior toward perceived norms. 45 The next step in determining the effectiveness of a nutrition education program for decreasing CVD risk would be to replicate the current analysis in a larger sample size with a control group receiving no nutritional education. Offering incentives to maintain adherence over a year’s time should be considered, for example, providing monetary or food compensation. A non-HIV-infected comparison group of similar ethnic and socioeconomic status might be warranted to determine if these findings are consistent in the general population.
Conclusion
In summary, we showed several unique and significant findings: our weekly 1-hour nutrition education program was able to induce significant attendance-dependent improvements in (1) dietary variables and (2) some biomarkers associated with CVD risk, particularly in those with good class attendance, over a 3-month period. Our program demonstrated promise as a potential adjunct therapy for PLWH at-risk of CVD and hyperlipidemia, especially in those on ART, who can benefit from a better understanding of nutrition and healthy eating behaviors. This program was straightforward to implement and did not require many resources beyond that of having qualified staff to run it and a relatively minimal budget to pay for the food used in the demonstrations. Thus, other clinical and community institutions with similar resources should be able to incorporate a program of this type into their existing educational activities.
Footnotes
Acknowledgements
We are thankful to all the volunteers who participated in this study.
Declaration of Conflicting Interests
The author(s) declared no potential conflicts of interest with respect to the research, authorship, and/or publication of this article.
Funding
The author(s) disclosed receipt of the following financial support for the research, authorship, and/or publication of this article: This intervention was supported by AstraZeneca HealthCare Foundation’s Connections for Cardiovascular HealthSM (CCH) program. The CCH program funds charitable work, not research, that addresses cardiovascular health issues within the United States and its territories. Any opinions, findings, and conclusions or recommendations expressed in this material are those of the authors and have not been reviewed for approval by the AstraZeneca HealthCare Foundation.
Ethical Approval
The Healthy Living for Better Days was a 12-month nutrition education program approved by the institutional review board for human subjects research at the University of Miami Miller School of Medicine (ID# 20121029) and was conducted in accordance with the ethical standards of the Declarations of Helsinki.
Informed Consent
All participants signed informed consent and HIPAA (Health Insurance Portability and Accountability Act) forms before enrolling in the program.
Trial Registration
Not applicable.