
Abstract
Objective. This cross-sectional study examined associations between adolescent dietary behaviors and family/home environments with parent-adolescent dyadic analysis. Methods. Secondary data were analyzed for adolescents and their parents who participated in the 2014 Family Life, Activity, Sun, Health, and Eating (FLASHE) study. Relationships between adolescent and parent intake of convenience/fast-food, fruits/vegetables, and sugar, as well as family/community and mealtime environments, were examined using Pearson’s correlations, 2-sample t tests, analysis of variance, and general linear model analyses. Results. Among this nationwide parent-adolescent dyad sample (N = 1890), a moderate relationship between parent and adolescent consumption of convenience/fast-foods (r = 0.426) and fruits/vegetables (r = 0.416) was found. Adolescent convenience/fast-foods intake differed by sex, neighborhood socioeconomic status, meals eaten with family, and meals eaten in front of the TV (P < .001 for all) as well as race/ethnicity (P = .004). Adolescent fruit/vegetable intake differed by home location (P = .029), school location (P = .032), meals eaten together with family, meals eaten in front of the TV, and body mass index category (P < .001 for all). Generalized linear models revealed multiple predictors of adolescent dietary behaviors. Conclusion. Findings suggest dynamic relationships between adolescent and parent dietary cancer risk factors and adolescent fruit/vegetable consumption disparities by multiple environmental factors. Interventions targeting adolescent-parent dyads may help reduce cancer risk associated with diet.
‘An estimated 63% to 65% of adolescent daily calories are consumed at home, underscoring the potential for food parenting during family meals (eg, modeling, active guidance, restrictive guidance) as a means to promote positive dietary health outcomes and cancer prevention.’
Dietary factors have a significant effect on cancer risk reduction, and it is estimated that one third of cancers could be prevented by a healthier diet.1-3 Dietary recommendations for cancer prevention encourage consumption of vegetables, fruits, whole grains, and fish, and a reduced intake of red meat, animal fat, and refined sugar. 4 The adherence to these recommendations could potentially lower the risk of developing an array of cancers, including breast cancer, colorectal cancer, endometrial (uterine) cancer, kidney cancer, and pancreatic cancer. 1 Despite warnings about its negative impact on cancer and other dietary-influenced diseases, daily consumption of fast-food remains high while fruit and vegetable consumption remains low among the US population.5,6
Adolescence has been identified as a critical time for the development of healthy dietary habits that may reduce cancer risk. 7 However, overall poor diet quality (eg, low fruit and vegetable intake) and overconsumption of nutrient-poor foods and beverages (eg, fast-food and sugar-sweetened beverages) have been continuously reported as public health concerns for US adolescents.7-9 For instance, prior research demonstrated a high proportion of caloric energy from fat and added sugars and low fruit and vegetable consumption among this age group. 8 Similarly, data from 6 nationally representative surveys indicated trends of decreased fruit and vegetable and increased sugar-sweetened beverage consumption.6,9
An estimated 63% to 65% of adolescent daily calories are consumed at home, underscoring the potential for food parenting during family meals (eg, modeling, active guidance, restrictive guidance) as a means to promote positive dietary health outcomes and cancer prevention. 10 Previous research has demonstrated a higher frequency of family meals to be positively associated with higher adolescent consumption of fruits and vegetables.7,8,10,11 Likewise, adolescents who frequently participated in family meals had a higher intake of calcium, folate, fiber, iron, vitamins A, C, E, B6, and B12, and less high-fat and high-sugar foods than their peers who did not frequently participate in family meals.11,12 Moreover, food away from home generally contains fewer fruits and vegetables and more calories, fat, sodium, and sugar than foods prepared and eaten at home. 7
Neighborhood factors are further determinants of dietary behaviors. Hilmers et al identified neighborhood disparities in the accessibility of healthy and unhealthy foods by socioeconomic and racial/ethnic characteristics. 13 Specifically, neighborhoods classified as low income with large minority populations were more likely to have abundant access to foods that promote unhealthy diet (eg, convenience and fast-food). 13 Another study reported adolescents from families with low socioeconomic status (SES) who live in neighborhoods with fast-food outlets were significantly more likely to have unhealthy eating habits than their peers from families with higher SES. 14 Neighborhood environments with fast-food accessibility and availability could also bring a negative impact on adolescent food choices. 15
The goal of the current study was to examine relationships between parent and adolescent dietary behaviors and sociodemographic and mealtime environmental factors. Specifically, we explored (1) relationships between parent and adolescent dietary behaviors—for example, intake of convenience/fast-foods, fruits, vegetables, and sugary foods; and (2) associations between sociodemographic factors, mealtime environment, and adolescent dietary behaviors. We hypothesized that parent dietary behaviors and home mealtime patterns would positively influence adolescent dietary behaviors.
Methods
Study Population and Design
The Family Life, Activity, Sun, Health, and Eating (FLASHE) study generated household, cross-sectional, dyadic (parent-child) survey data that comprehensively examined psychosocial and environmental correlates of cancer-related behaviors. 16 Sponsored by the National Cancer Institute (NCI), FLASHE was administered through the Ipsos’ Consumer Opinion Panel (Ipsos) between April and October 2014. 10 A parent/caregiver and his/her adolescent child (ages 12-17) were enrolled, and each parent/adolescent completed 2 internet-based surveys on diet and physical activity. Details of the recruitment of FLASHE participants and survey development were previously described. 17 The sample drawn from Ipos is similar to the general US population in terms of age, sex, income, household size, and region. 10 The GeoFLASHE dataset recently released to researchers was an extension of FLASHE and featured the examination of neighborhood characteristics as well as parent-adolescent dietary and physical behavior. 18 The 2 key components of GeoFLASHE are dyad’s home neighborhood and adolescents’ school neighborhood. Since FLASHE data are publicly available on the NCI’s website without participant identifiers, 16 this current study was determined exempt by the Institutional Review Board at East Carolina University. We conducted our analyses during January and March 2020.
Measures
Sociodemographic Characteristics
Participants reported their age, sex, race/ethnicity, education level (parents only), and height and weight (which were used to compute body mass index [BMI]). BMI percentile for adolescents was computed based on parent-reported height and weight values into 4 categories: underweight (BMI <5th percentile), healthy weight (BMI 5th to <85th percentile), overweight (BMI 85th to <95th percentile), and obese (BMI ≥95th percentile). 10 Parent BMI categories were calculated based on parent self-reported height and weight and organized into 4 categories: underweight (<18.5), healthy weight (18.5-24.99), overweight (25-29.99), and obese (30+). 17 Rurality of home and school were determined with parent-reported home (street name and nearest cross-street) and school (street name) locations. Buffers were generated based on assumptions of walking 10 to 15 minutes at an average pace of 20 minutes/mile. 18 Neighborhood SES was measured based on the following domains: occupation, unemployment rate, poverty, income, education, and housing.
Outcome Variables
Outcome variables were daily intake frequencies of convenience/fast-foods, fruits/vegetables, and sugary foods measured with the Dietary Screener Questionnaire. Convenience/fast-food consumption was measured with 6 survey items (fried potatoes, fried chicken, pizza, tacos, burgers, and heat-and-serve). Fruit/vegetable intake was measured with 7 survey items (100% fruit juice; fruit, green salad, other non-fried potatoes, other non-fried vegetables, cooked beans, and other potatoes). Sugary food consumption was measured with 7 survey items (candy/chocolate, cookies/cakes, frozen desserts, sugary cereal, non-sugary cereal, non-soda sugar-sweetened beverage, and soda).
Frequency data on each food ranged from “never” to “3 or more times per day” for each survey item. These responses were converted into daily frequencies as “never” = 0, “1 to 3 times during the past 7 days” = 0.29, “4 to 6 times during the past 7 days” = 0.71, “1 time per day” = 1, and “2 times per day” = 2. According to the description given by FLASHE data users’ guide, all the food consumption responses in frequencies were measured by summing the survey items to create scores for each food group, representing their accumulated daily intake for each food category. 19 To avoid possible overestimation, daily intake frequencies for each food group were top-coded and details are outlined elsewhere. 19
Independent Variables
Independent variables were categorized into 2 groups: sociodemographic factors and mealtime environment. Sociodemographic factors included the following: home and school location (city, suburb, town, rural) and neighborhood SES (home network), which measures SES quintile within 1000 meters of participants’ homes (low, medium-low, medium, medium-high, high). Mealtime environment variables included meals eaten with family and meals eaten in front of the TV, with a 5-point Likert-type agreement scale.
Data Analysis
Data were summarized by frequency (percent) for categorical variables and mean (standard deviation) for quantitative variables. In bivariate analysis, we investigated the relationships between adolescents’ convenience/fast food intake (daily frequency), fruit/vegetable intake (daily cup equivalent), and sugar intake (daily teaspoons equivalent) and the independent variables of home and school rural/urban status, neighborhood SES, adolescents’ age, sex, race/ethnicity, BMI category, and adolescent responses to 2 questions regarding the importance of having family meals together and watching TV while having meals using analysis of variance. We also analyzed the bivariate relationships between adolescents’ and their parents’ convenience/fast food, fruit/vegetable, and sugar consumptions, as well as their neighborhood percent white population, using Pearson’s correlation. For data analysis, neutral or disagreement were recoded into “disagree” while somewhat and strongly agree were recoded into “agree.” Last, we conducted several general linear models in predicting adolescents’ convenience/fast food, fruit/vegetable, and sugar consumptions using the above-mentioned independent variables. Effect sizes are summarized by parameter estimates and 95% confidence intervals. All analyses were performed using SAS 9.4. The question scales were determined by the FLASHE science team based on validated questionnaire items. 17
Results
Participant Characteristics
As depicted in Table 1, participating adolescents (n = 1890) were evenly split by sex (50.2% female), predominantly non-Hispanic White (63.7%), and reported being 14 to 15 (41.7%) or 16 to 17 (43.1%) years of age (see Table 1). Additionally, the majority of adolescents self-reported height and weight that fit within the “healthy weight” BMI category (59.3%). BMI percentile for adolescent and adults were calculated based on the official guidelines. Participating parents were predominately female (72.5%), non-Hispanic White (67.7%), and between 35 and 44 years (42.8%) or between 45 and 59 years (41.3%) of age. The majority of parents reported height and weight that resulted in a BMI classified as overweight or obese (59.9%) and nearly half (45.6%) reported earning a 4-year college degree or higher.
Characteristics of Adolescents (N = 1890) a .
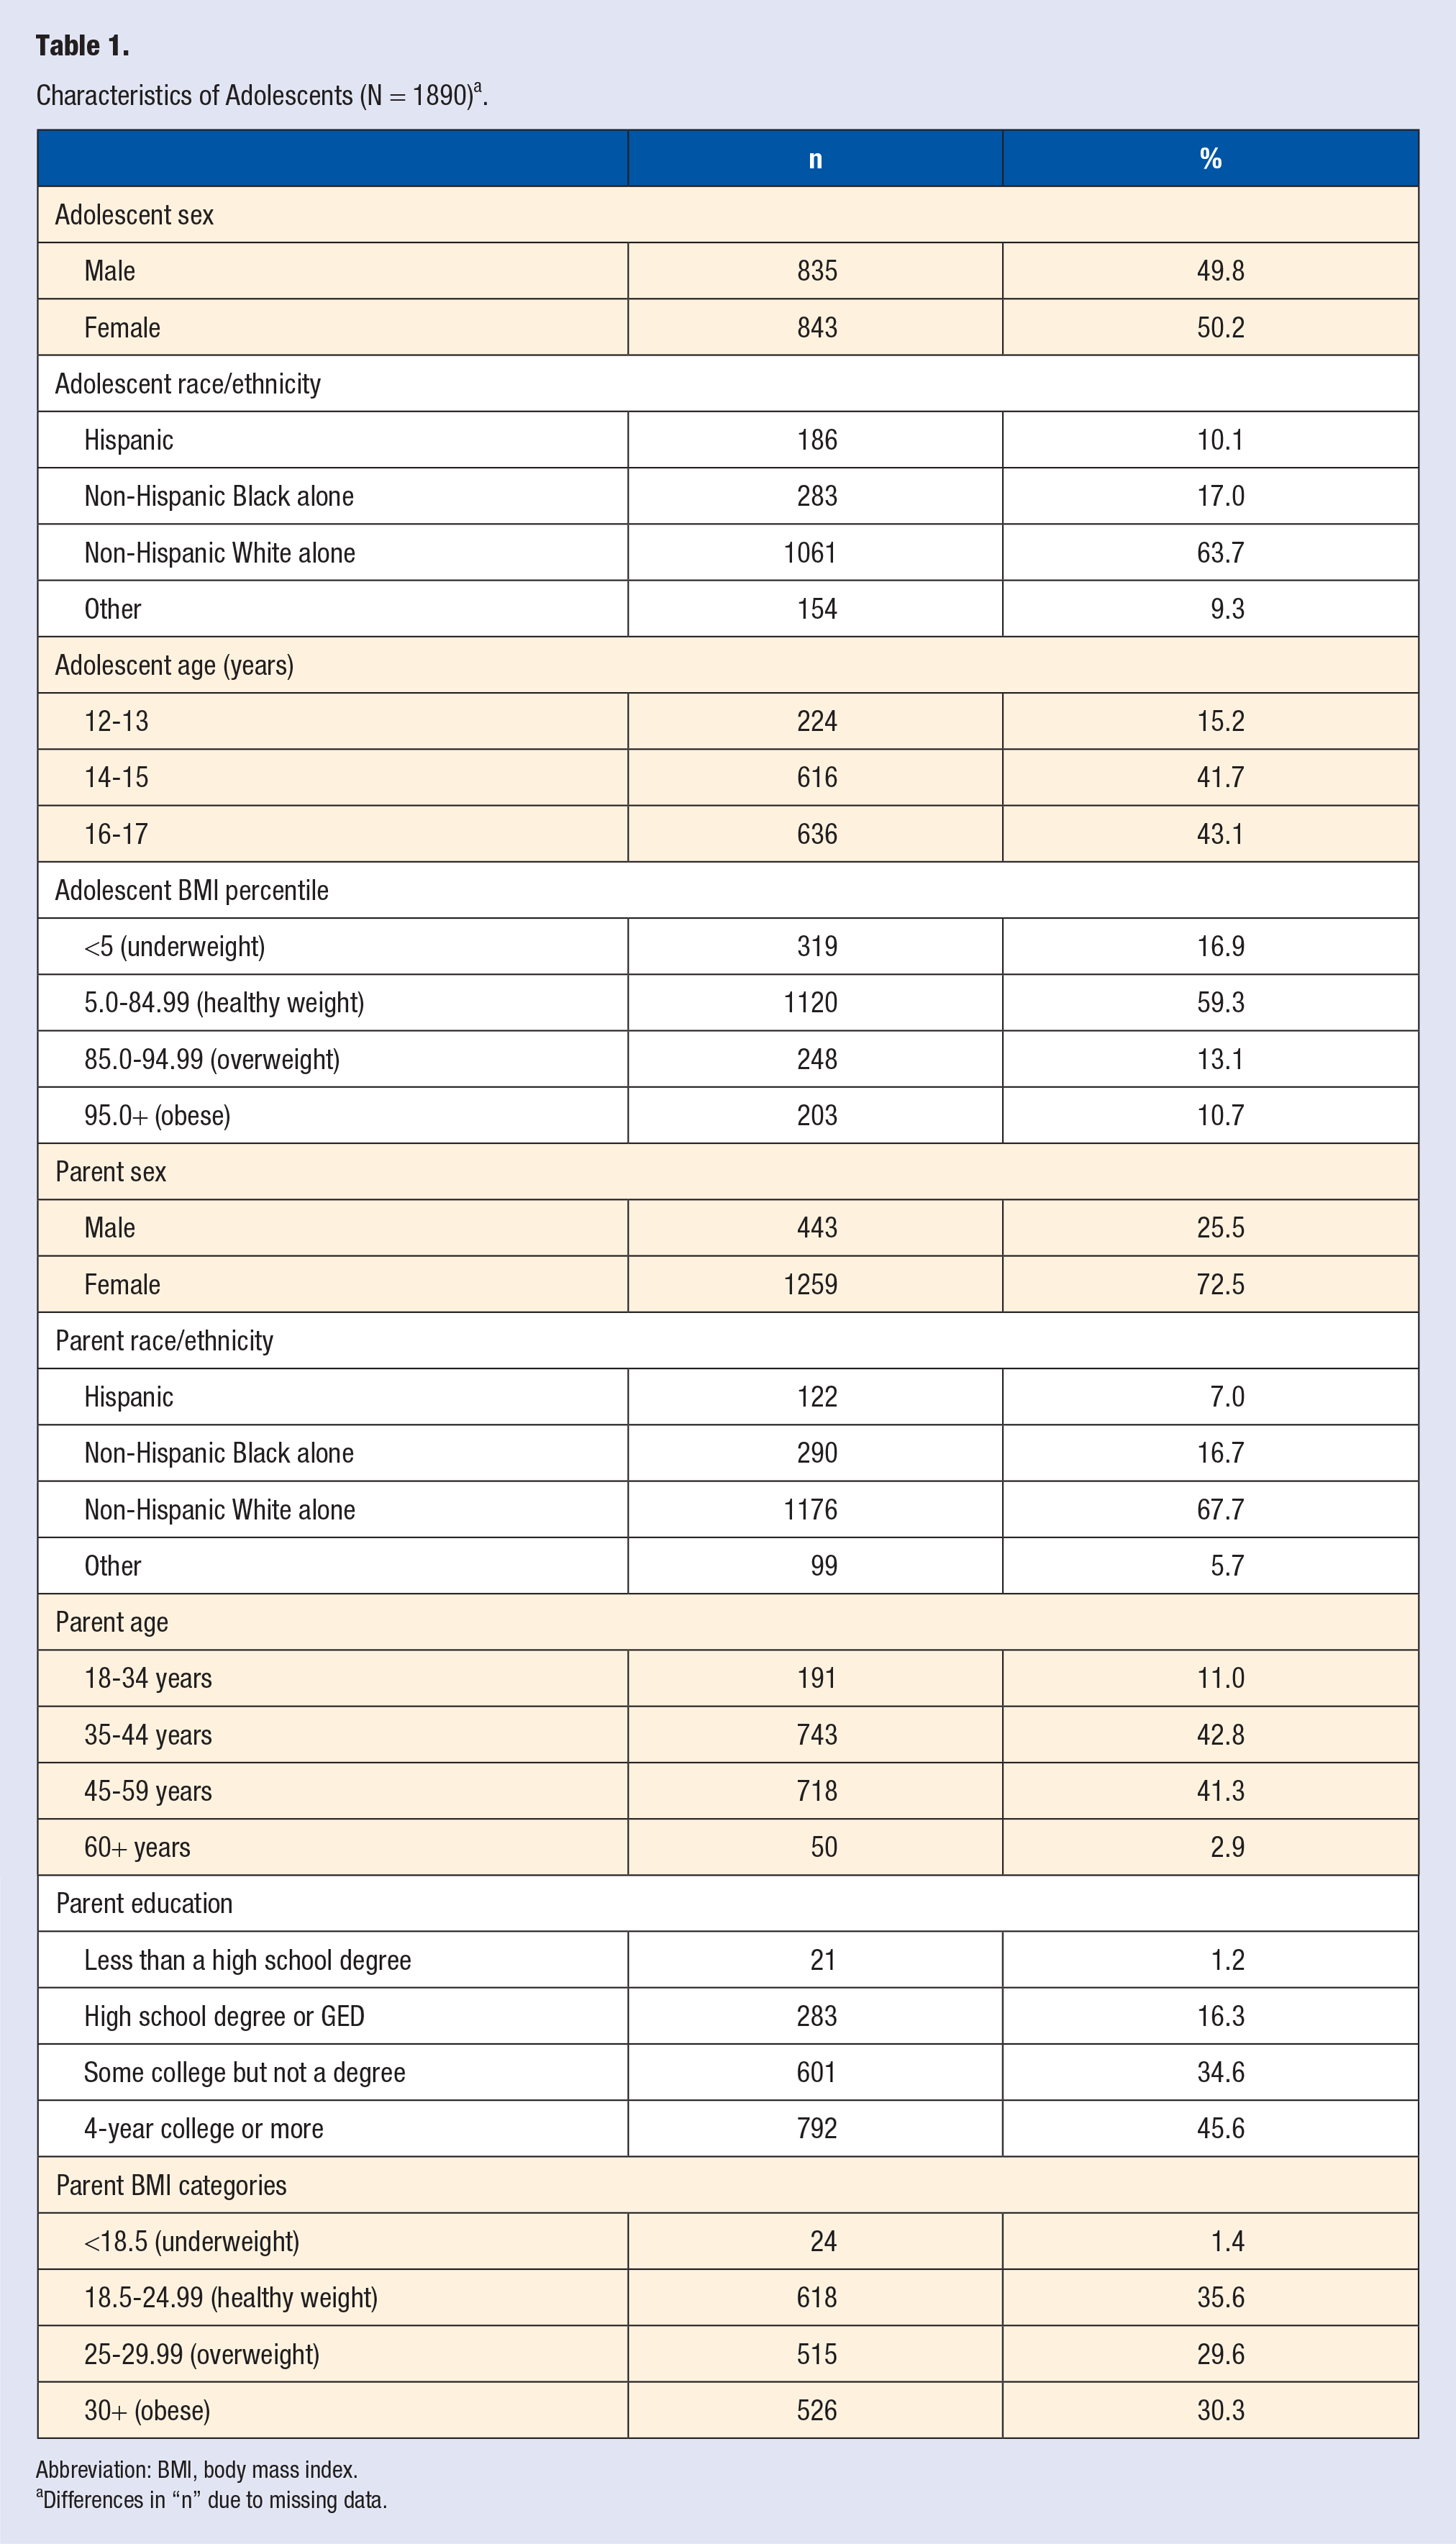
Abbreviation: BMI, body mass index.
Differences in “n” due to missing data.
Adolescent-Parent Behavior Correlations
Pearson correlation coefficients (P < .001 for all) suggested a moderate relationship between parent and adolescent consumption of convenience and fast-foods (r = 0.426) as well as fruits and vegetables (r = 0.416). A weak relationship was found for parent and adolescent sugar intake (r = 0.316).
Predicted Daily Intake
On average, the predicted daily intake of convenience/fast foods was 1.42 times for adolescents and 1.05 times for parents. Adolescent daily intake of convenience/fast foods significantly differed by sex, race/ethnicity, neighborhood SES, meals eaten with family, and meals eaten in front of the TV, but not for age, BMI, home location, or school location. Adolescents who were male, Hispanic or non-Hispanic Black, “disagreed” they ate meals with family, “agreed” they ate meals in front of the TV or reported a “medium-low” or “low” home network reported higher daily frequency of convenience and fast-foods than their peers.
Predicted daily intake of fruits and vegetables was 2.01 cup equivalents for adolescents and 2.76 cup equivalents for parents. Adolescent fruit and vegetable intake significantly differed by home location, school location, meals eaten with family, meals eaten in front of the TV, and BMI category, but not for sex, race/ethnicity, age, or home network. Adolescents who reported a rural home or school location, “disagreed” they ate meals with family, “agreed” they ate meals in front of the TV, or who were overweight/obese reported fewer cups of fruit and vegetable intake than their counterparts.
Predicted daily sugar intake was 15.67 teaspoons for adolescents and 16.14 teaspoons for parents. Adolescent sugar intake significantly differed by sex, race/ethnicity, age, home network, meals eaten with family, and meals eaten in front of the TV, but not for home location, school location, or BMI category. Adolescents who reported being male, non-Hispanic Black, 16 to 17 years old, a “low” home network, “disagreed” they ate meals with family, or “agreed” they ate meals in front of the TV reported a higher sugar intake than their peers (see Table 2).
Analysis of Variance Results for Adolescent Dietary Habits.
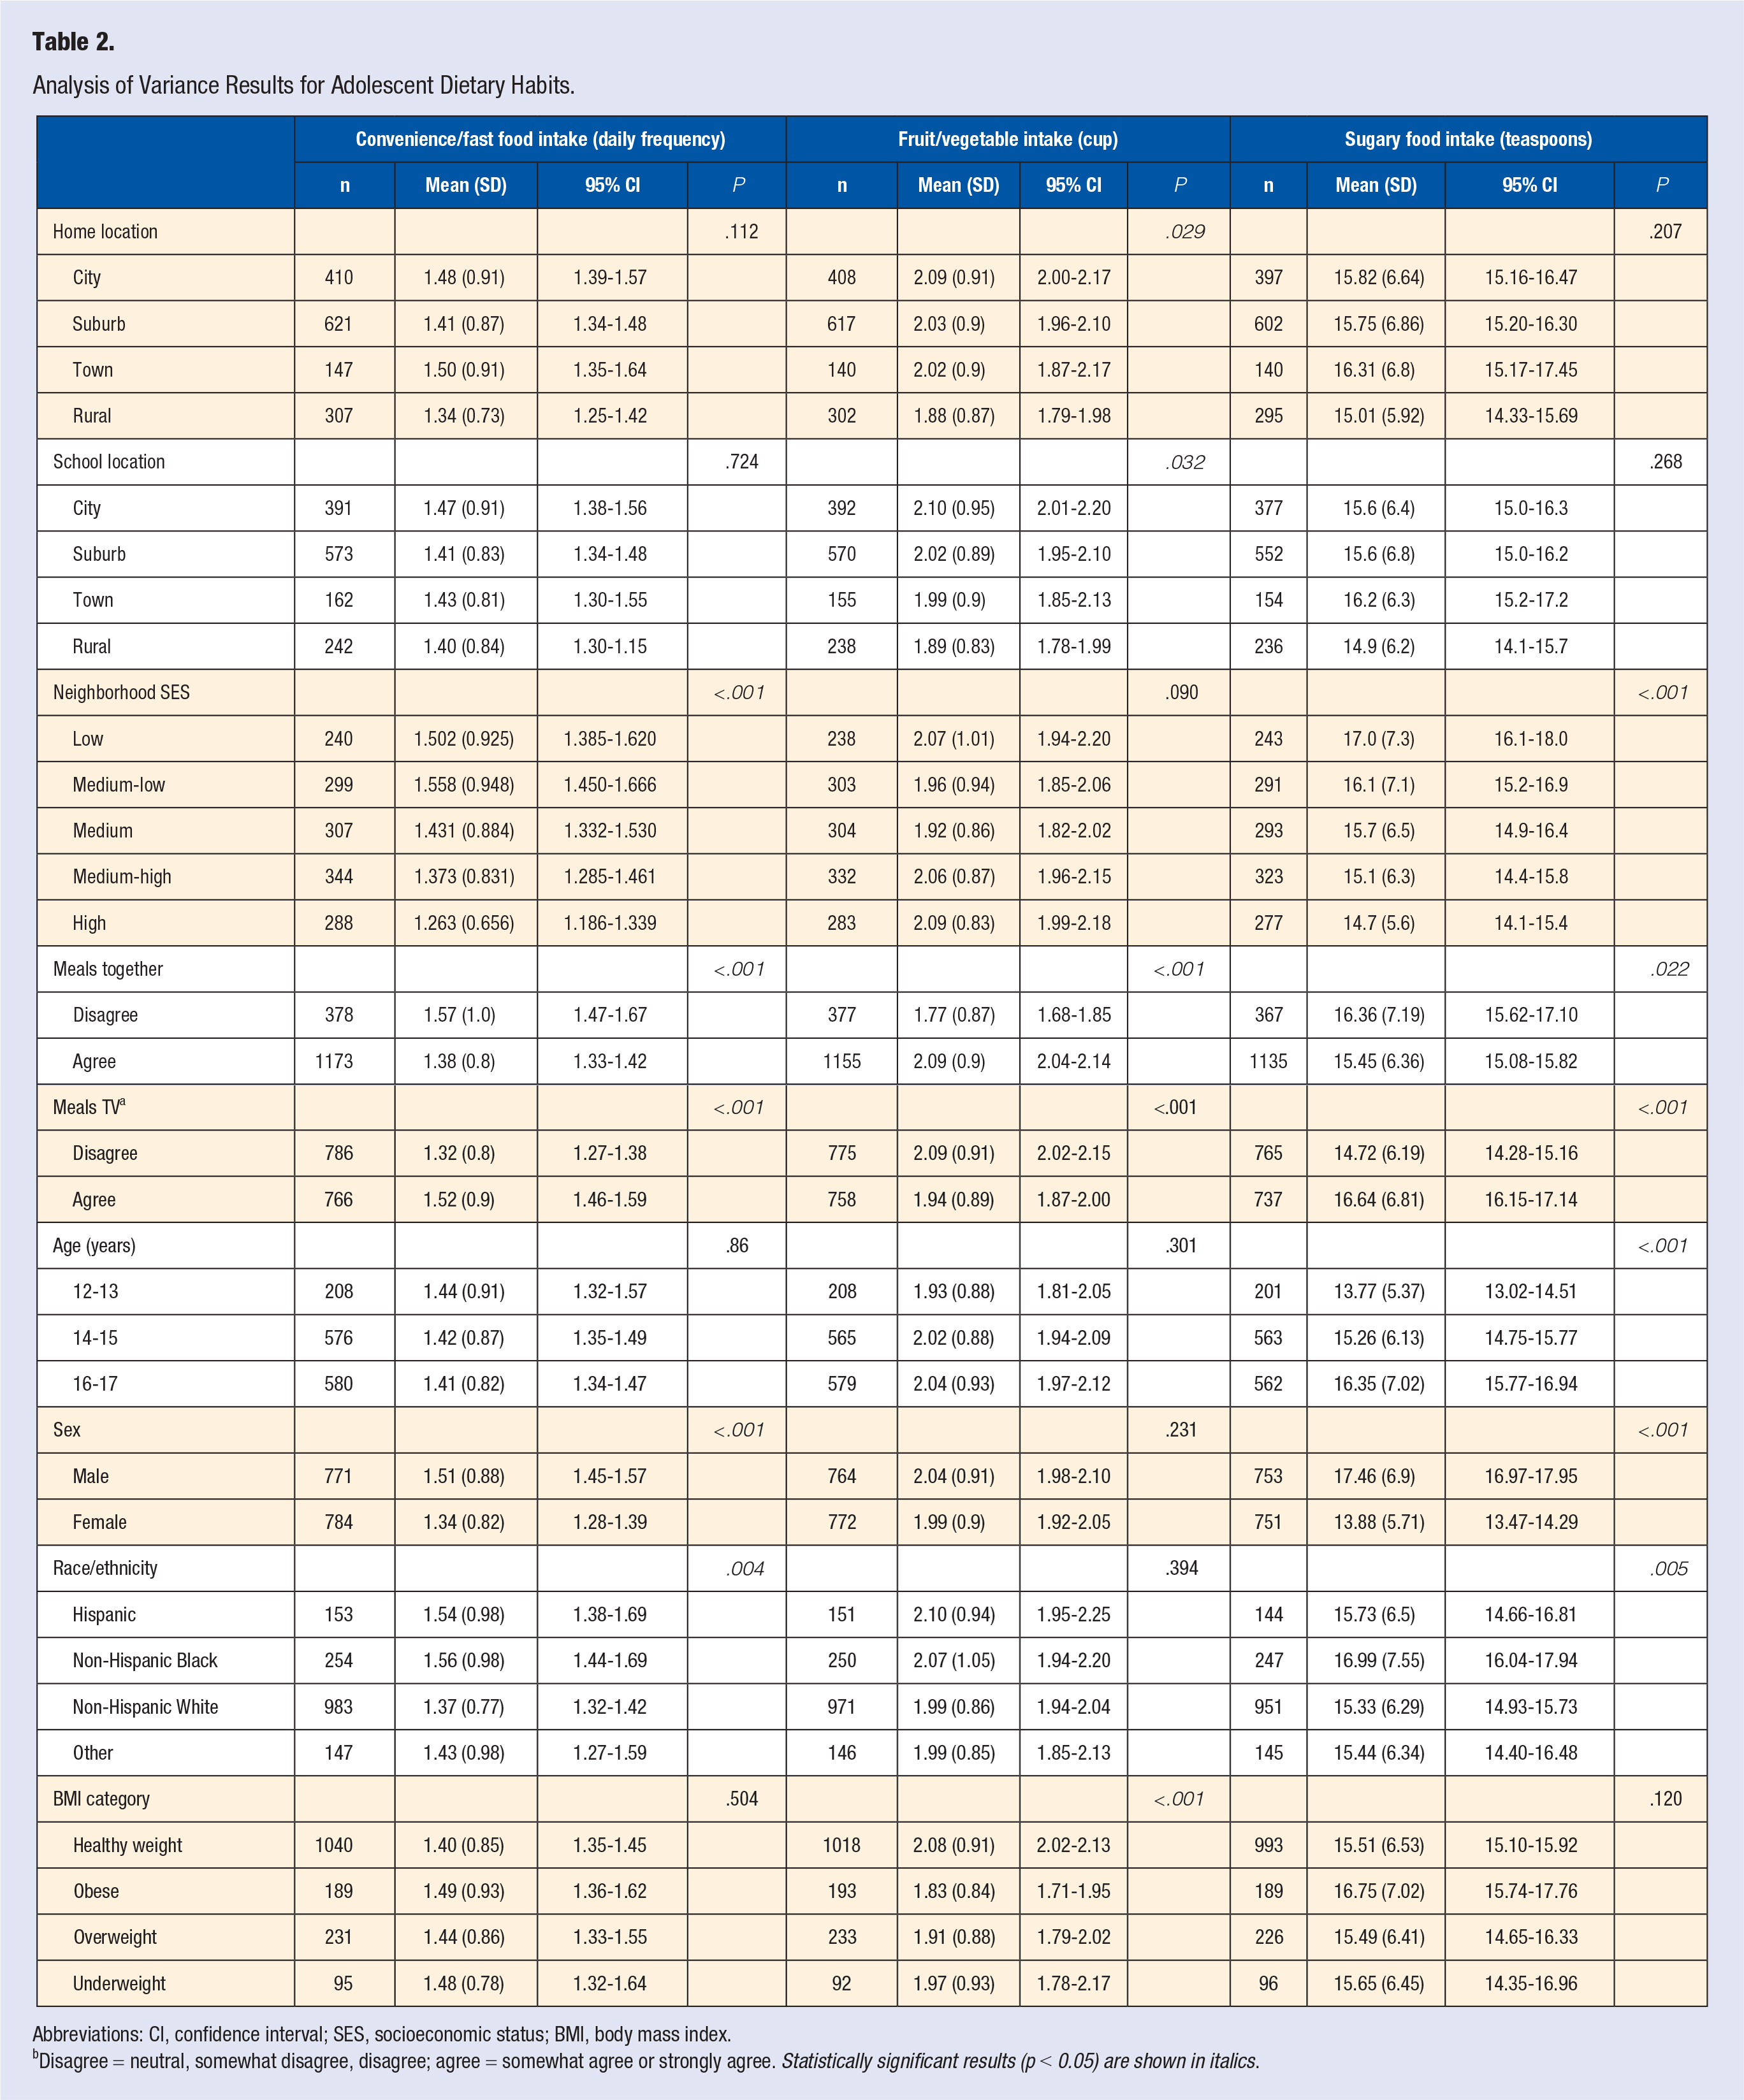
Abbreviations: CI, confidence interval; SES, socioeconomic status; BMI, body mass index.
Disagree = neutral, somewhat disagree, disagree; agree = somewhat agree or strongly agree. Statistically significant results (p < 0.05) are shown in italics.
Predictors of Adolescent Dietary Habits
General linear models predicting adolescent dietary habits revealed significant predictors of adolescent dietary behaviors for all 3 dependent variables (Table 3). Adolescent convenience/fast-food intake was predicted by parent convenience/fast-food consumption, adolescent sex, meals eaten with family, and meals eaten in front of TV (F[20, 1200] = 13.57, P < .001). Adolescent fruit and vegetable intake was predicted by parent fruit and vegetable intake, meals eaten with family, and meals eaten in front of TV (F[20, 1156] = 14.11, P < .001). Predictors of adolescent sugar intake were home rurality, parent sugar intake, adolescent age, sex, meals eaten in front of TV, percentage of non-Hispanic White within 1000 meters of home, and SES quintile (F[20, 1126] = 15.37, P < .001).
Parameter Estimates From the General Linear Models.
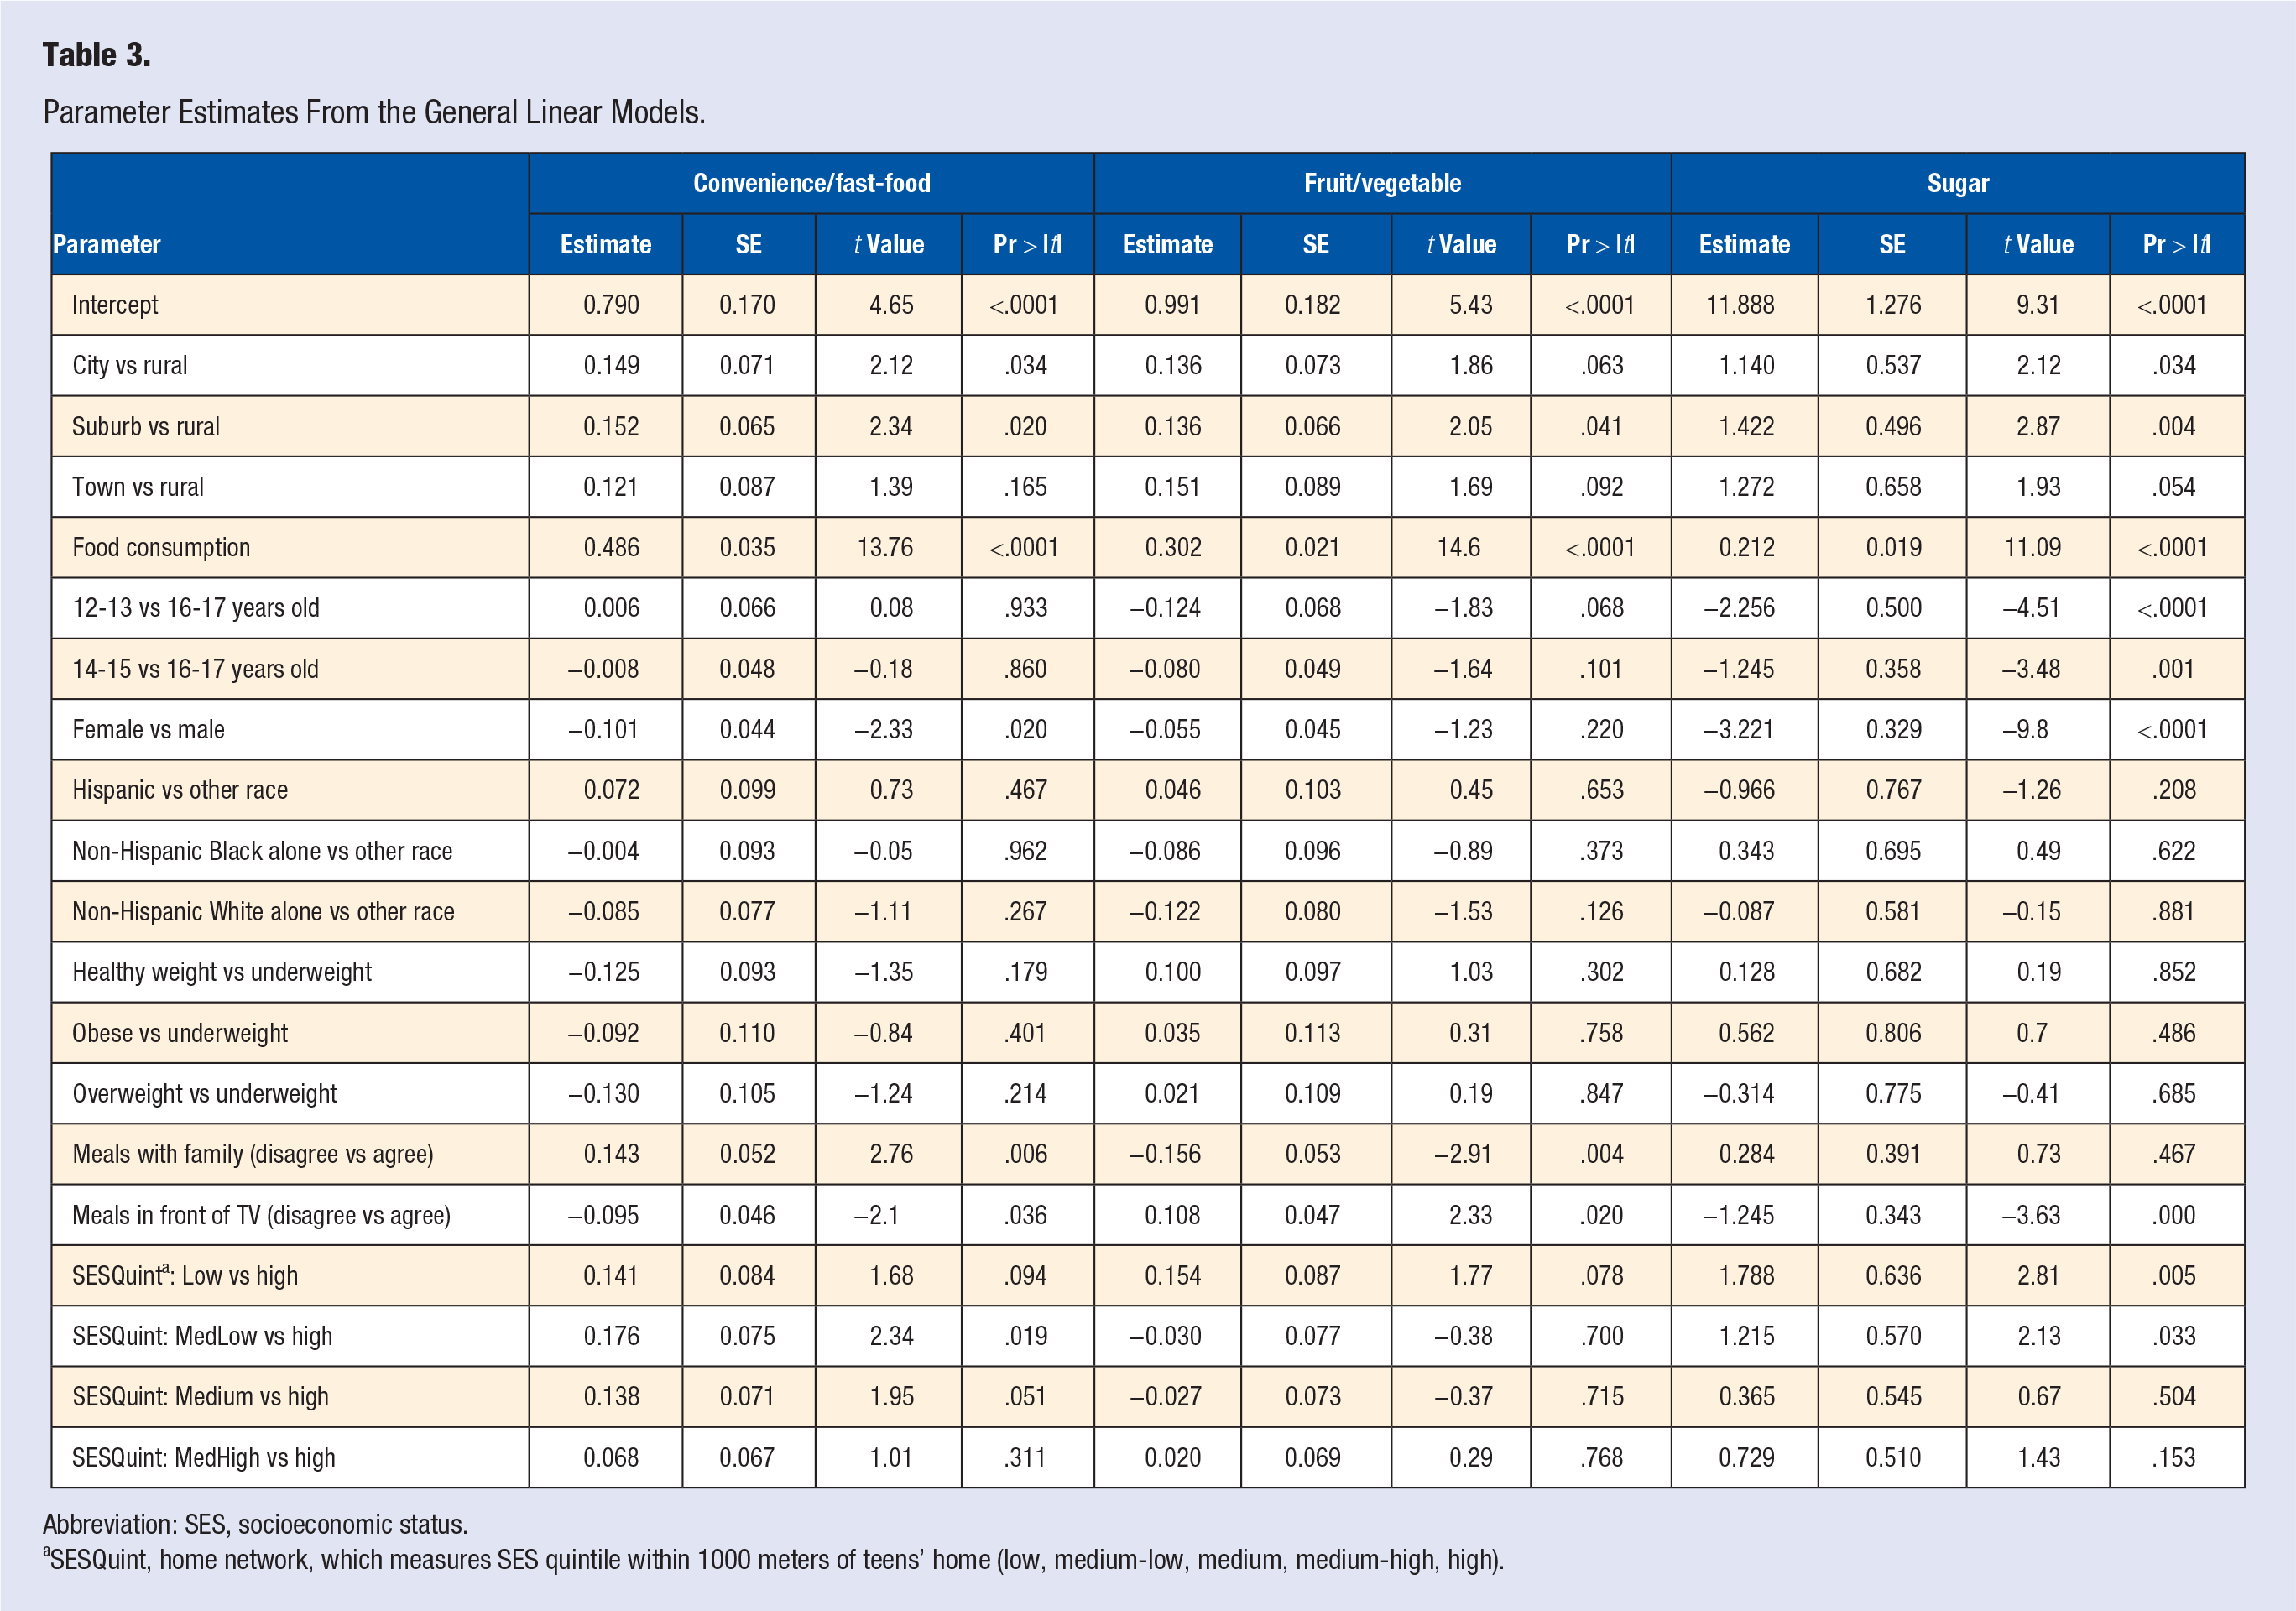
Abbreviation: SES, socioeconomic status.
SESQuint, home network, which measures SES quintile within 1000 meters of teens’ home (low, medium-low, medium, medium-high, high).
Discussion
Diet-related factors have been widely acknowledged as one of the most important modifiable components for cancer and chronic disease prevention. 1 Dietary habits formed in adolescent years could have a positive or negative impact throughout their lifetime. 20 The current study examined associations between adolescent dietary behaviors and family/neighborhood environments using parent-adolescent dyadic analysis among a national sample of US adolescents and their parents. Findings contribute to the literature regarding dietary behaviors and family/neighborhood cancer risk factors in several unique ways.
First, adolescents who did not eat with family were more likely to consume more convenience and fast-foods and sugary foods and fewer fruits and vegetables than their peers who reported eating meals with family. This finding aligns with prior reports that families who have fewer meals together eat fewer fruits and vegetables and more sugar-sweetened drinks.10,12 In a recent FLASHE report by Fleary and Ettienne, the authors affirmed the positive relationship between adolescent food intake and parenting practices (eg, encouraging fruit and vegetable consumption, discouraging junk food as well as setting rules or limiting junk food intake). 21 When designing cancer awareness and disease prevention for adolescents and their families, increasing family eating occasions could be a feasible and effective solution.
Second, in agreement with prior research, our study revealed male adolescents were more likely than their female counterparts to consume convenience/fast-food (fried potatoes, fried chicken, pizza, and burgers), and reported higher sugary food intake (frozen dessert, cookies/cake, and candy chocolates), regardless of their age (range: 12-17 years old). 22 Eating too much fast-food or other processed foods high in fat and sugar can put male adolescents at risk of being overweight or obese—increasing the risk of many types of cancer.23,24 Milosavljević and colleagues found that a knowledge gap exists among teenage boys (and girls) with regard to their knowledge about diet recommendations, sources of nutrients, and dietary habits. 25 Prior researchers have also reported that multitasking while eating, such as watching TV, may increase the chances of junk food overconsumption. 26 Since the adolescent males in our sample agreed they ate more meals in front of the TV, to help prevent sedentary behavior while eating and reduce cancer risk, our findings support the ideas that (1) parents provide suggestions or reminders to prevent adolescents from being distracted when watching TV during mealtime and (2) more policies at the government level should be implemented to restrict junk food advertisement, while evaluating its sweeping negative impact on the next generation with regard to young-onset cancer incidence.26,27 At the community and school levels, healthy diet educational interventions for adolescent males focused on healthy food choices are warranted.
Third, our results demonstrated that many communities—predominantly low-income, Hispanic, and non-Hispanic Black populations—appear to consume more convenience/fast-food and have surplus sugar intake. Substantial evidence has shown the differences in dietary intake and dietary behaviors among Hispanics and non-Hispanic Blacks compared with their non-Hispanic White counterparts.28-35 Contradictory to results from a nationally representative survey exploring dietary information from approximately 850 Americans, our results did not show significant differences in daily fruit and vegetable consumption between non-Hispanic Whites, Hispanics, and non-Hispanic Blacks. 36 However, we found similar results which indicated that Hispanics and non-Hispanic Blacks drank more sugary soda during the past 30 days compared to non-Hispanic Whites. 28 The US Census Bureau predicts minorities (eg, Hispanic, non-Hispanic Blacks, and Asians) will constitute 54% of the US population by the year 2050, underscoring the need to consider diet- and health-related disparities.28,30,37,38 Moreover, recent research suggests high fructose corn syrup consumption—often found in sugary drinks like soda—may drive colorectal cancer (CRC) tumor growth, possibly explaining the surge in early CRC diagnoses in young adults yet warrants further investigation.39,40 All considered, our findings indicate that policy interventions to increase access to healthy food in underserved populations, particularly contributing to minority community economic development, may promote healthy eating patterns while reducing the risk of cancer as well as diabetes, heart disease, and hyptensionsion.41-43
Fourth, our results showed that adolescents reported lower daily fruit and vegetable intake (2.01 cups/day) than recommended (at least 2.5 cups) by American Cancer Society guidelines. Also, adolescent fruit and vegetable intake significantly differed by home location, school location, meals eaten with family, meals eaten in front of the TV, and BMI category. Expectedly, participants residing in the city or town were more likely to have more fruit/vegetables in their meals than their counterparts living in suburb and rural areas, as fresh, affordable, and high-quality food is out of reach for many families who live in rural settings.13,44 Evidence from the Food Trust also demonstrated that nationally, low-income zip codes have 30% more convenience stores, which tend to lack healthy items, than middle-income zip codes. 44 Similar patterns were found in our study: schools located in cities or towns ate more fruits and vegetables than students from suburban or rural settings. These findings underscore the importance of improving access to healthy food as part of an agenda to build an equitable, affordable healthy food system; for example, increasing availability of fresh, nutritious, affordable food in rural gas stations and convenience stores.
Limitations
The limitations of this study should be noted. First, this is a cross-sectional study, limiting the power to make causal relationships among the variables and the results are not generalizable to the entire US adolescent population. Second, eating an unhealthy diet or food environment represented one aspect of cancer risk factors among adolescents. Other lifestyle-related factors, such as lack of physical activity, smoking, being overweight, drinking too much alcohol could interact with each other and act as major contributing factors for adolescents’ dietary-related behaviors. Yet, these other factors were not the foci of this current study. Third, all the measures were self-reported. We were not able to validate these answers and therefore, bias might exist. However, the FLASHE questionnaire used validated scales for behavioral measures. Last, as a secondary data analysis, the scope of the study was limited to the publicly available data set. Despite these limitations, this study adds to the body of literature regarding the impact of home and environmental factors on adolescent diet-related cancer risk factors.
Conclusions
Our study extended existing evidence demonstrating health inequities in adolescent cancer-related dietary behaviors. Male adolescents reported eating more fast-food and sugar than their female peers. We also found that adolescents who resided or attended school in a rural area, were from a low-income family, or identified as Hispanic or non-Hispanic Black had poorer dietary outcomes related to fruit/vegetable, convenience/fast-food, and sugar consumption. These findings support the need to further efforts of healthy eating promotion among vulnerable young adults to ultimately reduce cancer risk. We recommend future interventional research aims to enhance parents’ role in improving the lifestyle and nutritional behaviors of their adolescent children.
Footnotes
Declaration of Conflicting Interests
The author(s) declared no potential conflicts of interest with respect to the research, authorship, and/or publication of this article.
Funding
The author(s) disclosed receipt of the following financial support for the research, authorship, and/or publication of this article: This research was partially supported by Grant K01CA234319 from the National Cancer Institute of the National Institutes of Health (NIH). The content is solely the responsibility of the authors and does not necessarily represent the official views of the NIH.
Ethical Approval
Since the data in this current study are publicly available, this study was exempt for ethical approval by the Institutional Review Board at East Carolina University.
Informed Consent
We did not seek informed consent from the participants because this is a secondary data analysis.
Trial Registration
Not applicable, because this article does not contain any clinical trials.