
Abstract
Diabetes threatens a patient’s health and quality of life, whereas disease diagnosis itself could potentially serve as a teachable moment for initiating behavior change. This study assessed diabetes diagnosis as a possible teachable moment for screen-based sedentary behavior among US adults. The nationally representative sample (n = 3690) came from the 2005-2006 and 2011-2012 National Health and Nutrition Examination Survey. Self-reported hours spent on screen-based sedentary behavior (television/video watching, computer/digital device use) were measured by the Global Physical Activity Questionnaire. Diabetes/prediabetes was identified by fasting plasma glucose and the glycated hemoglobin test. Logistic regressions were conducted to examine the relationship between diabetes diagnosis and screen-based sedentary behavior, adjusting for individual characteristics and sampling design. Compared with those with undiagnosed diabetes, the adjusted values for prevalence of daily television/video watching ≥2 hours (77.45% vs 65.14%), computer/digital device use ≥1 hour (43.20% vs 36.52%), and total screen time (ie, television/video watching plus computer/digital device use) ≥3 hours (66.75% vs 45.78%) were all noticeably higher among adults with diagnosed diabetes, although only the difference in the prevalence of daily total screen time was significant at P < .05. No evidence was found regarding diabetes diagnosis as a teachable moment in reducing screen-based sedentary behavior in US adults.
‘Sedentary behavior, characterized by low energy expenditure and a sitting or reclining posture, has been consistently linked to the onset and progression of diabetes, metabolic syndrome, and other chronic diseases.’
Introduction
As a leading cause of disability and premature mortality in the United States and worldwide, diabetes can result in serious health complications, including heart disease, blindness, kidney failure, and lower-extremity amputations. 1 In 2012, an estimated 28.9 million American adults 20 years of age and older had diagnosed or undiagnosed diabetes, and an additional 86 million had prediabetes. 2 Maintaining an active lifestyle through physical activity engagement and avoidance of sedentary behavior is a crucial regime for diabetes management.3,4 Sedentary behavior, characterized by low energy expenditure and a sitting or reclining posture, has been consistently linked to the onset and progression of diabetes, metabolic syndrome, and other chronic diseases.5,6 American adults on average spent more than half of their daytime hours in sedentary behavior. 7 Screen-based sedentary behavior, primarily consisting of television/video watching and computer/digital device use, is a major contributor of daily sedentary activities.8,9 Existing diabetes awareness campaigns and interventions typically focused on physical activity promotion but often overlooked the adverse impact of sedentary behavior on diabetes management. 10 Reducing sedentary activities, including screen-based sedentary behavior, is urgently warranted in diabetes prevention and management.11,12
Despite the importance of maintaining an active lifestyle in diabetes management, initiating and sustaining a behavior change can be particularly challenging for people with diabetes because of various barriers such as inertia and lack of motivation, multiple social roles and responsibilities, declining physical and mental health, and major life events.13,14 The health belief model emphasizes the importance of cues in motivating behavior change.15,16 A specific type of cue, labeled as the teachable moment, describes a naturally occurring health or life event that could motivate individuals to spontaneously engage in risk-reducing health-enhancing behaviors. 17 Although diabetes is a major threat to a patient’s health and quality of life, disease diagnosis itself could potentially serve as a critical teachable moment for one to initiate behavior change. According to McBride et al, 17 a disease diagnosis may increase one’s perceptions of vulnerability, shift expectancies of and value assigned to health outcomes in relation to a specific unhealthy behavior, bring out strong negative or positive emotional reactions, and alter perceived social norms or self-concept so that an unhealthy behavior becomes less tolerable. If a new diabetes diagnosis could serve as a window of opportunity for health behavior promotion, targeting people with newly diagnosed diabetes will augment intervention effectiveness because they could be particularly receptive to change. 18 Moreover, these people often can be conveniently reached at clinics, hospitals, and other health care settings when attending appointments for their new diagnosis. Health care providers may seize this opportunity to offer on-site health behavior counseling shortly after delivering the diagnosis/treatment. Even a brief information session by health care providers can lead to positive behavior change.19-21 This is particularly important, given that adults with diabetes currently are not consistently advised by health care providers to adopt a healthier lifestyle.22-26
To our knowledge, no study has been conducted to assess the impact of diabetes diagnosis as a potential teachable moment on screen-based sedentary behavior at the population level. Using data from a nationally representative health survey, this study fills in this gap by examining diabetes diagnosis in relation to screen-based sedentary behavior among US adults. If diabetes/prediabetes diagnosis qualifies for a teachable moment, we would expect that patients with diagnosed diabetes/prediabetes pay more attention to reducing their daily screen-based sedentary behavior in an effort to better manage their diabetic condition when compared with their counterparts who suffer from the same illness but are unaware of it (ie, people with undiagnosed diabetes/prediabetes). On the other hand, we would expect the screen-based sedentary behavior among those with undiagnosed diabetes/prediabetes to be similar to, if not more prevalent than, that among those without diabetes/prediabetes, because the former may not pay additional attention to their sedentary behavior owing to their unawareness of their diabetic condition. More specifically, we hypothesized that (1) people with diagnosed diabetes/prediabetes would be less likely to engage in prolonged screen-based sedentary behavior compared with people with undiagnosed diabetes/prediabetes and (2) the prevalence of prolonged screen-based sedentary behavior among people with undiagnosed diabetes/prediabetes would resemble or be higher than that among people without diabetes/prediabetes. Using data from the National Health and Nutrition Examination Survey (NHANES), we tested this hypothesis by examining the relationship between diabetes diagnosis status and screen-based sedentary behavior among US adults 20 years of age and older.
Methods
Survey Setting and Participants
Individual-level data came from the NHANES 2005-2006 and 2011-2012 waves. NHANES is a program of studies conducted by the National Center for Health Statistics (NCHS) to assess the health and nutritional status of children and adults. The program began in the early 1960s and periodically conducted separate surveys focusing on different population groups or health topics. Since 1999, NHANES has been conducted continuously in 2-year cycles and has a changing focus on a variety of health and nutrition measurements. A multistage probability sampling design is used to select participants representative of the civilian, noninstitutionalized US population. Certain population subgroups are oversampled to increase the reliability and precision of health status indicator estimates for these groups. Detailed information regarding the NHANES sampling design, questionnaires, clinical measures, and individual-level data can be found on its web portal (http://www.cdc.gov/nchs/nhanes.htm).
This study used data from the NHANES 2005-2006 and 2011-2012 waves because data on prediabetes diagnosis were unavailable in the NHANES 1999-2004 waves, and questions on television/video watching and computer/digital device use were only administered for children 2 to 11 years of age in the NHANES 2007-2010 waves.
Screen-Based Sedentary Behavior
Self-reported time spent on screen-based sedentary behavior was derived from the answers to the Global Physical Activity Questionnaire embedded in the NHANES. In the household interviews, participants were asked, “Over the past 30 days, on average about how many hours per day did you sit and watch TV or videos? Would you say: less than 1 hour, 1 hour, 2 hours, 3 hours, 4 hours, 5 hours or more, or do not watch TV or videos,” and “Over the past 30 days, on average about how many hours per day did you use a computer or play computer games outside of work or school? Include PlayStation, Nintendo DS, or other portable video games. Would you say: less than 1 hour, 1 hour, 2 hours, 3 hours, 4 hours, 5 hours or more, or do not use a computer outside of work or school.” Following Healy et al, 27 we constructed 3 dichotomous variables: daily television/video watching ≥2 hours, daily computer/digital device use ≥1 hour, and daily total screen time (television/video watching plus computer/digital device use) ≥3 hours.
Diabetes Measures
Following the definitions adopted by the Centers for Disease Control and Prevention 28 and An, 18 we classified survey respondents into 5 mutually exclusive categories based on their self-reported diabetes diagnoses and laboratory test results: diagnosed diabetes, diagnosed prediabetes, undiagnosed diabetes, undiagnosed prediabetes, and no diabetes/prediabetes. Diagnosed diabetes was identified by the answer of “yes” to the interview question, “Have you ever been told by a doctor or health professional that you have diabetes or sugar diabetes?” Diagnosed prediabetes was identified by the answer of “yes” to the interview question, “Have you ever been told by a doctor or other health professional that you have any of the following: prediabetes, impaired fasting glucose, impaired glucose tolerance, borderline diabetes or that your blood sugar is higher than normal but not high enough to be called diabetes or sugar diabetes?” and the answer of “prediabetes” when asked whether one had diabetes. Undiagnosed diabetes was identified by having a fasting plasma glucose (FPG) ≥7 mmol/L (126 mg/dL) or glycated hemoglobin (A1C) ≥48 mmol/mol (6.5%) but reporting absence of diagnosed diabetes. Undiagnosed prediabetes was identified by having 5.56 mmol/L (100 mg/dL) ≤ FPG < 7 mmol/L (126 mg/dL) or 39 mmol/mol (5.7%) ≤ A1C < 48 mmol/mol (6.5%) but reporting absence of diagnosed diabetes/prediabetes. Respondents with no diabetes/prediabetes were identified by having FPG <5.56 mmol/L (100 mg/dL) and A1C <39 mmol/mol (5.7%) and reporting absence of diagnosed diabetes/prediabetes.
Of the 4720 nonpregnant survey respondents 20 years of age and older assigned to a morning fasting session, the following participants were excluded from the analyses: missing test results for FPG or A1C, 91; missing values for self-reported diabetes/prediabetes diagnosis, 282; missing values for screen-based sedentary behavior, 6; and missing values for other individual characteristics, 651. The remaining 3690 survey respondents were included in the analysis.
Individual Characteristics
The following individual characteristics were adjusted in regression analyses: a dichotomous variable for sex (female, with male in the reference group); 3 categorical variables for age groups (35-49 years of age, 50-64 years of age, and 65 years of age and above, with 20-34 years of age in the reference group); 3 categorical variables for race/ethnicity (non-Hispanic African American, non-Hispanic other race or multirace, and Hispanic, with non-Hispanic white in the reference group); a dichotomous variable for education level (college education, with high school or lower education in the reference group); 2 categorical variables for marital status (divorced or separated or widowed, and never married, with married in the reference group); 2 categorical variables for household income level (130% ≤ income to poverty ratio [IPR] < 300%, and IPR ≥300%, with IPR <130% in the reference group); a dichotomous variable for body weight status (obesity—that is, body mass index [BMI] ≥30 kg/m2—with nonobesity [BMI < 30 kg/m2] in the reference group); a dichotomous variable for smoking status (ever or current smoker, with never smoker in the reference group); a dichotomous variable for self-rated health status (good or excellent self-rated health, with poor or fair self-rated health in the reference group); a dichotomous variable for health insurance status (any public or private health insurance coverage, with no health insurance in the reference group); 5 dichotomous variables for each of the chronic condition diagnoses of arthritis, coronary heart disease, stroke, cancer, and depression (with no diagnosis of a specific chronic condition as their corresponding reference group); and a dichotomous variable for survey wave (NHANES 2011-2012 wave, with NHANES 2005-2006 wave in the reference group).
Statistical Analyses
Logistic regressions were conducted to examine the relationship between diabetes diagnosis status and screen-based sedentary behavior among US adults, adjusting for individual characteristics. Separate regressions were estimated for the 3 dependent variables: daily television/video watching ≥2 hours, daily computer/digital device use ≥1 hour, and daily total screen time (television/video watching plus computer/digital device use) ≥3 hours. The key independent variables were 4 categorical variables for diabetes status (diagnosed diabetes, diagnosed prediabetes, undiagnosed diabetes, and undiagnosed prediabetes, with no diabetes/prediabetes in the reference group). We calculated the adjusted prevalence of screen-based sedentary behavior by diabetes status based on logistic regression estimates. The differences in the adjusted prevalence of screen-based sedentary behavior across diabetes status were tested using Wald tests.
All statistical analyses were conducted using Stata 13.0 MP version (StataCorp, College Station, TX). The NHANES sampling design was accounted for in both descriptive statistics and regression analyses.
Human Subjects Protection
The NHANES was approved by the NCHS Research Ethics Review Board. This study used the NHANES deidentified public data and was deemed exempt from human subjects review by the University of Illinois at Urbana-Champaign Institutional Review Board.
Results
Table 1 reports screen-based sedentary behavior, diabetes diagnosis status, and other individual characteristics of adult participants in the NHANES 2005-2006 and 2011-2012 waves. The population-weighted prevalence of daily television/video watching ≥2 hours was 67.47%, daily computer/digital device use ≥1 hour 41.12%, and daily total screen time ≥3 hours 56.48%. Nearly a quarter (23.75%) of the survey respondents had diabetes or prediabetes, where undiagnosed prediabetes accounted for 9.84%, undiagnosed diabetes 1.12%, diagnosed prediabetes 4.23%, and diagnosed diabetes 8.55%.
Individual Characteristics of Adult Participants, 2005-2006 and 2011-2012 NHANES. a
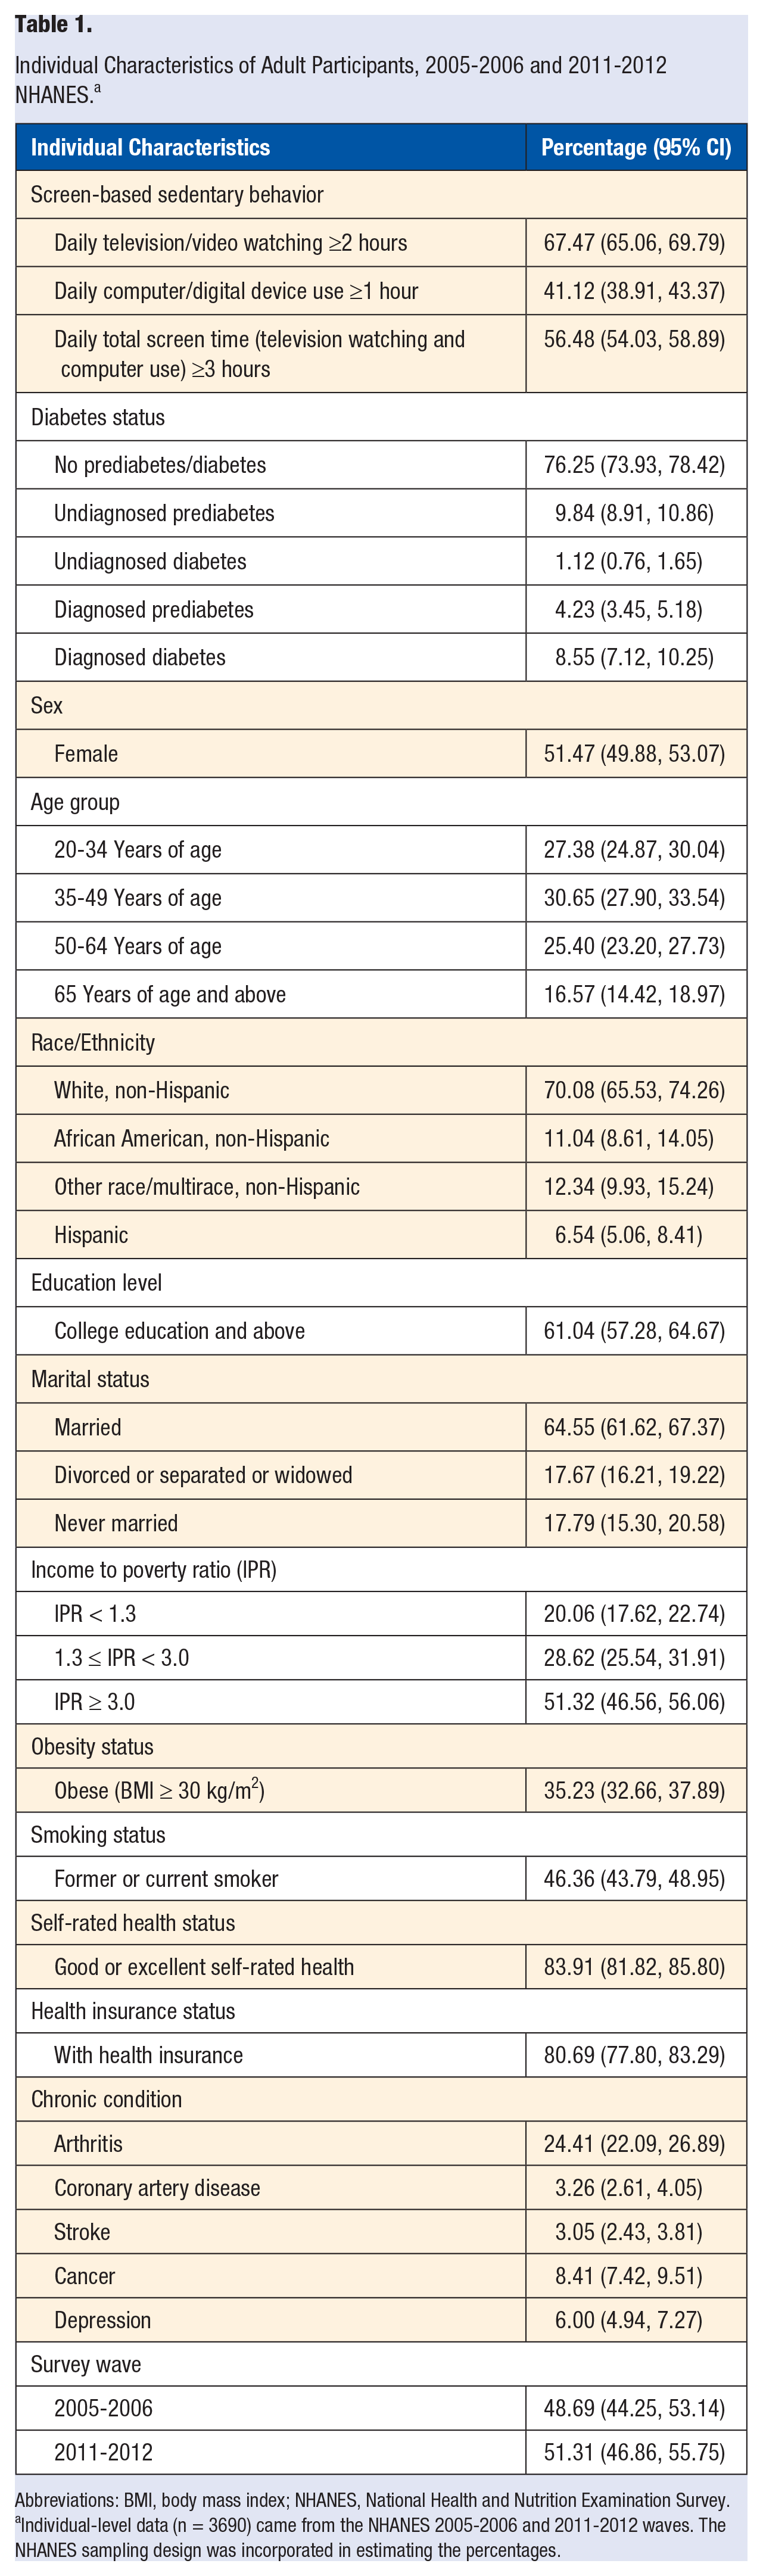
Abbreviations: BMI, body mass index; NHANES, National Health and Nutrition Examination Survey.
Individual-level data (n = 3690) came from the NHANES 2005-2006 and 2011-2012 waves. The NHANES sampling design was incorporated in estimating the percentages.
Table 2 reports screen-based sedentary behavior by diabetes diagnosis status. Compared with their counterparts with undiagnosed diabetes, the population-weighted values for prevalence of daily television/video watching ≥2 hours (83.68% vs 70.85%), daily computer/digital device use ≥1 hour (34.25% vs 29.48%), and daily total screen time ≥3 hours (72.55% vs 51.01%) were markedly higher among adults with diagnosed diabetes. The population-weighted prevalence of daily television/video watching ≥2 hours among adults with diagnosed prediabetes (75.06%) was lower than that among adults with undiagnosed prediabetes (79.00%), whereas the prevalence of daily computer/digital device use ≥1 hour among adults with diagnosed prediabetes (45.53%) was higher than that among adults with undiagnosed prediabetes (38.47%). As a whole, the prevalence of daily total screen time ≥3 hours was similar among those with diagnosed prediabetes (64.65%) and undiagnosed prediabetes (65.53%).
Unadjusted Screen-Based Sedentary Behaviors by Diabetes Status Among Adult Participants, 2005-2006 and 2011-2012 NHANES. a
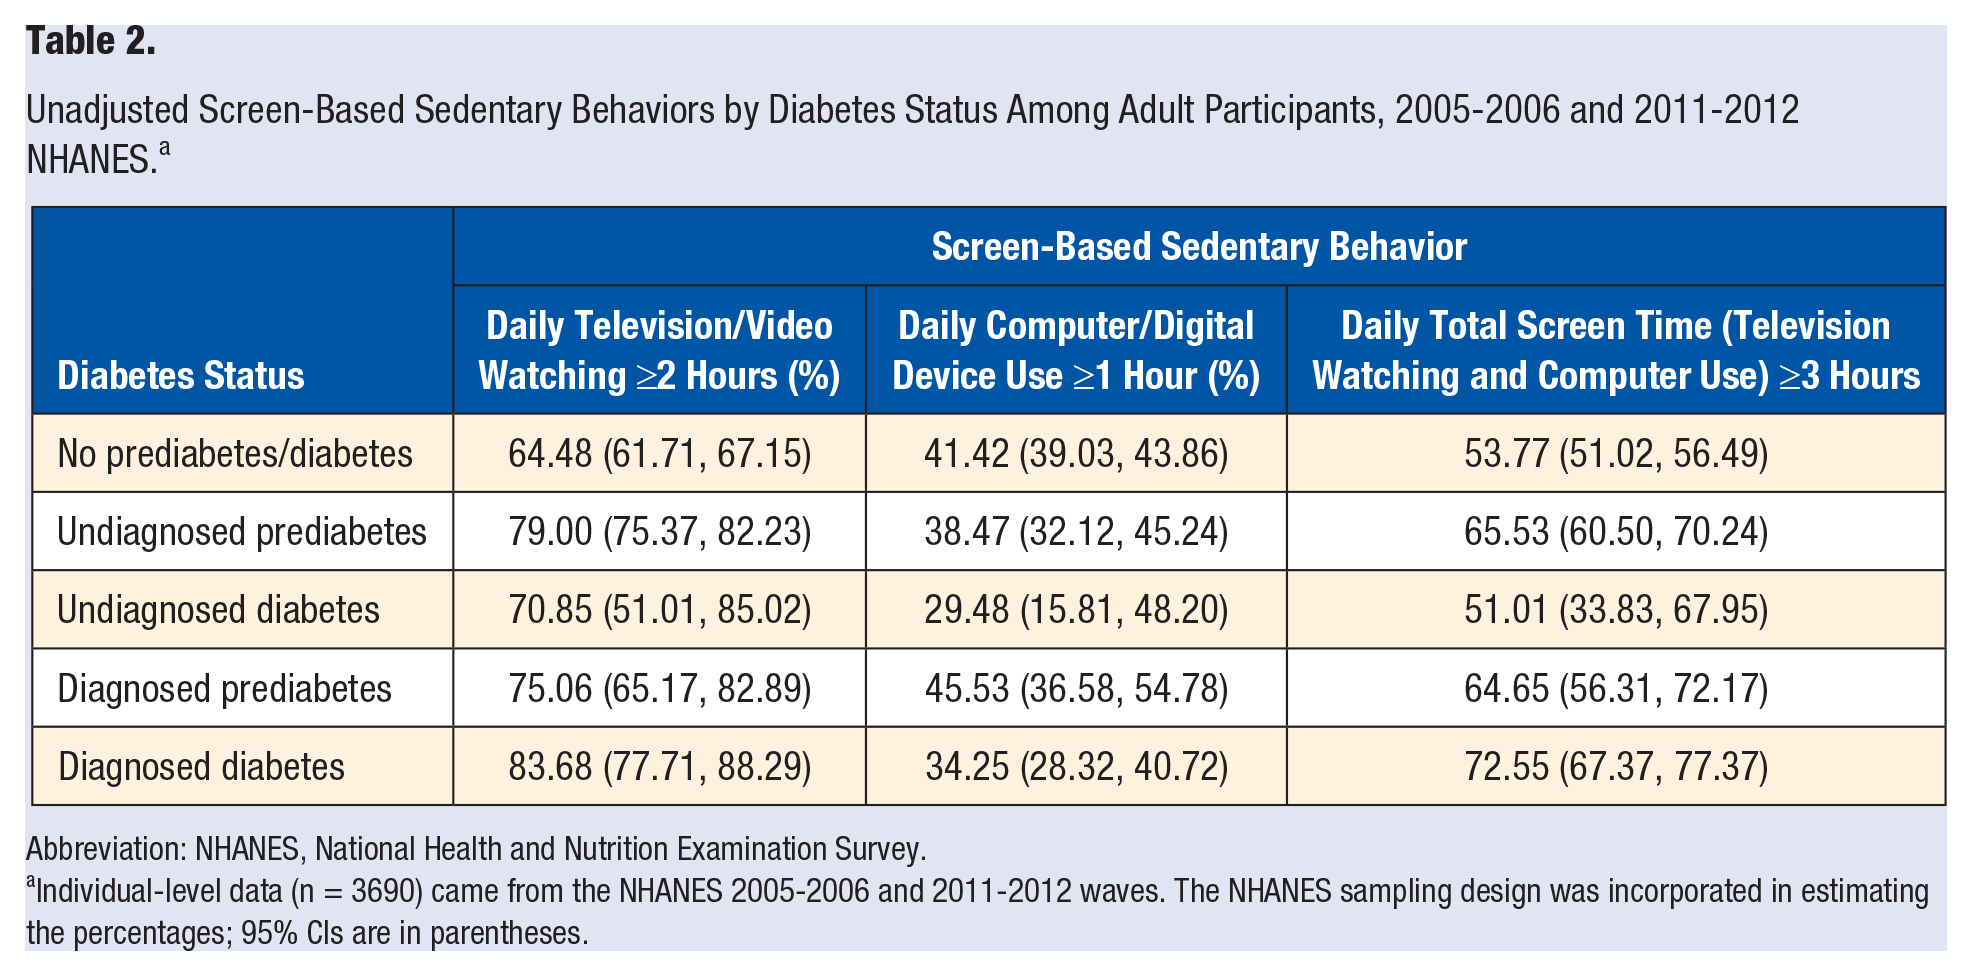
Abbreviation: NHANES, National Health and Nutrition Examination Survey.
Individual-level data (n = 3690) came from the NHANES 2005-2006 and 2011-2012 waves. The NHANES sampling design was incorporated in estimating the percentages; 95% CIs are in parentheses.
Table 3 reports the estimated odds ratios of screen-based sedentary behavior in logistic regressions. After adjusting for individual characteristics, the odds of daily television/video watching ≥2 hours and daily total screen time ≥3 hours among people with diagnosed diabetes were 69% (adjusted odds ratio [AOR] = 1.69; 95% CI = 1.06, 2.68) and 59% (AOR = 1.59; 95% CI = 1.20, 2.12) higher than those of their counterparts without diabetes/prediabetes, respectively. In contrast, no difference in the odds of daily computer/digital device use ≥1 hour was found between people with diagnosed diabetes and those without diabetes/prediabetes (P > .05). Moreover, no difference in the odds of daily television/video watching ≥2 hours, daily computer/digital device use ≥1 hour, and daily total screen time ≥3 hours was found among people with undiagnosed diabetes and diagnosed prediabetes in comparison to those without diabetes/prediabetes (P > .05). Compared with their counterparts without diabetes/prediabetes, the odds of daily television/video watching ≥2 hours was 39% (AOR = 1.39; 95% CI = 1.06, 1.84) higher among people with undiagnosed prediabetes, whereas the odds of daily computer/digital device use ≥1 hour and daily total screen time ≥3 hours were not found to differ between these 2 groups (P > .05).
Adjusted Odds Ratios of Screen-Based Sedentary Behaviors in Logistic Regressions. a
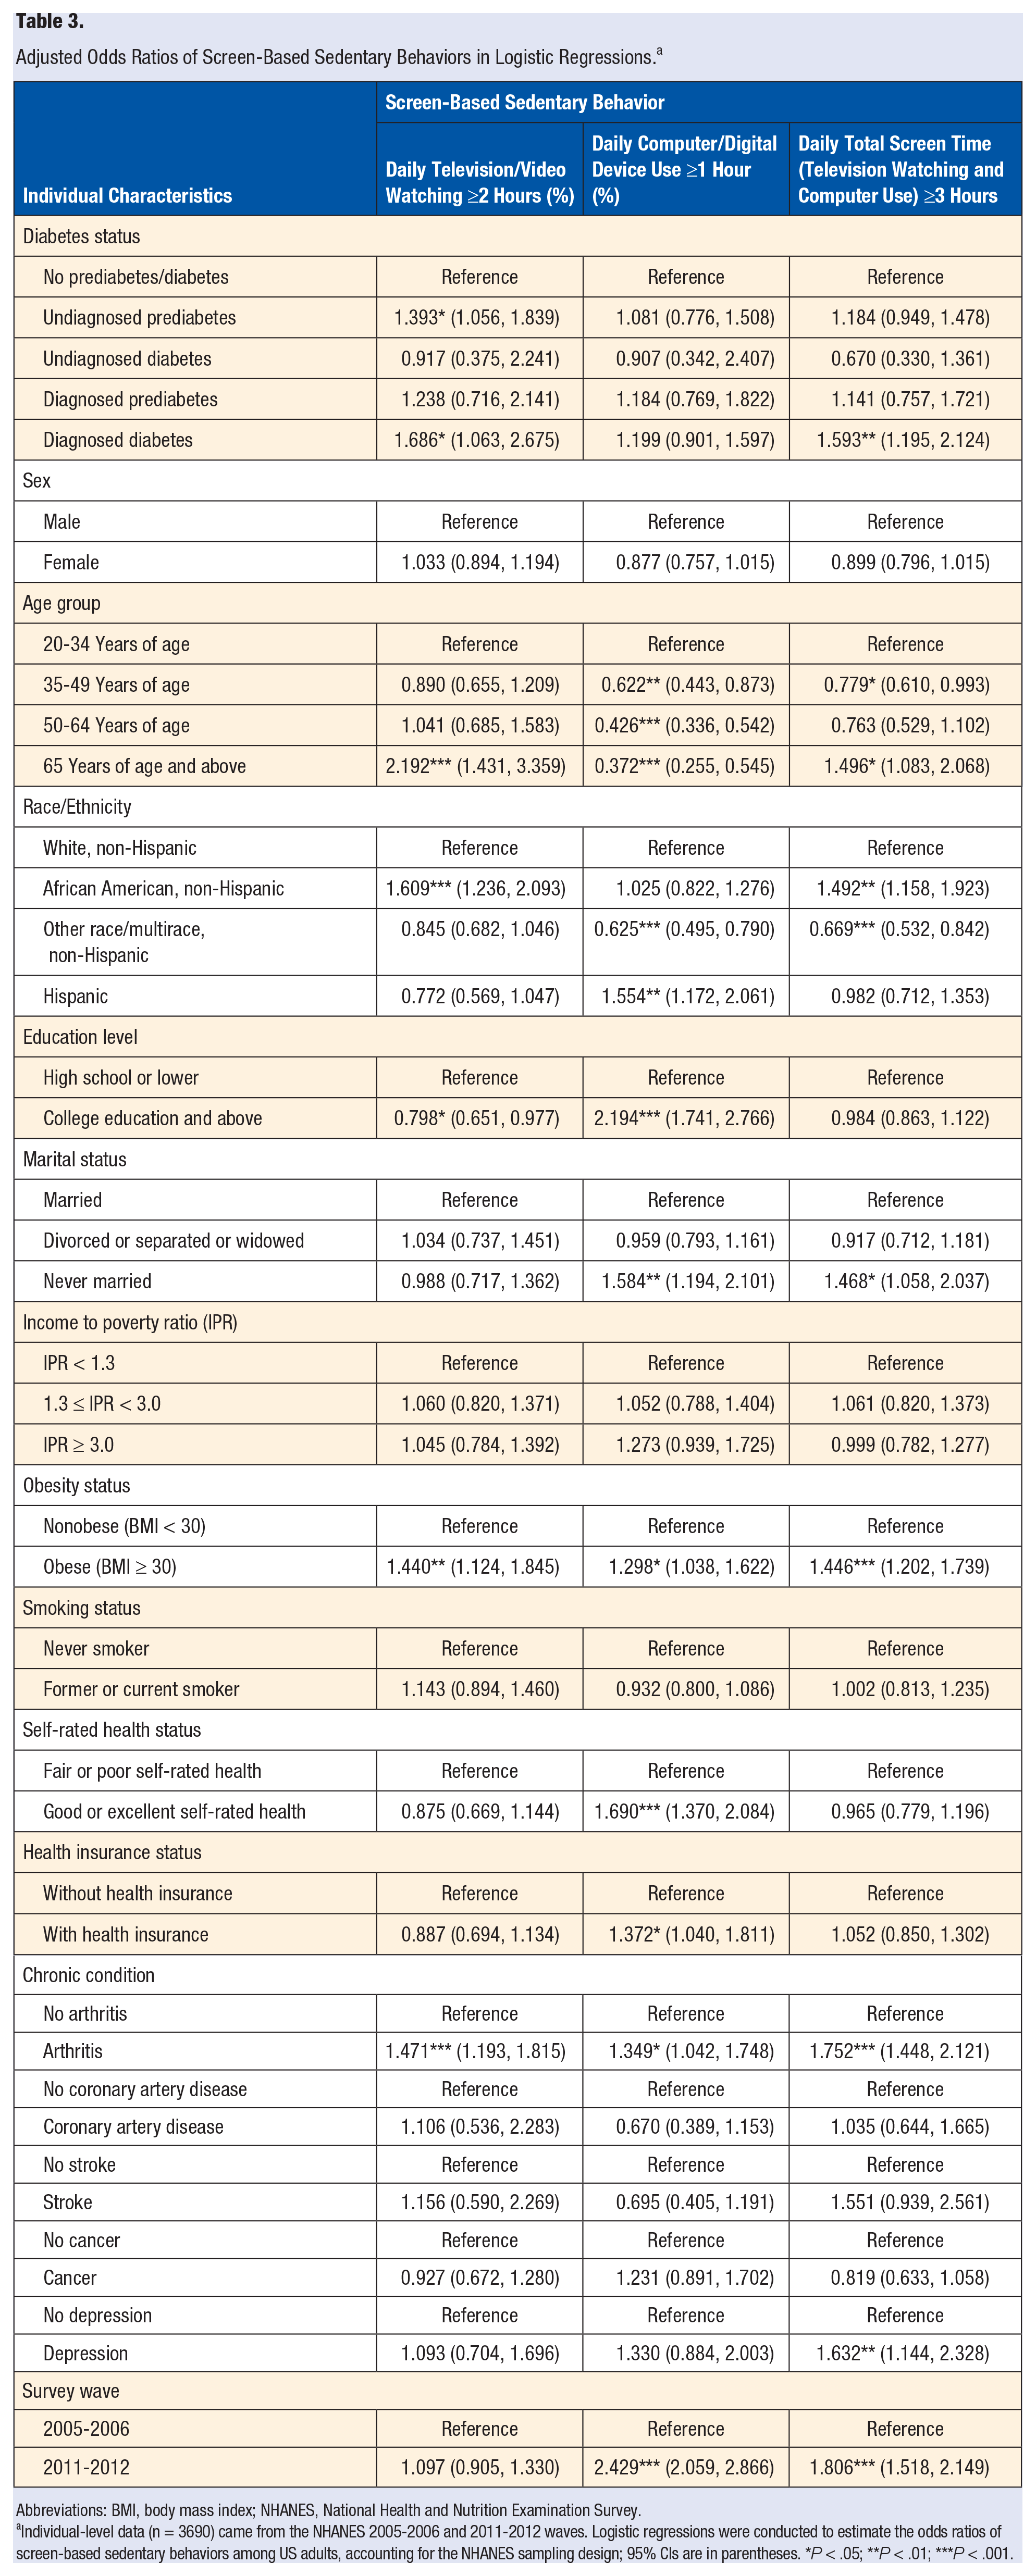
Abbreviations: BMI, body mass index; NHANES, National Health and Nutrition Examination Survey.
Individual-level data (n = 3690) came from the NHANES 2005-2006 and 2011-2012 waves. Logistic regressions were conducted to estimate the odds ratios of screen-based sedentary behaviors among US adults, accounting for the NHANES sampling design; 95% CIs are in parentheses. *P < .05; **P < .01; ***P < .001.
As for other individual characteristics, adults 65 years of age and older, African Americans, and adults with obesity and arthritis were significantly more likely to watch television/video for 2 or more hours on a daily basis compared with young and middle-aged adults 20 to 64 years of age, non-Hispanic whites, and adults without obesity and arthritis, respectively. Hispanics, adults with college education or above, those never married, adults with good or excellent self-rated health, those covered by health insurance, and adults with obesity and arthritis were significantly more likely to use computers/digital devices for 1 or more hours on a daily basis compared with non-Hispanic whites; adults with high school or lower education; those married, divorced, separated, or windowed; adults with fair or poor self-rated health; those without health insurance; and those without obesity and arthritis, respectively. Adults 65 years of age and older; African Americans; adults with obesity, depression, and arthritis; and those never married were significantly more likely to watch television/video or use computer/digital devices for 3 or more hours on a daily basis compared with young and middle-aged adults 20 to 64 years of age; non-Hispanic whites; adults without obesity, depression, and arthritis; and those married, divorced, separated, or windowed, respectively.
Table 4 reports the adjusted prevalence of screen-based sedentary behavior based on the logistic regression estimates. Compared with their counterparts with undiagnosed diabetes, the adjusted values for prevalence of daily television/video watching ≥2 hours (77.45% vs 65.14%), daily computer/digital device use ≥1 hour (43.20% vs 36.52%), and daily total screen time ≥3 hours (66.75% vs 45.78%) were noticeably higher among adults with diagnosed diabetes, although only the difference in the prevalence of daily total screen time ≥3 hours was statistically significant (P < .05). The adjusted values for prevalence of daily television/video watching ≥2 hours (71.61% vs 73.95%), daily computer/digital device use ≥1 hour (42.87% vs 40.68%), and daily total screen time ≥3 hours (58.98% vs 59.87%) were similar between adults with diagnosed prediabetes and those with undiagnosed prediabetes.
Adjusted Screen-Based Sedentary Behaviors by Diabetes Status Among Adult Participants, 2005-2006 and 2011-2012 NHANES. a
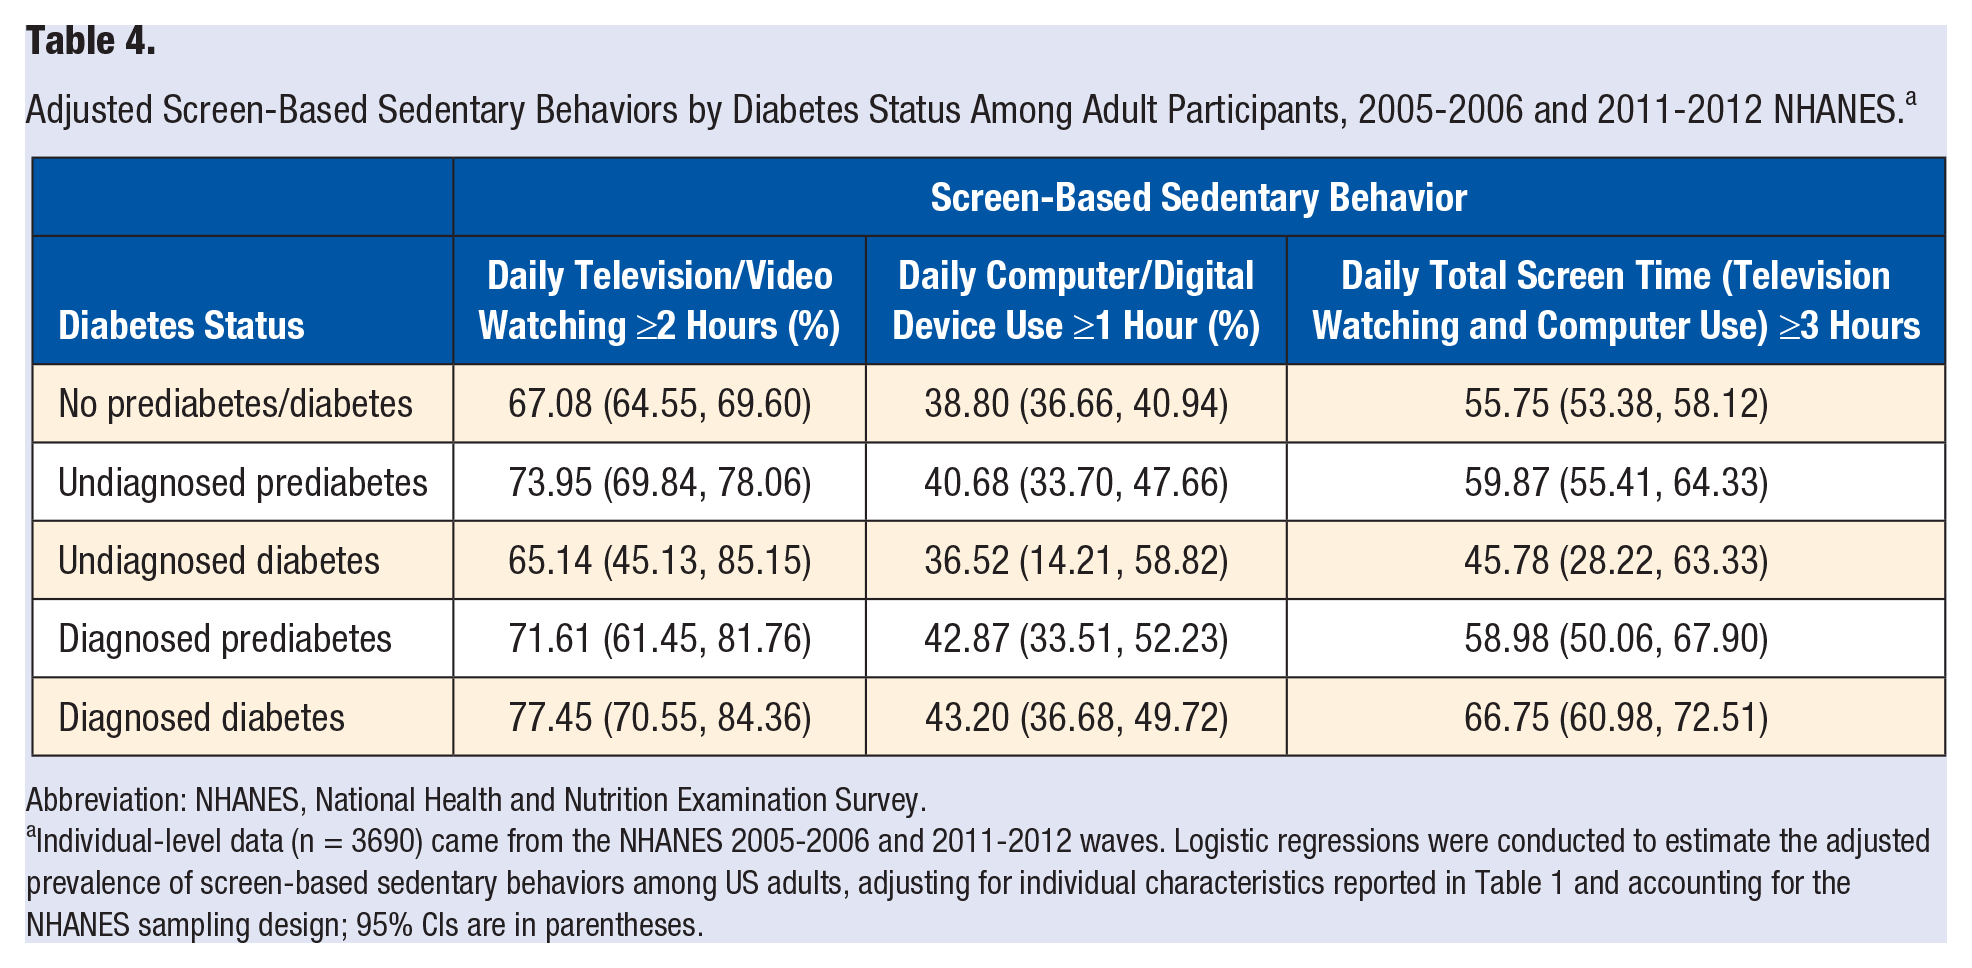
Abbreviation: NHANES, National Health and Nutrition Examination Survey.
Individual-level data (n = 3690) came from the NHANES 2005-2006 and 2011-2012 waves. Logistic regressions were conducted to estimate the adjusted prevalence of screen-based sedentary behaviors among US adults, adjusting for individual characteristics reported in Table 1 and accounting for the NHANES sampling design; 95% CIs are in parentheses.
Discussion
Using nationally representative health survey data from the NHANES 2005-2006 and 2011-2012 waves, this study examined the relationship between diabetes diagnosis and screen-based sedentary behavior among US adults. Compared with their counterparts without diabetes/prediabetes, the odds of daily television/video watching ≥2 hours was substantially higher among people with undiagnosed prediabetes. No difference in the odds of daily television/video watching ≥2 hours, daily computer/digital device use ≥1 hour, and daily total screen time ≥3 hours was found among people with undiagnosed diabetes in comparison to those without diabetes/prediabetes. Compared with their counterparts with undiagnosed diabetes, the adjusted prevalence of daily television/video watching ≥2 hours, daily computer/digital device use ≥1 hour, and daily total screen time ≥3 hours were all higher among adults with diagnosed diabetes. On the other hand, such prevalence measures were similar between adults with diagnosed prediabetes and those with undiagnosed prediabetes.
Findings of this study were largely consistent with our hypothesis that the prevalence of prolonged screen-based sedentary behavior among people with undiagnosed diabetes/prediabetes would resemble or be higher than that among people without diabetes/prediabetes. This could result from the lack of attention paid by people with undiagnosed diabetes/prediabetes to their sedentary behavior as a result of condition unawareness. In contrast, study findings contradicted our hypothesis that people with diagnosed diabetes/prediabetes would be less likely to engage in prolonged screen-based sedentary behavior compared with people with undiagnosed diabetes/prediabetes. In other words, we failed to provide evidence regarding diabetes diagnosis as a potential teachable moment that may motivate newly diagnosed patients to adopt a more active lifestyle by reducing screen-based sedentary behavior. In contrast, the adjusted rate of daily television/video watching ≥2 hours, daily computer/digital device use ≥1 hour, and daily total screen time ≥3 hours were found to be higher in adults with diagnosed diabetes than those with undiagnosed diabetes, whereas no differences in such prevalence measures were found between adults with diagnosed prediabetes and those with undiagnosed prediabetes.
A few factors could contribute to the inconsistency between the study findings and the teachable moment hypothesis. It could be possible that people newly diagnosed with diabetes were only temporarily motivated to change their sedentary behavior, but as time went on, they were back to their original inactive lifestyle. However, the NHANES data did not include information regarding the time when a patient was diagnosed with diabetes, so that the mediating role of time since initial diagnosis on screen-based sedentary behavior could not be tested. On the other hand, the possibility that diabetes diagnosis did not affect screen-based sedentary behavior could not be ruled out. Xiang 29 examined chronic disease diagnosis as a teachable moment for health behavior change among a nationally representative sample of middle-aged and older adults. No significant change in physical activity level was found after a diabetes diagnosis.
Providers are increasingly encouraged to seize teachable moments during disease diagnoses and client visits to provide information and guidance on health prevention and promotion behaviors such as healthful diet, physical activity, and weight management.30,31 However, multiple barriers such as lack of standardized and evidence-based measures and education tools, time constraint, and lack of communication and motivational interviewing skills often prevent providers from effectively using these teachable moments to promote behavior change.32,33 Specific techniques based on the principles of motivational interviewing have been suggested to help health care providers better utilize teachable moments, which include conveying empathy with the patient’s current position, encouraging the patient to present the arguments for change, actively involving the patient in the effort of problem solving, and building the patient’s self-confidence, so that the patient is able to overcome hurdles and succeed in changing behaviors. 34
A few limitations of this study should be noted. The findings on the association between diabetes diagnosis and screen-based sedentary behavior are at best preliminary and should not be interpreted as a causal relationship. The cross-sectional study design precludes examining life events and behaviors by chronological order, so that we do not know whether a maintenance or modification in screen-based sedentary behavior precedes or follows a diabetes diagnosis and, therefore, could not rule out the possibility of reverse causality. Moreover, people with diagnosed diabetes/prediabetes could be different from those with undiagnosed diabetes/prediabetes in regard to disease history, severity, comorbidity, and so on, and these differences might confound the relationship between diabetes diagnosis and screen-based sedentary behavior. Approximately 22% of the NHANES sample was excluded from the analysis because of missing values on test results, screen-based sedentary behavior measures, and/or other individual characteristics. If those who did not answer the questions regarding screen-based sedentary behavior were more likely to engage in that behavior compared with those who answered the questions, and those who did not take the FPG and A1C test were more or less likely to have undiagnosed diabetes/prediabetes compared with their counterparts who took the tests, respectively, we could overestimate or underestimate the impact of diabetes diagnosis on screen-based sedentary behavior. Screen-based sedentary data were measured by a self-reported questionnaire, which could be subject to measurement errors and possible underestimation of sedentary behavior as a result of social desirability bias. Despite a relatively large total sample size, undiagnosed diabetes cases (n = 41) and diagnosed prediabetes cases (n = 156) constituted only 1.12% and 4.23% of the sample, respectively. This might compromise model estimation precision and partially explain the lack of statistical significance in the difference of adjusted prevalence of screen-based sedentary behaviors between those with diagnosed prediabetes and those with undiagnosed prediabetes. The time span of patients living with diabetes/prediabetes might play a role in their screen-based sedentary behavior (eg, lack of novelty over time or sustained behavior change after diagnosis), but such data were not available in the NHANES. The NHANES is a probability sample of the US noninstitutionalized population, and patients in penal/mental facilities, institutionalized older adults, and/or military personnel on active duty are not represented.
In conclusion, this study examined the relationship between diabetes diagnosis and screen-based sedentary behavior among US adults, using data from a nationally representative health survey. Logistic regressions were conducted to examine the relationship between diabetes diagnosis and screen-based sedentary behavior, adjusting for individual characteristics and sampling design. Compared with those with undiagnosed diabetes, the adjusted prevalence of daily television/video watching ≥2 hours, computer/digital device use ≥1 hour, and total screen time ≥3 hours were all noticeably higher among adults with diagnosed diabetes, although only the difference in the prevalence of daily total screen time was statistically significant. Such prevalence measures were similar between adults with diagnosed and undiagnosed prediabetes. In conclusion, no evidence was found for diabetes diagnosis as a teachable moment in reducing screen-based sedentary behavior in US adults.
Footnotes
Declaration of Conflicting Interests
The author(s) declared no potential conflicts of interest with respect to the research, authorship, and/or publication of this article.
Funding
The author(s) received no financial support for the research, authorship, and/or publication of this article.
Ethical Approval
Not applicable, because this article does not contain any studies with human or animal subjects.
Informed Consent
Not applicable, because this article does not contain any studies with human or animal subjects.
Trial Registration
Not applicable, because this article does not contain any clinical trials.