
Abstract
Fires are the third leading cause of unintentional home injury deaths. Young children and older adults are especially at risk for home fire deaths. Other high-risk groups include males, people with physical disabilities, people impaired by alcohol or other drugs, and people living in rural communities or in poverty. Lifestyle decisions (eg, choosing products) and behaviors (eg, maintaining working smoke alarms or smoking) can influence the risk of being in and surviving a home fire. Fortunately, medical practitioners can foster safer home environments for their patients by promoting effective fire prevention and protection strategies to reduce home fire risks. This review highlights the association between lifestyle and home fires with a focus on achievable lifestyle changes that can prevent fires and fire-related injuries and deaths.
People spend about half of their day inside their homes. 1 Homes are an important intersection for lifestyle and health issues because these environments can pose risks for many types of injuries. In fact, the home is the second most common location for unintentional injury deaths in the United States, following motor vehicle deaths. 2 The risk for home-related injuries is affected by occupants’ lifestyle decisions and behaviors. 3
In 2008, approximately 54 500 people suffered fatal unintentional injuries in the home environment. Fires were the third leading cause of these deaths. 4 For 2003-2007, estimates indicate that there were more than 1000 reported home fires each day. These home fires resulted in a civilian injury every 40 minutes and a civilian death about every 3 hours. 5
Lifestyle is reflected in peoples’ attitudes and beliefs, decisions, possessions, and behaviors. People regularly make decisions about the products they buy, use, maintain, repair, or replace; how their home is arranged; what children are allowed to do; and what activities are important enough to pursue now and what can be put off to the future. Many lifestyle practices can be altered to create a fire-safe home environment where individuals can live to their full potential. This review highlights the association between lifestyle and home fires with a focus on achievable lifestyle changes that can prevent fires and fire-related injuries and deaths.
Epidemiology of Home Fires
Overall Burden
Home fires are a major public health concern that result in substantial morbidity, mortality, and economic cost. In 2008, an estimated 515 000 structure fires were reported to local fire departments in the United States, of which 75% (n = 386 500) occurred in homes*; this resulted in more than $8.2 billion in property damage. 6 The actual number of fires is much greater. It has been estimated that only 3.4% of home fires are attended by fire departments. 7 Deaths from fires and burns are the sixth most common cause of unintentional injury deaths in the United States 8 and the third leading cause of fatal home injury. 4
Many lifestyle practices can be altered to create a fire-safe home environment where individuals can live to their full potential.
In 2008, home fires caused an estimated 2755 deaths and 13 160 reported civilian (non–fire service) injuries. 6 Based on the sum of medical expenditures and lost productivity due to morbidity and mortality, the total US lifetime costs of injuries that occurred in 2000 from fire and burns was $7.5 billion. 9 Although the numbers of home fires, and fire-related injuries and deaths, have gradually declined over the past 30 years, the United States continues to have a relatively high death rate compared with other countries. In the years 2004-2006, the United States had the eighth highest rate among the 25 developed countries for which statistics are available. 10
Causes and Circumstances
Fire prevention efforts should be guided by the causes and risk factors for home fires and fire-related injuries and deaths. Risk factors that cannot be modified, such as age, may identify the groups of individuals on which to focus prevention efforts. Modifiable risk factors, such as cigarette smoking, firesetting or fireplay, or characteristics of products installed or used in the home, are potential target areas for behavior or environmental changes.
Main Causes
Figure 1 presents important causes and circumstances of reported home fires during 2003-2007.
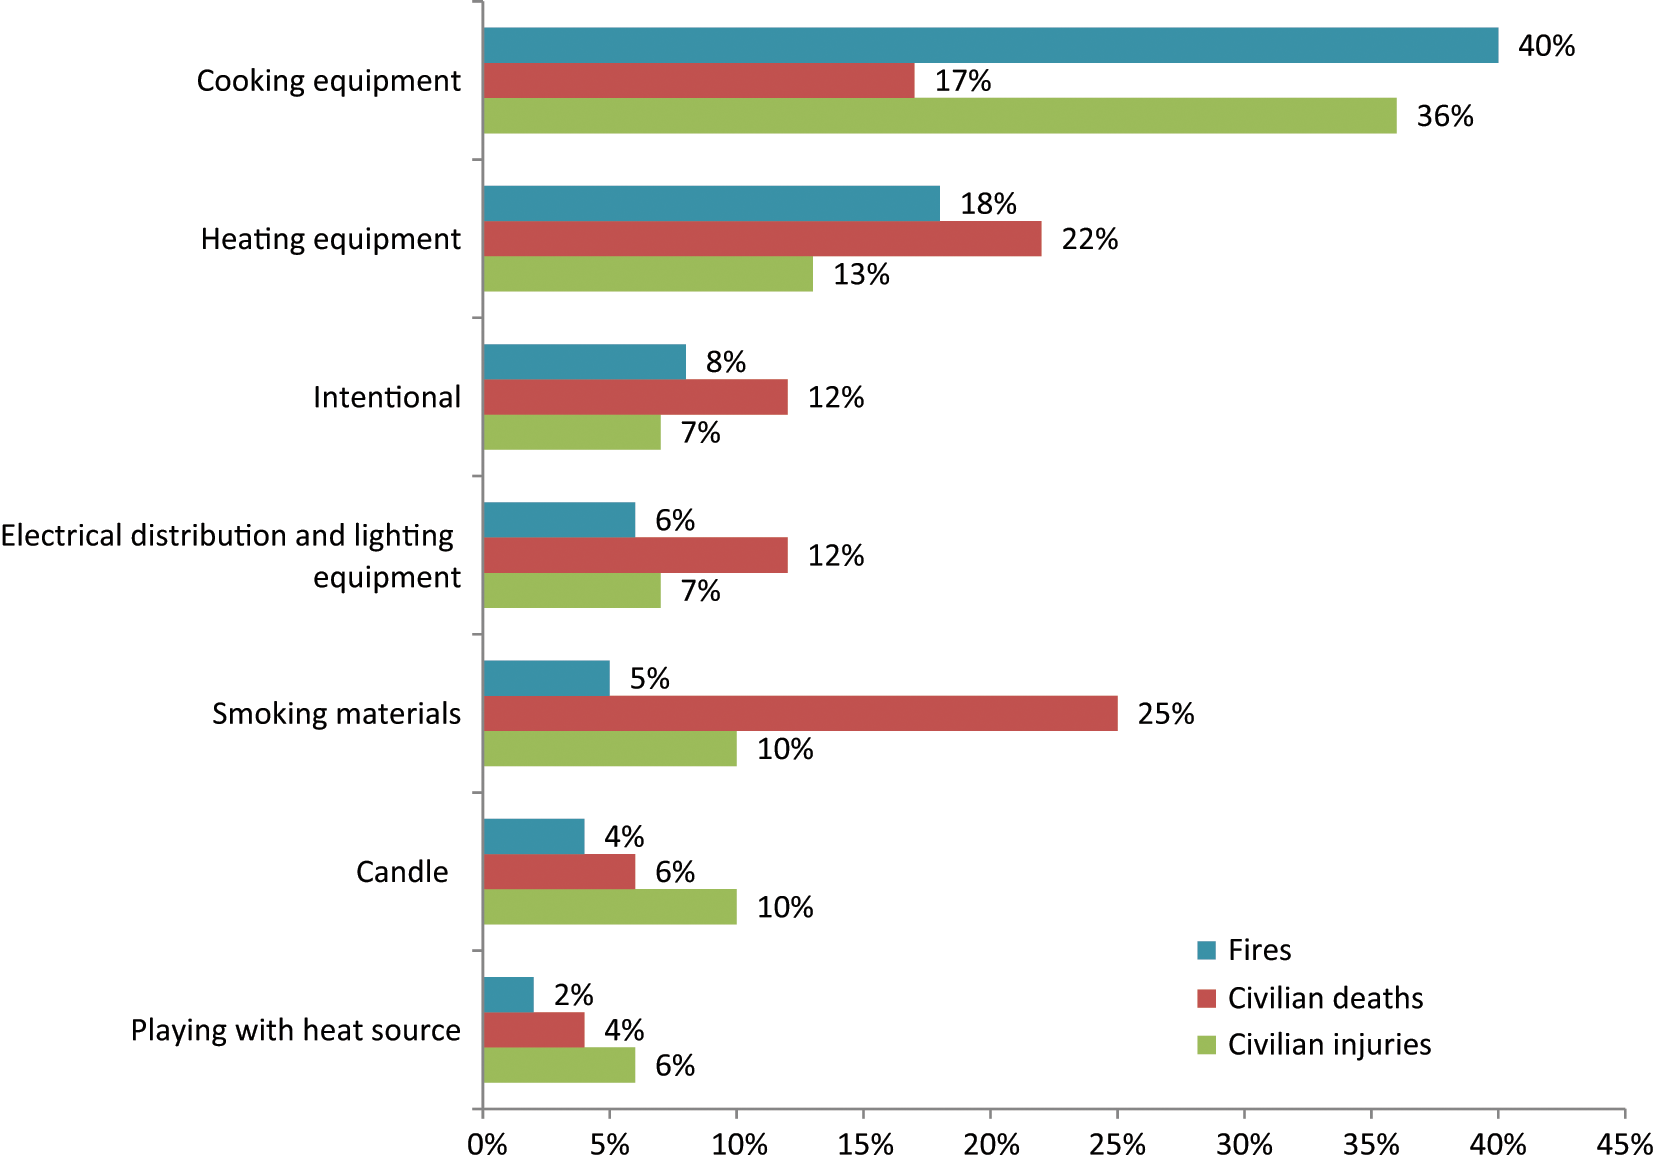
Leading Causes of Home Fires, United States, 2003-2007.
Cooking equipment
Cooking is the leading cause of both home fires and fire injuries as well as the third leading cause of home fire deaths. From 2003 to 2007, cooking equipment was involved in 2 of every 5 reported home fires (an average of 151 300 per year), more than one third of the reported home fire injuries (an average of 4690 per year), and nearly 1 in 5 home fire deaths (an average of 480 per year). 5 Cooking is also the leading cause of fires handled without fire department assistance. The Consumer Product Safety Commission (CPSC) found that from 2004 to 2005, for every household cooking fire reported to the fire department, US households experienced nearly 50 cooking equipment fires that they did not report. 7
In a 2009 report, Ahrens indicated that more than half (57%) of the civilians injured in reported cooking fires were trying to fight the fire themselves. Unattended cooking was by the far the leading contributing factor in home cooking fires. 11 The second leading factor was items too close to the cooking equipment that caught fire. Although fire departments are rarely called to incidents because someone’s clothing has caught fire, 13% of the cooking fire deaths resulted from this scenario. The third leading factor, cooking devices that were unintentionally turned on (eg, activating the wrong stovetop range or having the controls unintentionally turned on by a child or pet) or not turned off (eg, forgetting to turn off a stovetop range after removing a pot of boiling water), can result in unattended equipment operation. This factor was cited in a larger share of fires involving electric ranges than gas ranges. Households that use electric ranges had a higher overall risk of fire and associated losses than those that used gas ranges.
Cooking fires are more likely to occur during frying than in other types of cooking. A CPSC study determined that almost two thirds (63%) of kitchen range fires that began when food caught fire were associated with frying. Boiling was a distant second and accounted for 18% of these fires. 12 A total of 83% of the frying ignitions began in the first 15 minutes of cooking compared with only 6% of the fires associated with boiling. A 1998 New Zealand study found that factors most likely to result in a fire from cooking oil or fat included forgetting to turn off the heat (30%), being distracted (eg, doing chores) and leaving cooking food unattended (23%), setting the stove or element’s temperature too high (20%), and adding or removing cooking food from the pan (10%). 13
Heating equipment
During 2003-2007, heating equipment ranked second in causing home fires, home fire injuries, and home fire deaths, and first in direct property damage. Heating equipment contributed to 67 200 reported home fires per year and resulted in an average of 1660 civilian injuries, 610 civilian fire deaths, and $846 million in direct property damage. 5
Heating equipment was involved in 18% of the reported home fires, 13% of the home fire injuries, 22% of the home fire deaths, and 13% of the direct property damage. Space heaters, including portable heaters and those that are permanently installed, were involved in more than three quarters of the home heating fire deaths. 5 Hall 14 noted that space heating also poses a much higher risk of fire, death, injury, and loss per million users than central heating. A failure to clean equipment was a factor in one quarter of home heating fires, with creosote build-up in chimneys being a common cause. 14
Intentional fires
During 2003-2007, intentional firesetting caused an average of 29 000 reported home fires. In all, 8% of home fires were intentionally set. Intentional home fires caused 7% (n = 940) of home fire injuries and 12% (n = 330) of home fire deaths. 5 The leading causes for all reported intentionally set fires (not just home fires) were fireplay or curiosity (25%), a personal motive (20%), thrills (16%), unclassified (12%), intimidation (9%), auto theft concealment (9%), domestic violence (6%), and insurance fraud (5%). 15 Statistics from the Federal Bureau of Investigation, cited in the same report, show that roughly half of the people arrested for arson were younger than 18 years.
Electrical distribution and lighting equipment
During 2003-2007, electrical distribution and lighting equipment ranked fourth in home fires and home fire deaths, sixth in home fire injuries, and second in direct property damage. Electrical distribution and lighting equipment was involved in the ignition of approximately 22 000 reported home fires per year. These fires caused an annual average of 880 civilian fire injuries and 350 civilian fire deaths. Electrical distribution or lighting equipment was involved in 6% of the home fires, 12% of the home fire deaths, 7% of the home fire injuries, and 11% of the direct property damage. 5 Specific risks for these types of fires include overloaded extension cords or plugs, original wiring or repairs not done to code, deteriorated electrical components or insulation, loose connections, damaged cords or plugs, and the use of bulbs with wattage too high for light fixtures.16,17
Additionally, electrical problems can play a role in fires involving any type of equipment powered by electricity (eg, cooking, heating, office and entertainment equipment, washers, and dryers), as well as electrical distribution and lighting equipment. 5 Electrical failures or malfunctions were factors in 14% of reported home fires, 18% of home fire deaths, 11% of home fire injuries, and 11% of the direct property damage. 5
Smoking materials
Smoking materials have historically been the leading cause of home fire deaths and the period 2003-2007 was no different. Although only 5% (n = 19 400) of reported home fires per year were started by cigarettes or other smoking materials (excluding matches and lighters), these fires caused 1 of every 4 home fire deaths. 5 Hall 18 noted that smokers were not the only victims of these fires; 1 out of 4 fatal victims of smoking material fires was not the smoker whose cigarette started the fire.
One of every 5 smoking material home fires started in the bedroom whereas 1 in 10 started in the living room, family room, or den. Roughly one third of the smoking material deaths occurred in each of these 2 areas. 5
Another risk factor is smoking in the presence of home medical oxygen equipment. During 2002-2005, medical oxygen administration equipment was involved in an average of 46 home fire deaths per year. Smoking materials were the heat source in roughly three quarters of these deaths. 19
States with high fire death rates also tend to have high smoking rates. 20 Six of the 10 states with the highest 2002-2006 average population-based fire death rates were in the top 10 nationally for current smokers. 21 It is important to acknowledge that although the losses from smoking remain high, home fires started by smoking materials fell 73% from 1980 to 2007, whereas associated fire deaths fell 64%. 18
Candles
Candles are the third leading cause of reported home fire injuries. During 2003-2007, candles started an average of 15 300 home fires annually. These fires caused an average of 170 civilian deaths and 1290 civilian injuries per year. Overall, candles caused 4% of the home fires, 6% of the home fire deaths, and 10% of the home fire injuries. More than half (55%) of these fires occurred when the candle was too close to something that could catch fire. More than one third (36%) of these fires started in a bedroom. 5 Candle fires peak around the winter holidays. 22
Playing with fire (heat source)
During 2003-2007, individuals (typically children) playing with fire or other heat sources started an average of 7900 home fires. These fires caused an average of 120 civilian fire deaths, 790 civilian fire injuries, and $201 million in direct property damage per year. Home fires started by someone playing with fire or some other heat source represented only 2% of all home fires, yet 6% of home fire injuries, 4% of the home fire deaths, and 3% of the direct property damage. 5
Risk Factors (Individual)
Age and Gender
Age is a risk factor for experiencing a home fire and its consequences. Children younger than 5 years and adults 65 years and older are the 2 highest risk age groups. Children younger than 5 years, and infants in particular, are at increased risk for home fire deaths because of limited awareness of fire dangers and the inability to safely exit a house during a fire without the assistance of an adult. Although young children are not at an increased risk of fire injuries, data from the CPSC’s National Electronic Injury Surveillance System indicates that children younger than 5 years face a disproportionate burden of nonfire burn injuries from cooking equipment, tableware, and cookware. In 2008, this age group suffered an estimated 41% of thermal nonfire burns associated with range or ovens (usually caused by contact with the equipment); 37% of thermal nonfire burns (mostly contact burns) associated with grills or barbecues, 52% of scald burns associated with tableware such as coffee cups and soup bowls, 14% of scald burns from cookware such as pots and pans, 30% of scald burns from ranges or ovens, 11% of scald burns associated with microwave ovens, and 25% of burns from contact with hot cookware. 11
Older adults are more vulnerable in a fire than the general population, because of a combination of factors, including limited mobility, a greater probability of mental and physical disabilities, and greater use of medications.23-25 These risk factors are associated with increased age and consequently older adults aged 65 years and older have death rates from residential fire that are 2.8 times higher than the overall population, and those 85 years and older have rates that are 4 times higher (Figure 2). 8 Older adults are also one of the fastest growing segments of the US population; estimates indicate that the older adult population will become the largest age group, doubling in size by the year 2050 and reaching approximately 86 million individuals, or 20% of the population. 26 Therefore, this fast growing and highly vulnerable population should receive special consideration from medical practitioners and other fire safety professionals.
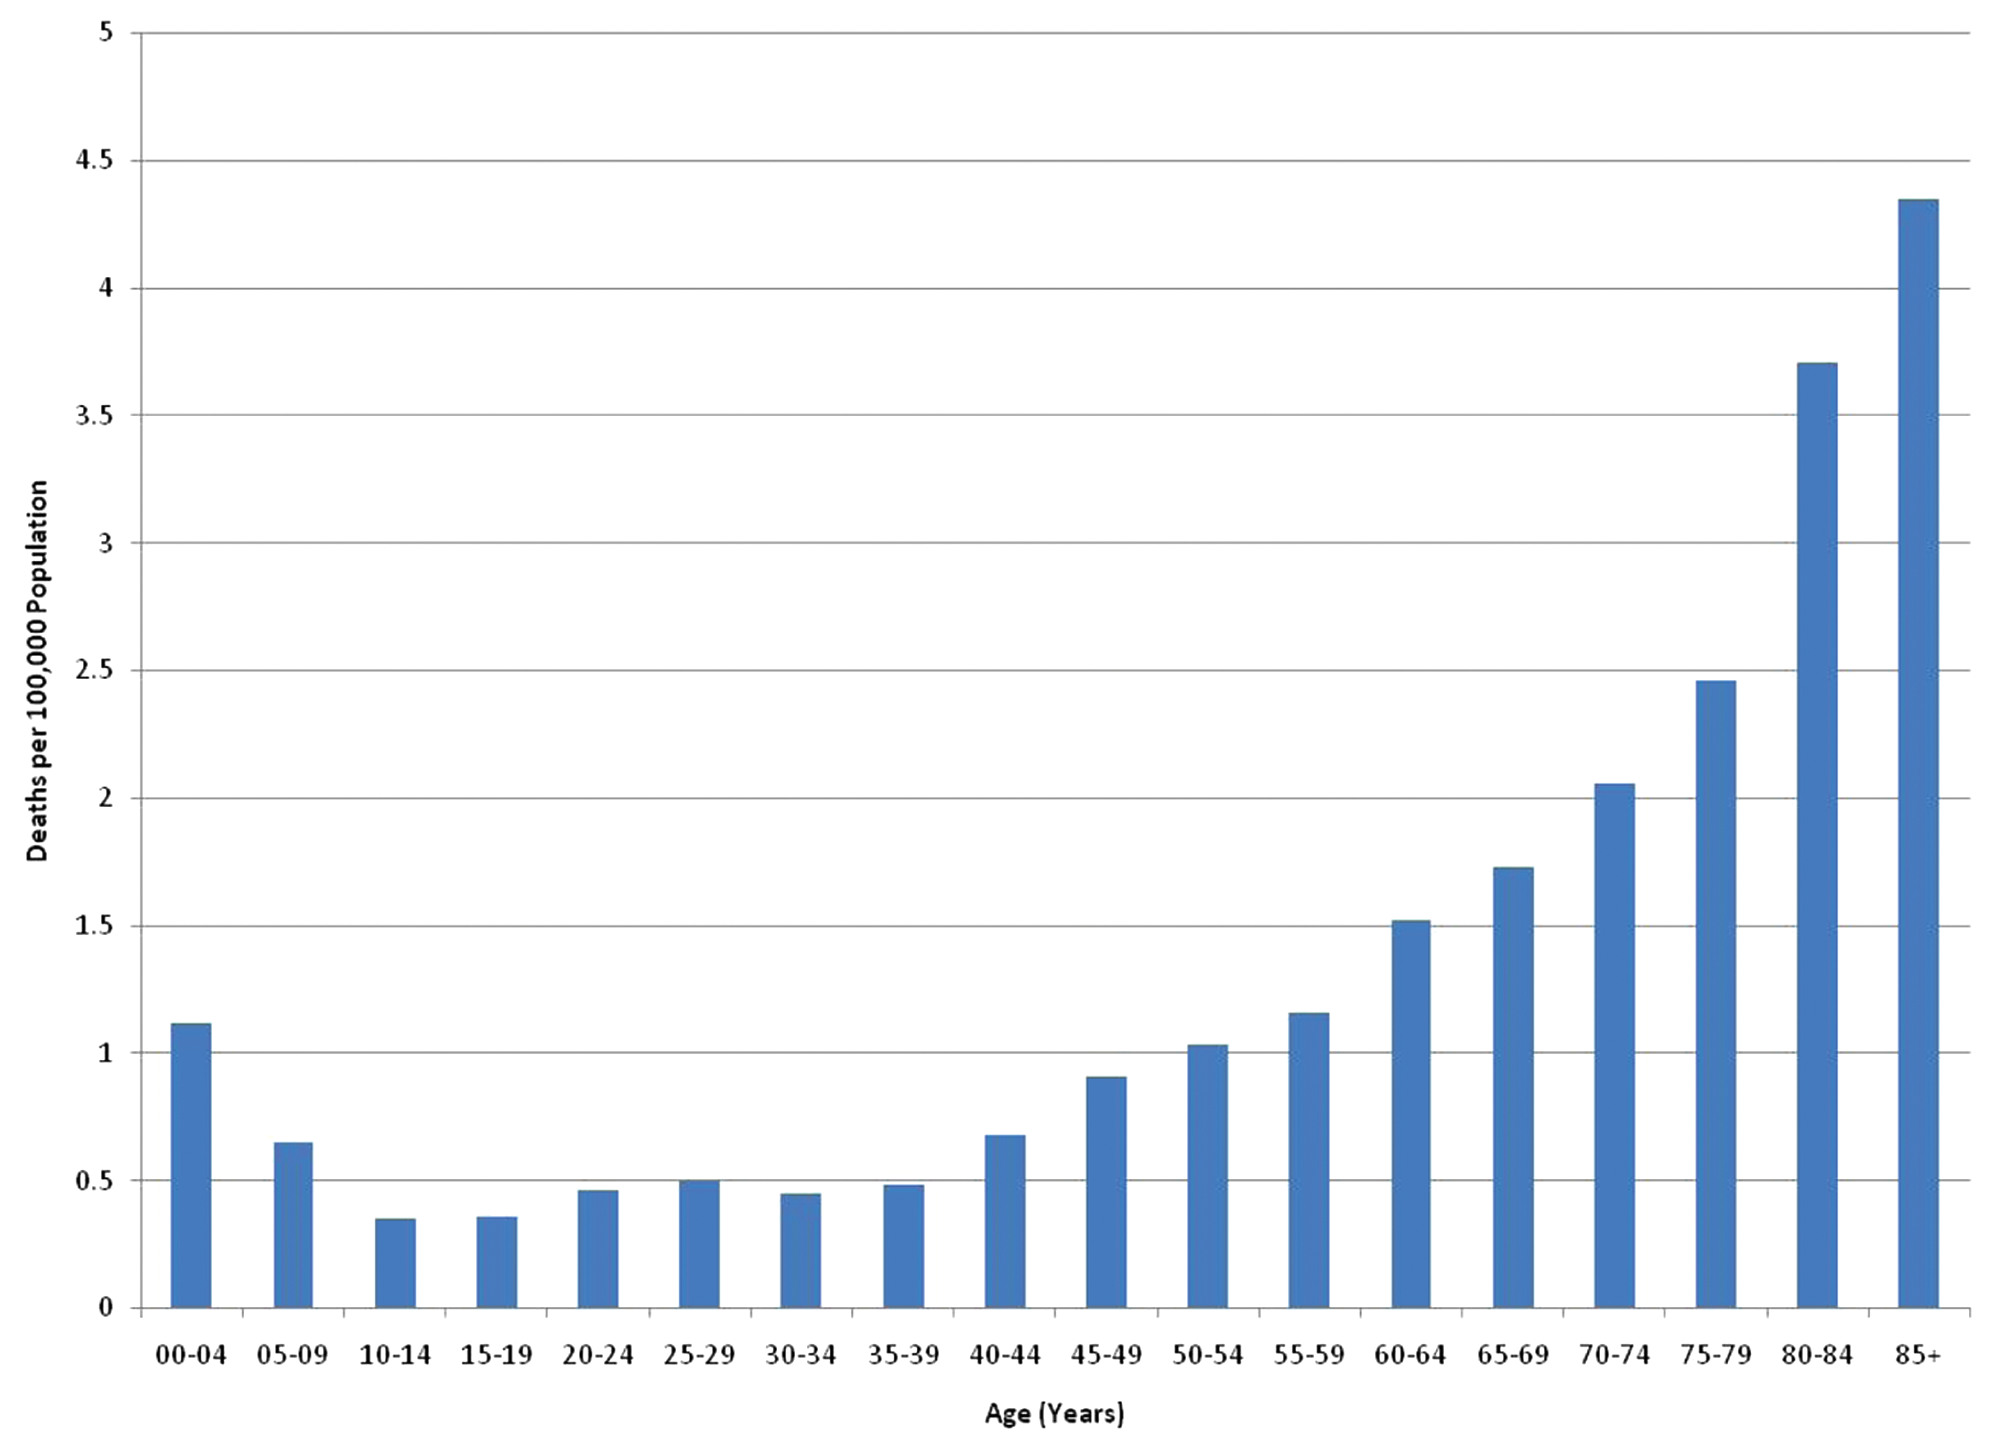
Home Fire Death Rates by Age, United States, 2007.
Age-adjusted home fire death rates in 2007 for males (1.13 per 100 000 population) were almost 50% higher compared with females (0.76), and males have higher rates at every age group. 8 The higher rates may be explained by the fact that men are more willing to take risks and are more likely to try to extinguish a fire. 27
Individuals With Disabilities
Sensory disabilities can make it difficult for an individual to perceive risks during fire situations whereas physical disabilities can make it difficult or impossible to escape independently. For example, people with impaired tactile sensation may be at increased risk for fire and burn injuries because of their diminished ability to perceived heat. Physical disability was a contributing factor in 13% of home fire deaths. 28
About 8 million adults report difficulty seeing. 29 Individuals who are blind or visually impaired are at higher risk for injury because they may not see warning indicators or notice a potentially dangerous situation such as something flammable too close to a stove burner or heater; challenges in recognizing the early, visible signs of a fire (their first indication usually will be the smell of smoke and sense of heat); and reduced capacity to escape a fire.30,31
Approximately 8 million Americans report difficulty hearing. 29 For individuals who are deaf or hard of hearing, conventional smoke alarms are of limited use. A 2007 Fire Protection Research Foundation study of the waking effectiveness of different types of alarm signals found that a loud, low-frequency, auditory signal was most effective in waking people with moderate to severe hearing loss. This signal performed better than bed or pillow shakers and strobe lights and the higher pitched signal found in most smoke alarms currently in use. Strobe lights by themselves were not effective in waking this population. 32 The National Fire Protection Association (NFPA) recommends smoke alarms with lower pitched signals for people with mild to severe hearing impairments. People with profound hearing loss need tactile notification, such as bed shakers, as well as visual signals such as strobe lights (NFPA 72 National Fire Alarm and Signaling Code, Section 29.3.8).
More than 28 million people report having difficulty walking or using stairs; more than 3 million use a wheelchair; and another 10 million use canes, crutches, or walkers. 29 Individuals with mobility impairments also have a diminished ability to respond to a fire. If clothing or flammable materials near a disabled person catch fire, traditional safety strategies such as “Stop, Drop, and Roll” may not be a viable option. A fire-retardant blanket, kept close by, can be used to smother flames. 33 People with mobility impairments may also have difficulty evacuating the residence without some assistance. Often the door is the only realistic exit, and escape through a window may not be possible.31,34
People with mental disabilities may not recognize danger or be able to learn new procedures and follow directions. 33 Among US community residents, 12% of those 65 years or older had some type of mental disability compared with 5% among those aged 5 to 64 years. 35
Alcohol or Other Drug Use
Numerous studies have indicated high rates of alcohol use among victims of home fires. Two studies indicated that more than 50% of adult decedents were either were intoxicated 36 or tested positive for alcohol at the time of death. 37 Another study determined that individuals older than 14 years with excessive alcohol consumption behaviors (ie, >5 drinks per occasion) were found to have 8 times the risk of fire injury compared with nondrinkers. 37 Almost half (45%) of the 2003-2006 home fire deaths with alcohol or drugs cited as possible contributing factors resulted from fires started by smoking materials. 38 This is nearly twice the 25% share of overall home fire deaths started by smoking materials. 39
Rural Communities
The smallest communities in the United States have the highest population-based rates of overall fires and fire deaths. In 2004-2008, rural communities had an overall fire death rate twice as high as the nation as a whole. 40 There are several characteristics of rural communities that put them at higher risk. Rural households are less likely to report having working smoke alarms. 41 Nearly all rural fire departments (99.5%) are all or mostly volunteer, which often means insufficient staffing, equipment, and training, as well as fewer community-level fire prevention programs. 42 Emergency response times are also longer in rural areas because of longer travel distances; and those who are critically injured in rural fires may not have access to a level I or level II trauma center within an hour. 43
Home fire risk also varies by region of the United States. The Southeast region contains nearly half of the total US rural population and has historically had the highest fire death rates (see Figure 3). 8 Whereas the average home fire death and injury rate was highest in the Midwest during 2004-2008, Southern communities with a populations less than 2500 people had an overall fire death rate at least twice that of any other region or community size grouping, including comparably sized communities in other regions. For cities with a population of 250 000 or more, the highest overall fire death rate was in the Midwest. 40
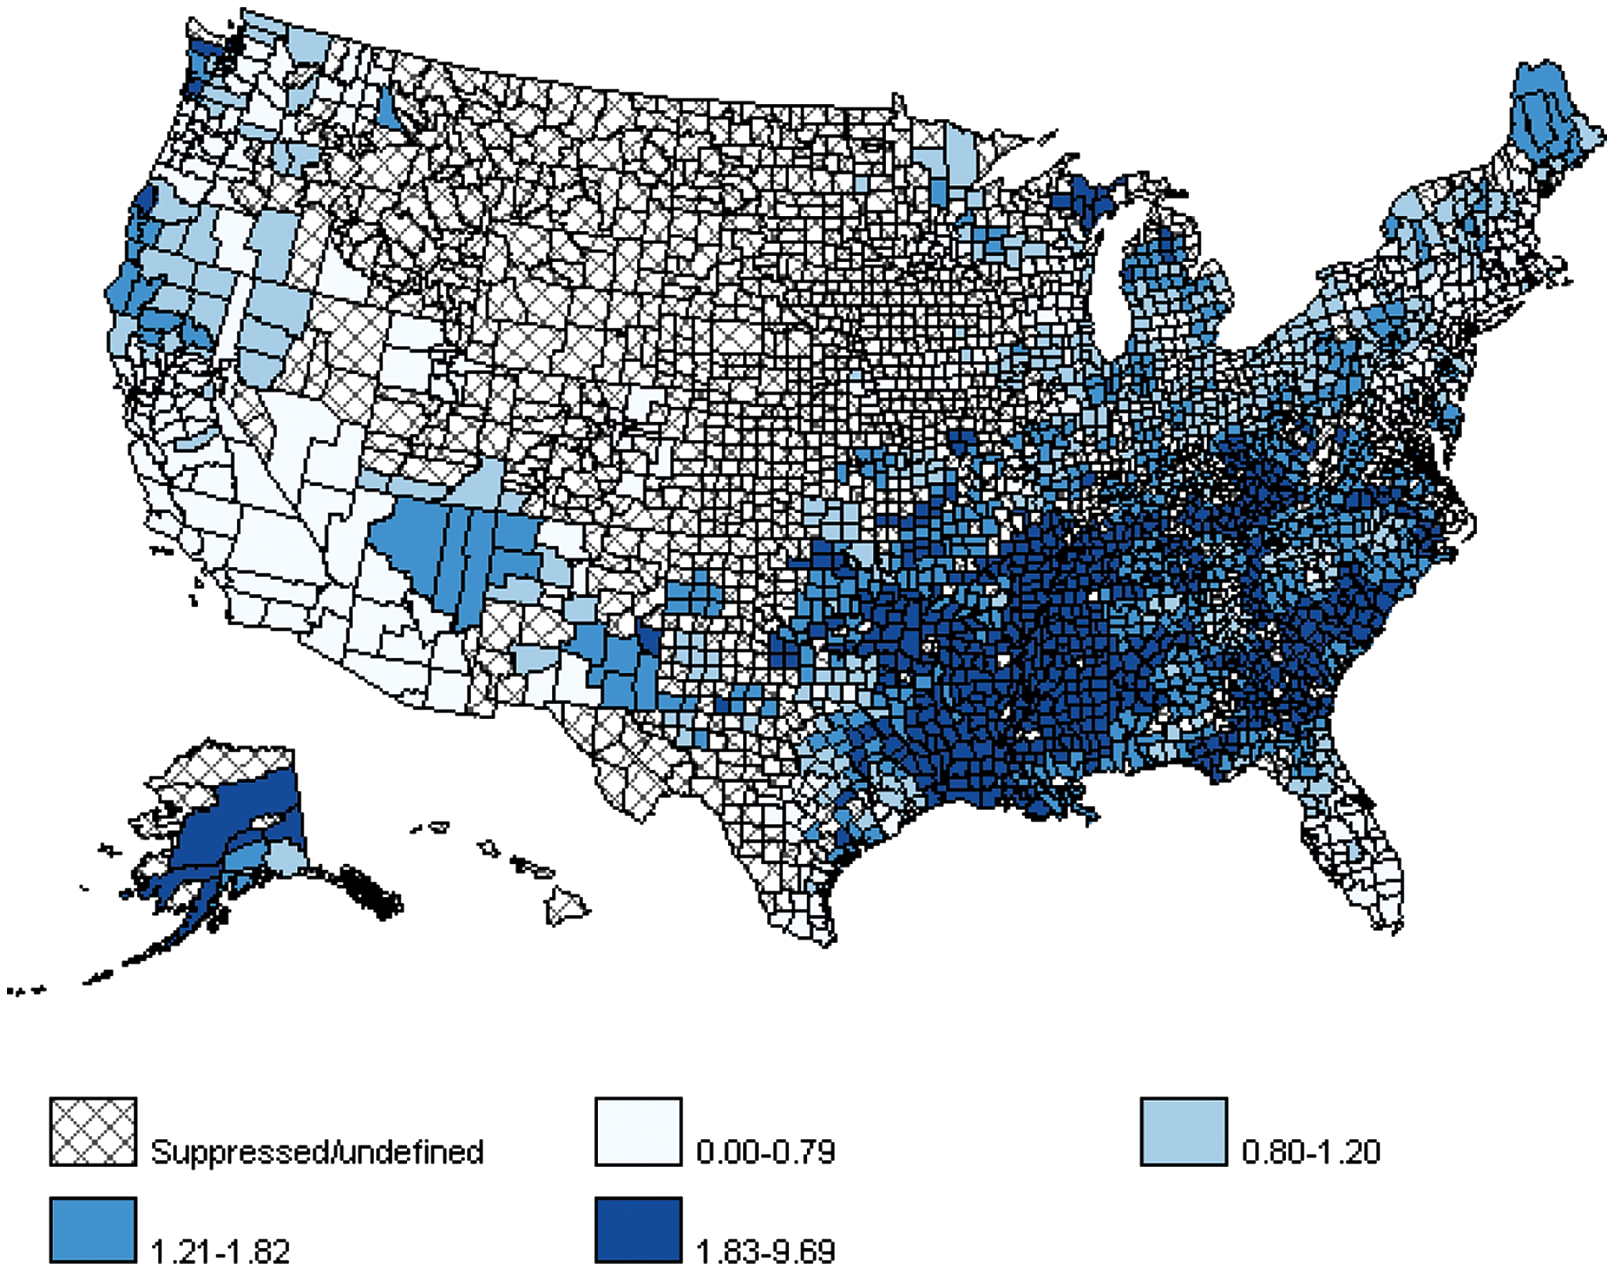
Age-Adjusted Home Fire Death Rates, United States, 2000-2006
Poverty
Families that live in poverty are at higher risk for having a home fire and from being injured by one.44,45 Six of the 10 states with the highest population-based fire death rates were also in the top 10 states in terms of residents with incomes below the poverty line. 21 When money is scarce, fire safety measures that involve financial costs such as installing smoke alarms, replacing batteries, or maintenance of heating equipment may be deferred. Similarly, repairs may not be made, or if made, they may be done by unqualified individuals because of lower costs. People who are poor are more likely to be smokers 46 and to have less education. 47 People who are poor may focus on meeting other needs besides safety that limit their time, energy, and access to resources, especially when constrained by factors such as multiple jobs or inadequate transportation. People living in poverty may also lack the resources to take advantage of newer and safer consumer products (eg, fire-resistant mattresses or furniture, smoke alarms, residential sprinklers). To reduce energy costs, poor households may use space heaters, which are associated with higher fire risk. This is a particular issue in milder climates. A 2008 survey of 12 states with a Low Income Home Energy Association Program (LIHEAP) found that one third of recipients used a kitchen stove or oven to provide heat in at least one month in the past year because of a lack of funds for the energy bill. 48 Although the age of a home and crowding or density are not good predictors of fire risk, 21 makeshift accommodations, such as adding basement or attic bedrooms without second exits, increase fire risks.
Both poverty and race are related to higher fire death rates. However, the combined effect of these risk factors on fire death rates may be greater than would be expected if the effect of the two risk factors were merely summed. Specifically, one study indicated that the combination of low income and a high proportion of African Americans was related to fire death rates in a multiplicative rather than additive way. 49 This suggests that although poverty (regardless of race) may be a proxy for multiple, and geographically concentrated, factors associated with higher fire risk (such as lack of resources, lack of knowledge and skills, and lack of adequate supervision), fire risk may be also independently related to both poverty and race.
Fire Prevention and Protection Strategies
The causes and risk factors for home fire injuries and deaths help to inform decisions about appropriate prevention strategies and potential target audiences. Fire prevention strategies aim to prevent the fire from occurring in the first place, typically by making materials harder to ignite, modifying heat sources so they are less likely to ignite something, or changing the behavior or the environment so that the heat source is prevented from combining with a fuel to start a fire.
Fire protection strategies apply after ignition occurs and play an important role in reducing injuries and deaths. For example, smoke alarms provide early warning of a developing fire and additional escape time. Home escape planning and fire drills help ensure that if a fire occurs, everyone present will know how to get out quickly and safely. Home fire sprinklers can control or extinguish a fire. And, the practice of compartmentation—which includes closed doors and windows—can prevent a fire from spreading.
Below is a summary of the home-related fire prevention and protection strategies.
Smoke Alarms
Smoke alarms are effective, reliable, and inexpensive devices that provide early warning during residential fires. Working smoke alarms cut the risk of dying in reported home fires in half. 50 In 2003-2006, 63% of reported home fire deaths resulted from fires in homes with no smoke alarms or no working smoke alarms. Although more than 94% of US households report having at least one smoke alarm.41,51,52 about one quarter of US households lack working smoke alarms. 53 Households least likely to have an alarm include residents at a higher risk of being injured in a fire: 54 this includes the poor, older adults, heavy drinkers, households with less than high school education, properties in disrepair, and households in rural areas and in the southern United States.55,56
Most home smoke alarms use ionization or photoelectric sensor technology, alone or in combination, to detect a fire. Ionization smoke alarms activate when smoke reduces the flow of current between charged electrodes, whereas photoelectric alarms activate when smoke reflects light beams. Photoelectric alarms respond faster to smoldering fires; ionization alarms respond faster to flaming fires. Both technologies are effective in most fire scenarios; using both offers the best protection. Ionization alarms are less expensive than photoelectric alarms, which contributes to ionization alarms being the most widely used.
Smoke alarms can be stand alone units (battery powered) or hardwired into the home’s electrical system. In the United States, most smoke alarms are battery powered. Hardwired systems are much more common in newer construction, apartments, and manufactured homes, reflecting the fire and building codes that were in place when properties were built.
Current recommendations for smoke alarm placement and number are based on sleeping location and home design: there should be one alarm on each level of the home and one inside and outside of each sleeping area. Smoke alarms should be interconnected so that if one sounds, they all sound. Whereas the majority of interconnected smoke alarms are hardwired, wireless technology can interconnect single-station battery-powered smoke alarms. 33
In certain circumstances, occupants may not respond to smoke alarm signals. Sleep-deprived adults, children, and people under the influence of alcohol, marijuana, or sleep-inducing medication are less likely to wake to a smoke alarm. 57 The higher frequency hearing loss that often accompanies aging also reduces the probability that older adults will wake to a smoke alarm. 57 The home layout and smoke alarm locations can influence whether the warning will be heard. Interconnected smoke alarms sound in response to a fire anywhere in the home. Even if a child does not wake, if the parent wakes to the alarm, the parent can in most cases get the child to safety. 58
Even when homes have smoke alarms, these alarms may not be working. In reported home fires considered large enough to activate a smoke alarm, the leading reasons the alarms did not sound were missing or disconnected batteries (53%), dead batteries (22%), unclassified (8%), and power failure, power shut off, or disconnected from the home’s electricity (8%). 50 Some people do not recognize the chirping that warns of a low smoke alarm battery. Disabling of alarms occurs frequently in response to nuisance alarms, largely related to cooking, and sometimes due to steam. Nuisance alarms can be prevented by installing smoke alarms at least 20 feet away from the kitchen range. Any smoke alarm between 10 and 20 feet away from the stove should have a hush feature, which temporarily reduces the sensitivity of the alarm, or they should use a photoelectric sensor. Smoke alarms should be at least 3 feet away from the bathroom so that steam will not activate them.
Extended-life, lithium batteries have been promoted in recent years to address the issue of battery replacement. These batteries are typically advertised as lasting 10 years, which coincides with recommendations to replace the entire smoke alarm unit regardless of batter type or power source. In a randomized controlled trial examining which type of battery-powered smoke alarm is most likely to remain functional in inner city housing, alarms with lithium batteries were significantly more likely to be functional at follow-up. 59 The Centers for Disease Control and Prevention conducted a long-term follow-up study of its Smoke Alarm Installation and Fire Safety Education (SAIFE) program, which installs lithium-powered “10-year” smoke alarms in homes at high risk for home fires and injuries. At follow-up, 8 to 10 years after installation, only a third of alarms were still functional. In total, 37% of the alarms were missing and 30% were present but not functioning. However, among present smoke alarms that still used their original lithium batteries 78% were still functioning. 60
Alarms should be installed, maintained, and tested according to the manufacturer’s instructions. Batteries that are not lithium should be replaced annually,50,61 and the entire smoke unit should be replaced every 10 years. Although smoke alarms provide early warning of a fire, they do not stop the danger posed by a still-growing fire. Therefore, it is important for occupants to develop and practice an escape plan.
Home Fire Sprinklers
Home fire sprinkler systems are designed to operate automatically to control or extinguish fires, giving the occupant(s) time to escape. Sprinkler systems have been available for more than 100 years, but residential systems were not practical until 1978 when technical advancements made them 5 times faster in response to fires. 62 Sprinklers can now react as quickly as 35 seconds. During 2003-2007, sprinklers were present in only 5% of reported home fires. Wet pipe sprinklers have sprinkler heads directly attached to pipes containing water. These are the most common and most reliable type of fire sprinkler. The death rate per 1000 reported home fires was 83% lower in homes with wet pipe sprinklers than in homes with no automatic extinguishing system at all. There is a myth that when one sprinkler is activated, they all operate, but actually only sprinklers in the immediate vicinity of the fire actually discharge water. In 97% of home fires with operating wet pipe sprinklers, only 1 or 2 sprinklers were activated. 63
One of the major arguments offered against the installation of sprinkler systems has been the cost, but recent studies have found costs are much lower than opponents have claimed and can be made lower still by innovative methods. A study of the cost of adding sprinklers to 30 different houses in 9 US cities and 1 Canadian city found that the average cost to the home builder was $1.61 per sprinklered square foot. 64 Higher costs were associated with greater use of copper piping, lack of a municipal water supply, higher permit fees, and local requirements for sprinklers in additional areas such as garages and attics. Costs tended to be lower in communities in which sprinkler ordinances had been in place for at least 5 years. A number of demonstration projects have been conducted to reduce installation costs, simplify installation, and investigate infrastructure and code alternatives and incentives for installation of these systems.
Fire-Safe Cigarettes
“Fire-safe” cigarettes are designed to be less likely to ignite household materials such as furniture and mattresses and to self-extinguish when they are not being smoked. Legislative efforts to develop fire-safe cigarettes began in the 1920s as a method to prevent forest fires. 65 In 1979, the American Burn Association endorsed the first national campaign for fire-safe cigarettes. Although the technical study group established by the 1984 Cigarette Safety Act (PL98-567) found that it was technically feasible to produce a cigarette with low propensity for ignition of other items, efforts to establish national requirements were unsuccessful. Canada was the first country to adopt requirements for fire-safe cigarettes; these requirements took effect in 2005. In the United States, the efforts turned to state legislatures. New York was the first state to pass this legislation, which took effect in June 2004. The New York Office of Fire Prevention reported an average of 41 deaths per year from fires started by smoking materials in 2001-2003. In 2005-2007, the average fell down to 27 per year, a 33% drop. All 50 states have now passed legislation requiring fire safe cigarettes and as of March 2011, the requirements were effective in 49 states (plus the District of Columbia) 66 The fire-safe cigarettes law for Wyoming’s will be effective July 1, 2011.
Child-Resistant Lighters
In 1994, CPSC introduced a safety standard for cigarette lighters that requires disposable or novelty lighters to have a child-resistant mechanism that makes them difficult for children younger than 5 years to operate. Lighter manufacturers are required to test their products using panels of children between 42 and 51 months of age, and 85% of these children must not be able to operate them within a defined time limit. 65 The same study demonstrated a 58% reduction in lighter fires started by children younger than 5 years after the introduction of the CPSC standard. Estimates suggest that the child-resistant standard prevented 3300 fires, 100 deaths, 660 injuries, and $52.5 million in property losses in 1998. 67
Arc Fault Circuit Interrupters
Every time a switch is flipped an arc of electricity crosses a circuit. Arc faults occur when the electricity crosses through loose connections or damaged wires. These arc faults can cause sparks and high temperatures that sometimes result in fire. In fact, most electrical failures that result in fire are arc faults. Conventional circuit breakers operate in response to overloads or short circuits, not the erratic current flow associated with unintentional arcing. Arc fault circuit interrupters (AFCIs) detect these arcs and disconnect electrical power before a fire starts. The 2008 edition of the National Electrical Code requires the installation of AFCIs with most circuits in new or renovated homes. 68 These AFCIs should only be installed by qualified electricians. 69
Automatic Shutoffs
Some appliances have automatic shutoffs to prevent fires. For example, portable electric heaters may have automatic shutoffs that will turn the appliance off if it tips over, and coffee makers and irons often have timers that will shut the equipment off after a period of time if it is not in active use.
The Role of the Medical Practitioner in Fire Prevention
Medical practitioners have the opportunity to influence their patients’ lifestyle decisions and behaviors related to home fires. Medical practitioners often have a limited amount of time with patients. However, during that time they can identify patients’ home fire risk factors, educate accordingly, and link patients to community resources.
There are a few things to consider when educating patients about home fire safety. 70 At a minimum, a patient’s highest risk factors should be identified and 2 to 3 simple education messages should be discussed. Use materials and messages tailored for each at-risk population. For example, older adults need targeted information tailored to their capabilities (eg, limited mobility) and needs (eg, larger font sizes on educational materials). In addition, children and parents may need specific education on safety regarding matches or lighters that other populations do not need. Capitalize on family interactions to promote safety messages. Parents can be an excellent source of safety messages for preschool-aged children if properly informed. Teach parents how to talk to their preschool-aged children about identifying potential dangers, such as hot items, or when to tell a grown up about a danger or to ask for help. Conversely, children should be encouraged to discuss safety topics with their parents. For example, elementary school-aged children can remind parents to test smoke alarms or to practice a fire escape plan. With cooking-related burns so common among children younger than 5 years old, parents need to know that burns should be treated with cool water for 3 to 5 minutes. If the burn is larger than the person’s palm, or on the face, hands, feet, or genitals, or if they have any concerns, they should get medical help right away.
Individuals should notify CPSC of any unsafe products (https://www.cpsc.gov/cgibin/incident.aspx). The CPSC also has a special form for health care professionals (https://www.cpsc.gov/cgibin/hcpinc.aspx) to report patient injuries associated with consumer products. For authorities to take action against such products, they need accurate information.
Below are educational messages for 8 home fire prevention topics. For simplicity, 3 main messages are highlighted for each topic. Readers should refer to fire prevention resources (eg, National Fire Protection Association [NFPA], Centers for Disease Control and Prevention [CDC], United States Fire Administration [USFA], Home Safety Council Web sites] for additional messages and strategies. It is important to note that risk factors vary by region, population, and household. Therefore, risk assessments should be performed to identify appropriate risk factors and associated educational messages.
NFPA’s Public Education Division has established the Educational Messages Advisory Committee to evaluate proposals to modify NFPA’s current fire safety messages. Committee members include representatives from the fire service, USFA, CDC, Red Cross, Electrical Safety Foundation International, burn nurses, technical experts, and NFPA staff. A complete list of messages is available at http://www.nfpa.org/.
Smoke Alarms:
Install smoke alarms in every bedroom, outside each separate sleeping area, and on every level of the home, including the basement. Test your smoke alarms monthly by pushing the test button. Replace alkaline batteries in all smoke alarms at least once per year.
Fire Escape Planning:
Make and practice an escape plan with everyone in your household. Choose an outside meeting place (eg, neighbor’s house, a mailbox, a stop sign) a safe distance in front of your home where everyone can meet after escaping. Once you’re out of the home, remember “Get out and stay out!” Never go back into a burning home.
Smoking Safety:
If you smoke, smoke outside. Never smoke in bed or if you are sleepy from alcohol or taking medication. Use large, deep, sturdy ashtrays, and place them on a flat surface.
Cooking Safety:
Stay in the kitchen when you are frying, grilling, or broiling. If you leave the kitchen for even a short period of time, turn off the stove. Keep anything that can catch fire away from your stovetop. Wear short, close-fitting, or tightly rolled sleeves when cooking. Loose clothing can dangle onto stove burners and catch fire.
Heating Safety:
Keep anything that can burn at least 3 feet away from heating equipment, such as the furnace, fireplace, wood stove, or portable heater. Maintain heating equipment and chimneys by having them cleaned and inspected annually by a qualified professional. Turn portable heaters off when leaving the room or when going to bed. Consider buying portable heaters that turn off if they tip over.
Electrical Safety:
Avoid running extension cords across doorways or under carpets. Replace or repair cracked, damaged or loose cords on all electrical devices. Do not overload your electrical outlets.
Children and Fire Safety:
Store all matches and lighters away from children. Use only child-resistant lighters. Remember, child-resistant does not mean childproof. Make sure children know to tell an adult if they see matches or lighters.
Candle Safety:
Blow out all candles when leaving the room or going to bed. Keep candles a minimum of 12 inches away from anything that can burn. Do not use candles during power outages. Make sure you have a sufficient supply of flashlights and batteries.
Another important approach for medical practitioners is to learn about fire prevention resources in their patients’ communities and to provide appropriate referrals. For example, many fire departments provide and install smoke alarms to community members for free on request. Fire departments can often assist or provide counseling referrals for parents who have concerns about children playing with fire. Partnering with local organizations and agencies is another way to spread resources and provide patients with additional exposure to fire prevention efforts.
Conclusions
There is no single way to ensure a fire-safe home environment. However, individuals can reduce the likelihood of experiencing a home fire and its consequences by understanding home fire causes and risk factors and by making the appropriate lifestyle changes outlined in this review. Health care practitioners often recommend lifestyle changes to reduce the risk or severity of illness. Expanding the recommendations to include fire safety can help protect their patients from the disruption and potential injury or death caused by fire.
Footnotes
The findings and conclusions in this report are those of the authors and do not necessarily represent the official position of the Centers for Disease Control and Prevention, or the National Fire Protection Association.
*
The term home includes 1- and 2-family homes and apartments or other multifamily homes, but excludes hotels, dormitories, residential boardand care or assisted living