
Abstract
Objective
This study investigates the association between blood cobalt levels and osteoporosis prevalence in the general U.S. population, addressing critical gaps in understanding low-to-moderate environmental exposure effects.
Methods
We analyzed 2901 adults from NHANES 2017-2020. Blood cobalt concentrations were categorized into quartiles. Multivariable logistic regression, restricted cubic splines (RCS), and Boruta algorithm were employed to assess dose-response relationships, nonlinear associations, and demographic effect modifications, adjusting for sociodemographic, metabolic, and clinical covariates.
Results
Participants in the highest cobalt quartile showed 32% increased osteoporosis prevalence vs Q1 (OR = 1.32, 95% CI:1.06-1.86). RCS analysis revealed a nonlinear relationship with an inflection point at 0.12 μg/L. Significant effect modifications emerged across multiple strata: females exhibited 91% greater risk elevation than males (OR = 1.91 vs 1.24, p-interaction = 0.022), Non-Hispanic Black participants demonstrated 36-fold higher odds (OR = 36.54, 95% CI:7.17-186.28), and participants with 9-11 years education showed elevated risk (OR = 21.72, 95% CI:1.27-372.63, p-interaction = 0.009). Married individuals exhibited higher risk (OR = 2.08, 95% CI:1.14-3.82) compared to never-married counterparts, though marital status interaction was nonsignificant (P = 0.721).
Conclusions
Environmental cobalt levels below current safety thresholds may associate with elevated osteoporosis prevalence, particularly in females and Non-Hispanic Black populations. The nonlinear dose-response relationship (inflection point 0.12 μg/L) suggests threshold effects, advocating for revised biomonitoring standards and targeted screening in vulnerable subgroups.

Introduction
Osteoporosis is a major global health issue, characterized by reduced bone mass and microarchitectural deterioration, leading to increased fracture risk and significant morbidity and mortality. While traditional risk factors such as aging, hormonal changes, and nutritional deficiencies are well-established, the role of environmental exposures, particularly heavy metals, in bone health has garnered increasing attention. Among these, cobalt, a trace element with both essential and toxicological properties, has emerged as a potential contributor to bone metabolism dysregulation.1,2
Cobalt is an essential component of vitamin B12, but excessive exposure—primarily through industrial activities, dietary contamination, and medical implants—has been linked to adverse health effects, including oxidative stress and endocrine disruption.3,4 Experimental studies suggest that cobalt may impair bone remodeling by disrupting the balance between osteoblast and osteoclast activity, potentially through oxidative stress and inflammatory pathways.5,6 Previous European biomonitoring efforts have established reference percentiles for blood cobalt in general populations, typically ranging from 0.05 to 0.15 μg/L at the 75th percentile, providing a benchmark for evaluating potential health associations in diverse cohorts.7,8 However, population-based evidence on the relationship between cobalt levels and osteoporosis remains limited, particularly at low-to-moderate exposure levels relevant to the general population.
The National Health and Nutrition Examination Survey (NHANES) provides a unique platform to investigate this association, offering nationally representative data on blood cobalt concentrations and self-reported osteoporosis status. Previous studies utilizing NHANES data have identified associations between other heavy metals, such as lead and cadmium, and bone health.9-11 However, the potential impact of blood cobalt levels on osteoporosis prevalence has not been systematically explored.
This study aims to address this gap by examining the association between blood cobalt levels and osteoporosis prevalence in a representative U.S. population. Specifically, we sought to: 1. Quantify the relationship between blood cobalt concentrations and osteoporosis prevalence, 2. Explore potential nonlinear dose-response relationships using restricted cubic spline (RCS) analysis, and 3. Investigate effect modification by demographic and clinical factors, including sex-specific differences.
By leveraging advanced statistical methods, including RCS modeling and the Boruta algorithm for feature selection, this study provides novel insights into the role of cobalt levels in osteoporosis prevalence. These findings have important implications for cobalt, particularly in identifying vulnerable subpopulations and informing preventive strategies.
Methods
Study Design and Participants
Data were obtained from the National Health and Nutrition Examination Survey (NHANES), a nationally representative survey designed to assess the health and nutritional status of adults and children in the United States. NHANES employs a stratified, multistage, probability sampling methodology to ensure representativeness of the U.S. population. Approximately 5000 participants are surveyed annually, with data collected through detailed interviews, physical examinations, and laboratory tests. The survey includes information on sociodemographic characteristics, dietary habits, and health conditions.
For this study, we performed a cross-sectional analysis using NHANES data from 2017 to 2020. Participants were selected from an initial pool of 15560 individuals based on predefined inclusion and exclusion criteria. First, we excluded participants with missing data on key variables, such as cobalt levels, osteoporosis diagnosis, etc., or those with responses marked as “Don’t know” or “Refused.” Second, individuals with incomplete data on covariates, such as poverty-to-income ratio, BMI, etc., were excluded. After applying these criteria, a total of 2,901participants were included in the final analysis (Figure 1). Flow chart of sample selection from NHANES 2017-2020
The reporting of this study conforms to the Strengthening the Reporting of Observational Studies in Epidemiology (STROBE) guidelines. 12 This secondary analysis did not require additional ethical approval or informed consent, as it utilized publicly available, de-identified NHANES data.
Assessment of the Cobalt
The data source for cobalt measurements was derived from laboratory data in the NHANES called “P_CRCO.Doc” for cobalt data. Cobalt concentrations were measured using inductively coupled plasma mass spectrometry (ICP-MS), a highly sensitive and precise method for detecting trace elements in biological samples. All cobalt measurements were expressed in micrograms per liter (μg/L).
Based on previous studies and the distribution of cobalt levels in the study population, participants were divided into quartiles according to their cobalt concentrations: Quartile 1 (reference group), Quartile 2, Quartile 3, and Quartile 4. This categorization allowed for the evaluation of dose-response relationships between cobalt levels and osteoporosis prevalence.
Assessment of the Osteoporosis
Self-reported osteoporosis status was obtained from the NHANES questionnaire data file named “P_OSQ.Doc,” which includes the question, “Has a doctor ever told you that you had osteoporosis, sometimes called thin or brittle bones?” Participants who answered “yes” were classified as having a history of osteoporosis.
The collected data represent the lifetime prevalence of osteoporosis rather than the incidence of new cases during the study period. Participants with missing data or incomplete responses to the osteoporosis-related questionnaire were excluded from the analysis.
Covariates
Covariates were systematically selected based on established osteoporosis prevalence factors and NHANES data availability. The variables were categorized into 3 domains: Sociodemographic Factors: Age (continuous variable in years), Sex (Male/Female, self-reported), Race/Ethnicity (Mexican American, Non-Hispanic Black, Non-Hispanic White, Other Hispanic, Other Race), Education Level (<9th grade, 9-11th grade, High school graduate, Some college, College graduate), Marital Status (Married, Divorced, Never married), and Poverty-Income Ratio (PIR, a continuous measure of socioeconomic status). Anthropometric/Biochemical Markers: Body Mass Index (BMI, calculated as weight in kilograms divided by height in meters squared), Waist Circumference (continuous measurement in cm), Iron (serum iron levels in μg/dL), Total Calcium (serum calcium concentrations in mg/dL), Total Cholesterol (serum cholesterol levels in mg/dL), and Selenium (whole blood selenium levels in μg/L). Comorbidities: Hypertension (self-reported diagnosis or measured blood pressure ≥140/90 mmHg) and Diabetes (self-reported diagnosis or HbA1c ≥ 6.5%).
Statistical Analysis
All statistical analyses were conducted using R software (version 4.2.2; R Foundation for Statistical Computing, Vienna, Austria). NHANES sample weights were applied to account for the complex survey design and ensure population-level representativeness. Continuous variables were expressed as means ± standard deviations or medians (interquartile ranges), depending on their distribution, and categorical variables were presented as frequencies (percentages). Differences between groups were assessed using the chi-squared test for categorical variables and the Wilcoxon rank-sum test for continuous variables.
The Boruta algorithm (500 iterations) was employed for feature selection, retaining variables with Z-scores exceeding shadow feature maxima. To evaluate the association between cobalt levels and osteoporosis, multivariable logistic regression models were constructed. Three models were developed to control for potential confounders: Model 1 was unadjusted, Model 2 adjusted for sociodemographic factors (age, sex, race/ethnicity, education level, marital status, and poverty-income ratio), and Model 3 further adjusted for anthropometric, biochemical, and clinical variables (BMI, waist circumference, serum iron, total cholesterol, selenium, hypertension, and diabetes). Cobalt levels was analyzed both as a continuous variable and as quartiles, with the lowest quartile serving as the reference group.
Restricted cubic splines (RCS) was used to explore potential nonlinear relationships between cobalt levels and osteoporosis prevalence. Subgroup analyses were performed to investigate potential effect modifications by sex, race/ethnicity, education level, and comorbidities. Interaction terms were included in the models and tested using Wald tests to assess the statistical significance of these interactions.
Results
Sample Characteristics of the Participants
Baseline Characteristics of Participants

Notes Median±SE for continuous variables and % for categorical variables. BMI, body mass index; PIR, poverty income ratio; P < 0.05 was considered statistically significant.
Association Between Cobalt and Osteoporosis
The Association Between Cobalt Exposure Quartiles and Osteoporosis Risk, Estimated Using Multivariate Logistic Regression Models

Notes Model1: No adjustment for covariates was made. Model 2: Partially adjustment was made for gender, age, race, education level and marital status. Model 3: Fully adjustment was made for gender, age, race, education level, marital status, family PIR, BMI, waist circumference, iron, total calcium, total cholesterol, selenium, hypertension, diabetes. OR, Odds Ratio. P < 0.05 was considered statistically significant.
RCS Analysis
Restricted cubic spline (RCS) analysis revealed a nonlinear relationship between cobalt levels and osteoporosis prevalence (Figure 2). The fitted regression line indicated an inflection point at 0.12 μg/L, beyond which the risk of osteoporosis increased sharply. The odds ratio (OR) exceeded 1 at cobalt levels above the inflection point, suggesting a threshold effect. The 95% confidence interval (CI) was narrow at lower cobalt levels but widened at higher levels, reflecting greater uncertainty in the risk estimates at extreme exposures. The association between cobalt and osteoporosis. RCS shows a non-linear relationship between cobalt and osteoporosis. The fitted regression line is a solid yellow line; the black solid line indicates the position where the OR is equal to 1; the cobalt value marked by the pink vertical line represents an inflection point at 0.12; the shaded area indicates the 95% CI
Subgroup Analyses
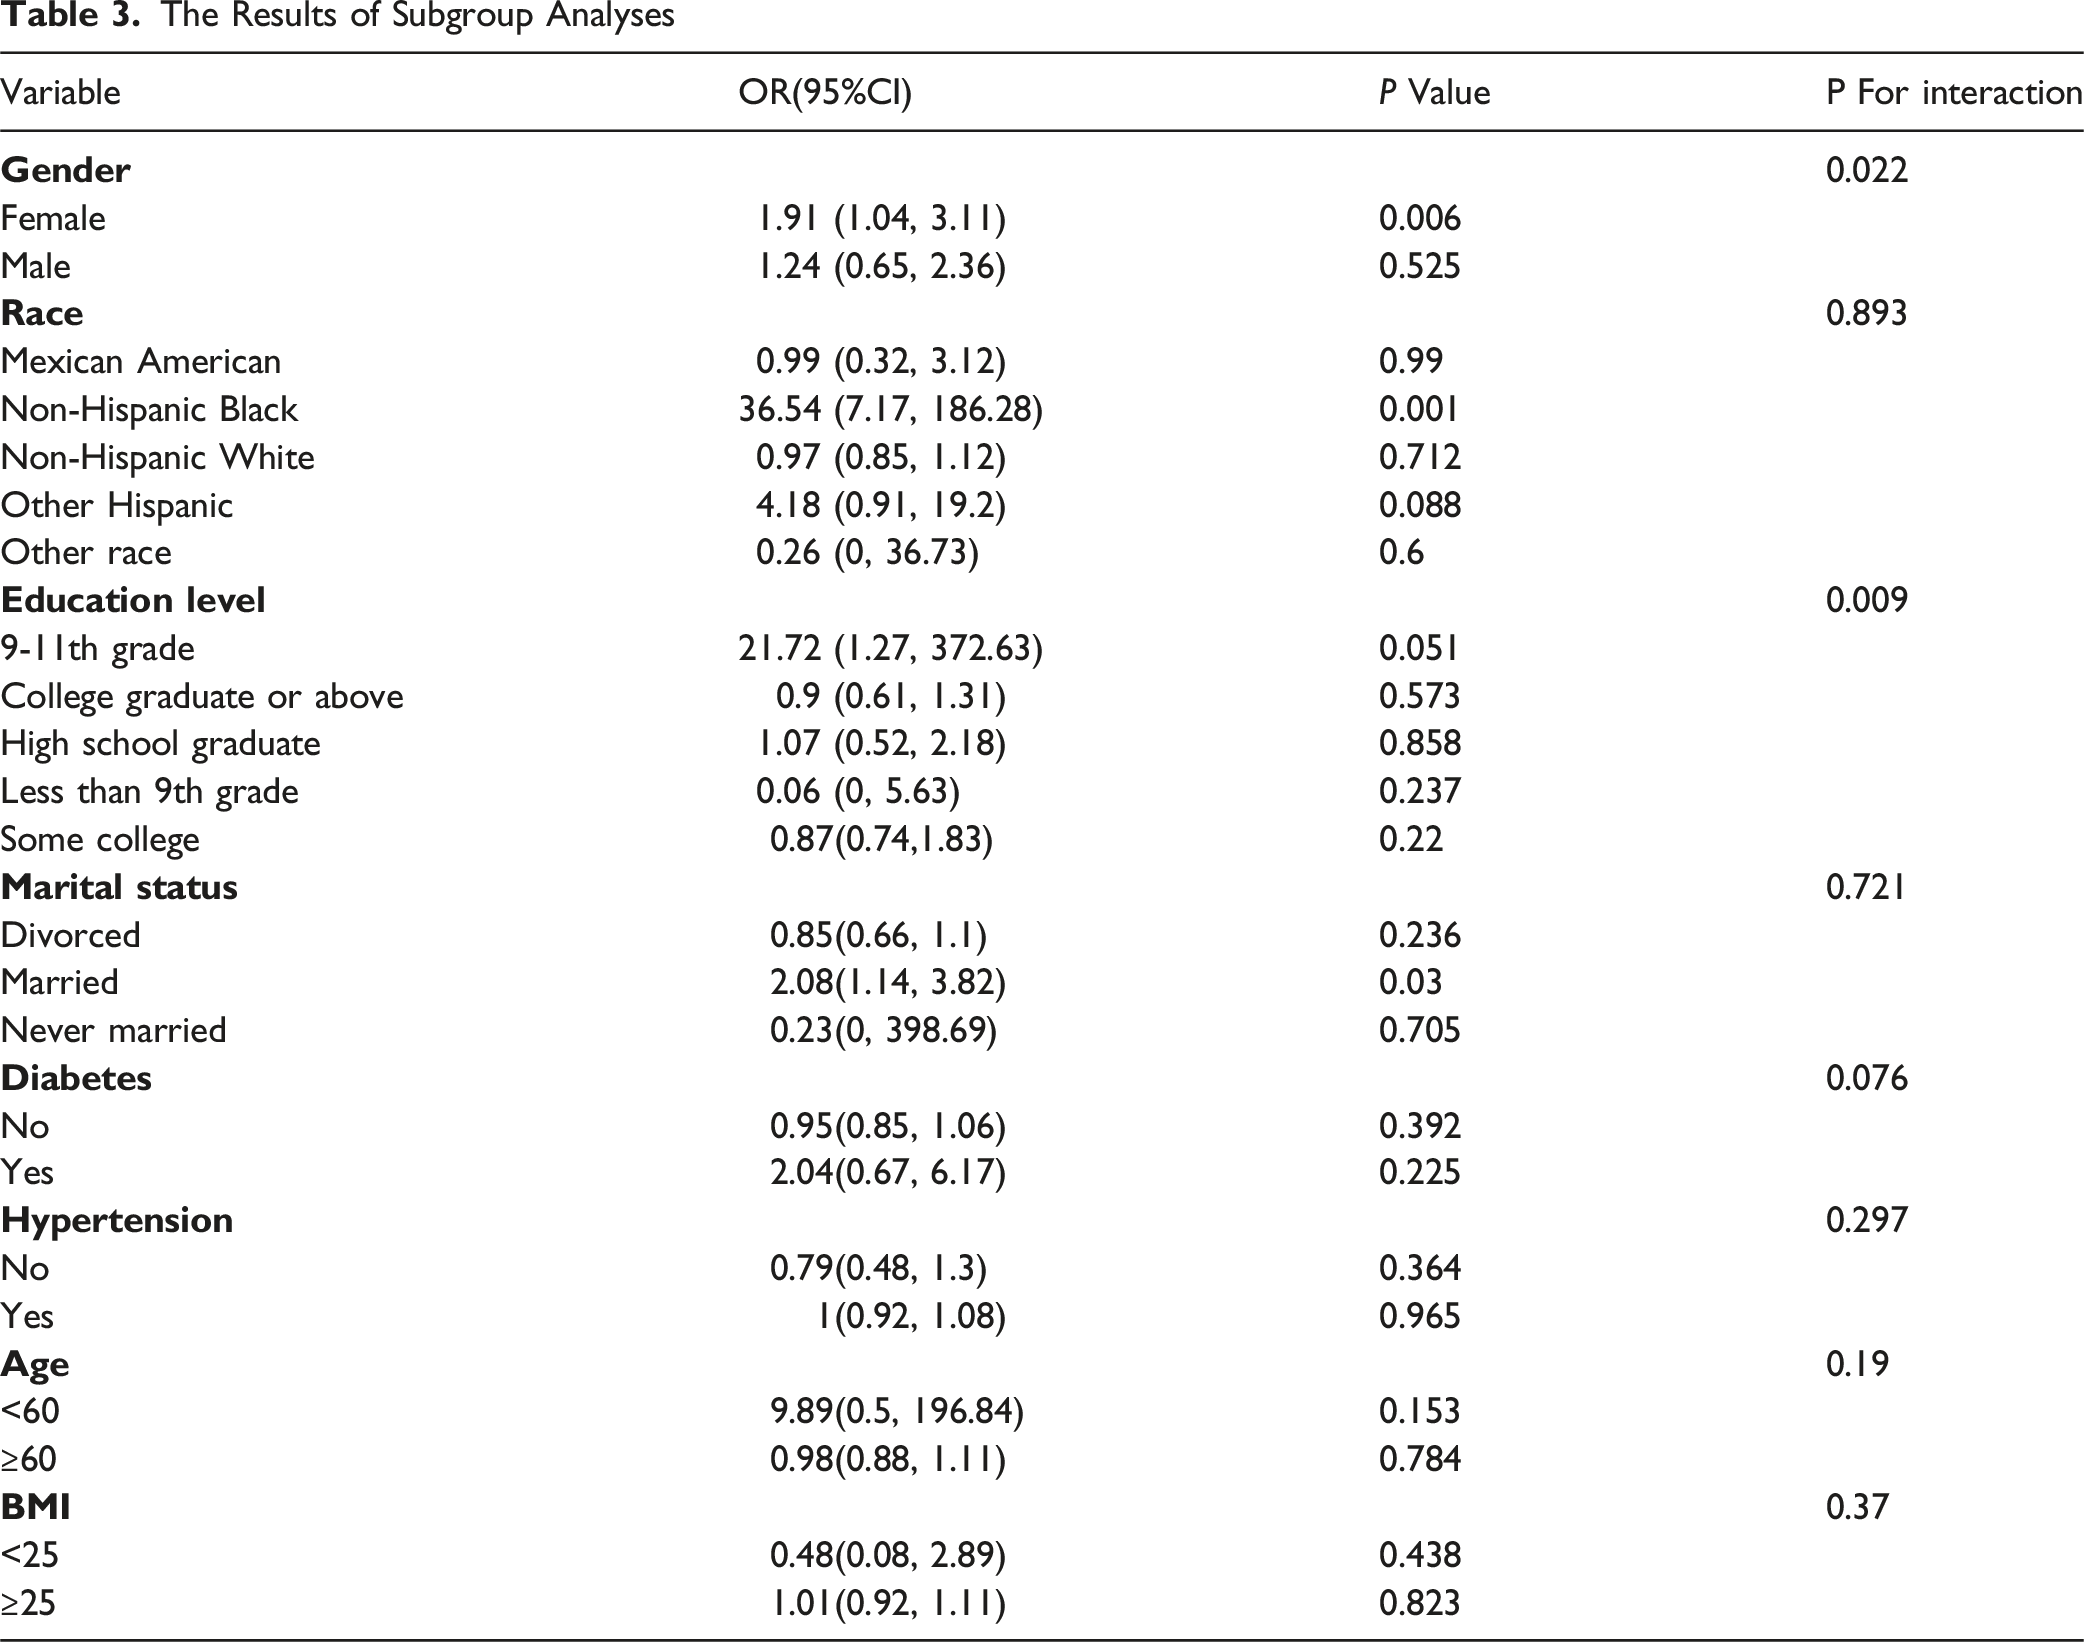
The Results of Subgroup Analyses
Boruta Algorithm
The feature selection results based on the Boruta algorithm are shown in Figure 3. After 500 iterations, we identified 10 variables most closely related to osteoporosis. These variables, ranked by their Z-scores, were gender, age, waist circumference, BMI, total cholesterol, hypertension, race, diabetes, marital status, and iron. Predictor importance for osteoporosis according to the Boruta algorithm. A predictor was deemed important if its mean importance Z-score was significantly higher than the maximum value of the shadow variables. Conversely, a predictor was excluded if its mean importance Z-score was significantly lower than the maximum value of the shadow variables. BMI, body mass index; PIR, poverty income ratio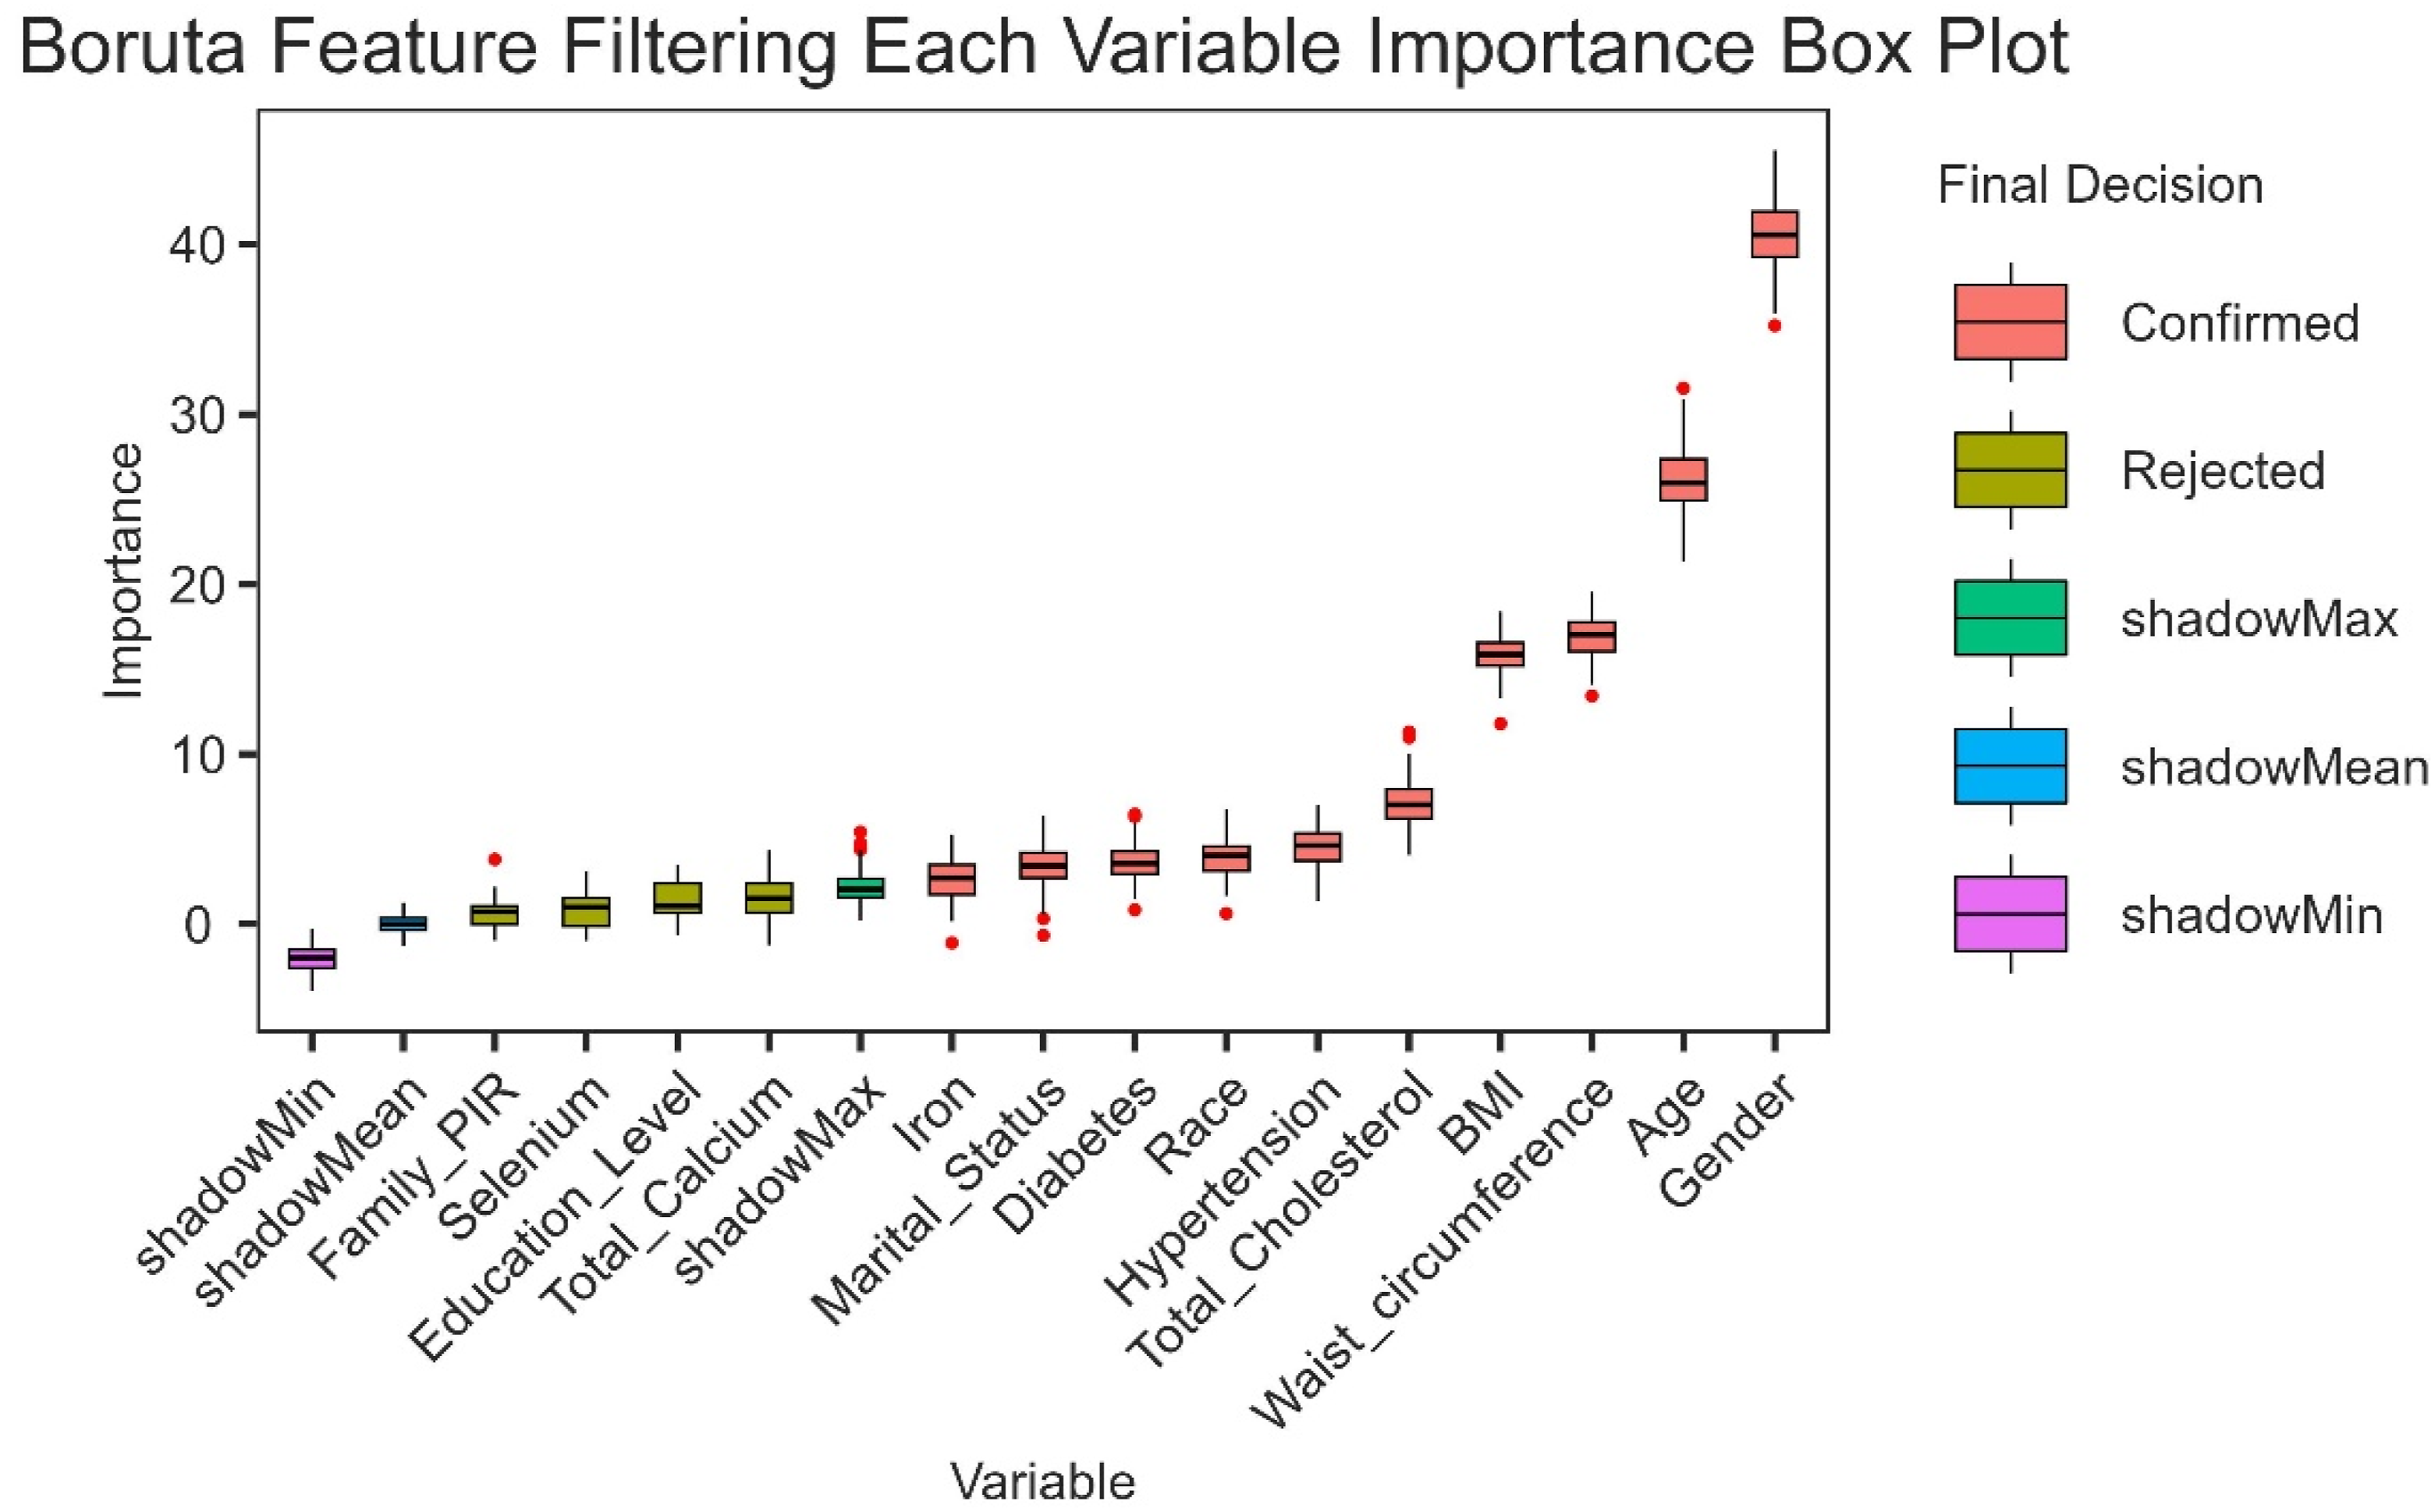
Although total calcium, education level, selenium and PIR,were omitted due to their lower Z-scores compared with those of the strongest related or shadow features, they were still included in subsequent analyses based on prior research and clinical relevance. This highlights the robustness of cobalt as a key determinant of osteoporosis prevalence while acknowledging the potential contributions of other factors.
Sex-Specific RCS Analysis
Figure 4 illustrates the restricted cubic spline (RCS) curves for the association between cobalt levels and osteoporosis prevalence, stratified by sex. Both males and females exhibited a nonlinear association, with an inflection point at approximately 0.12 μg/L. However, the dose-response relationship differed between sexes: Restricted cubic spline curve illustrating the association between cobalt levels and osteoporosis prevalence stratified by sex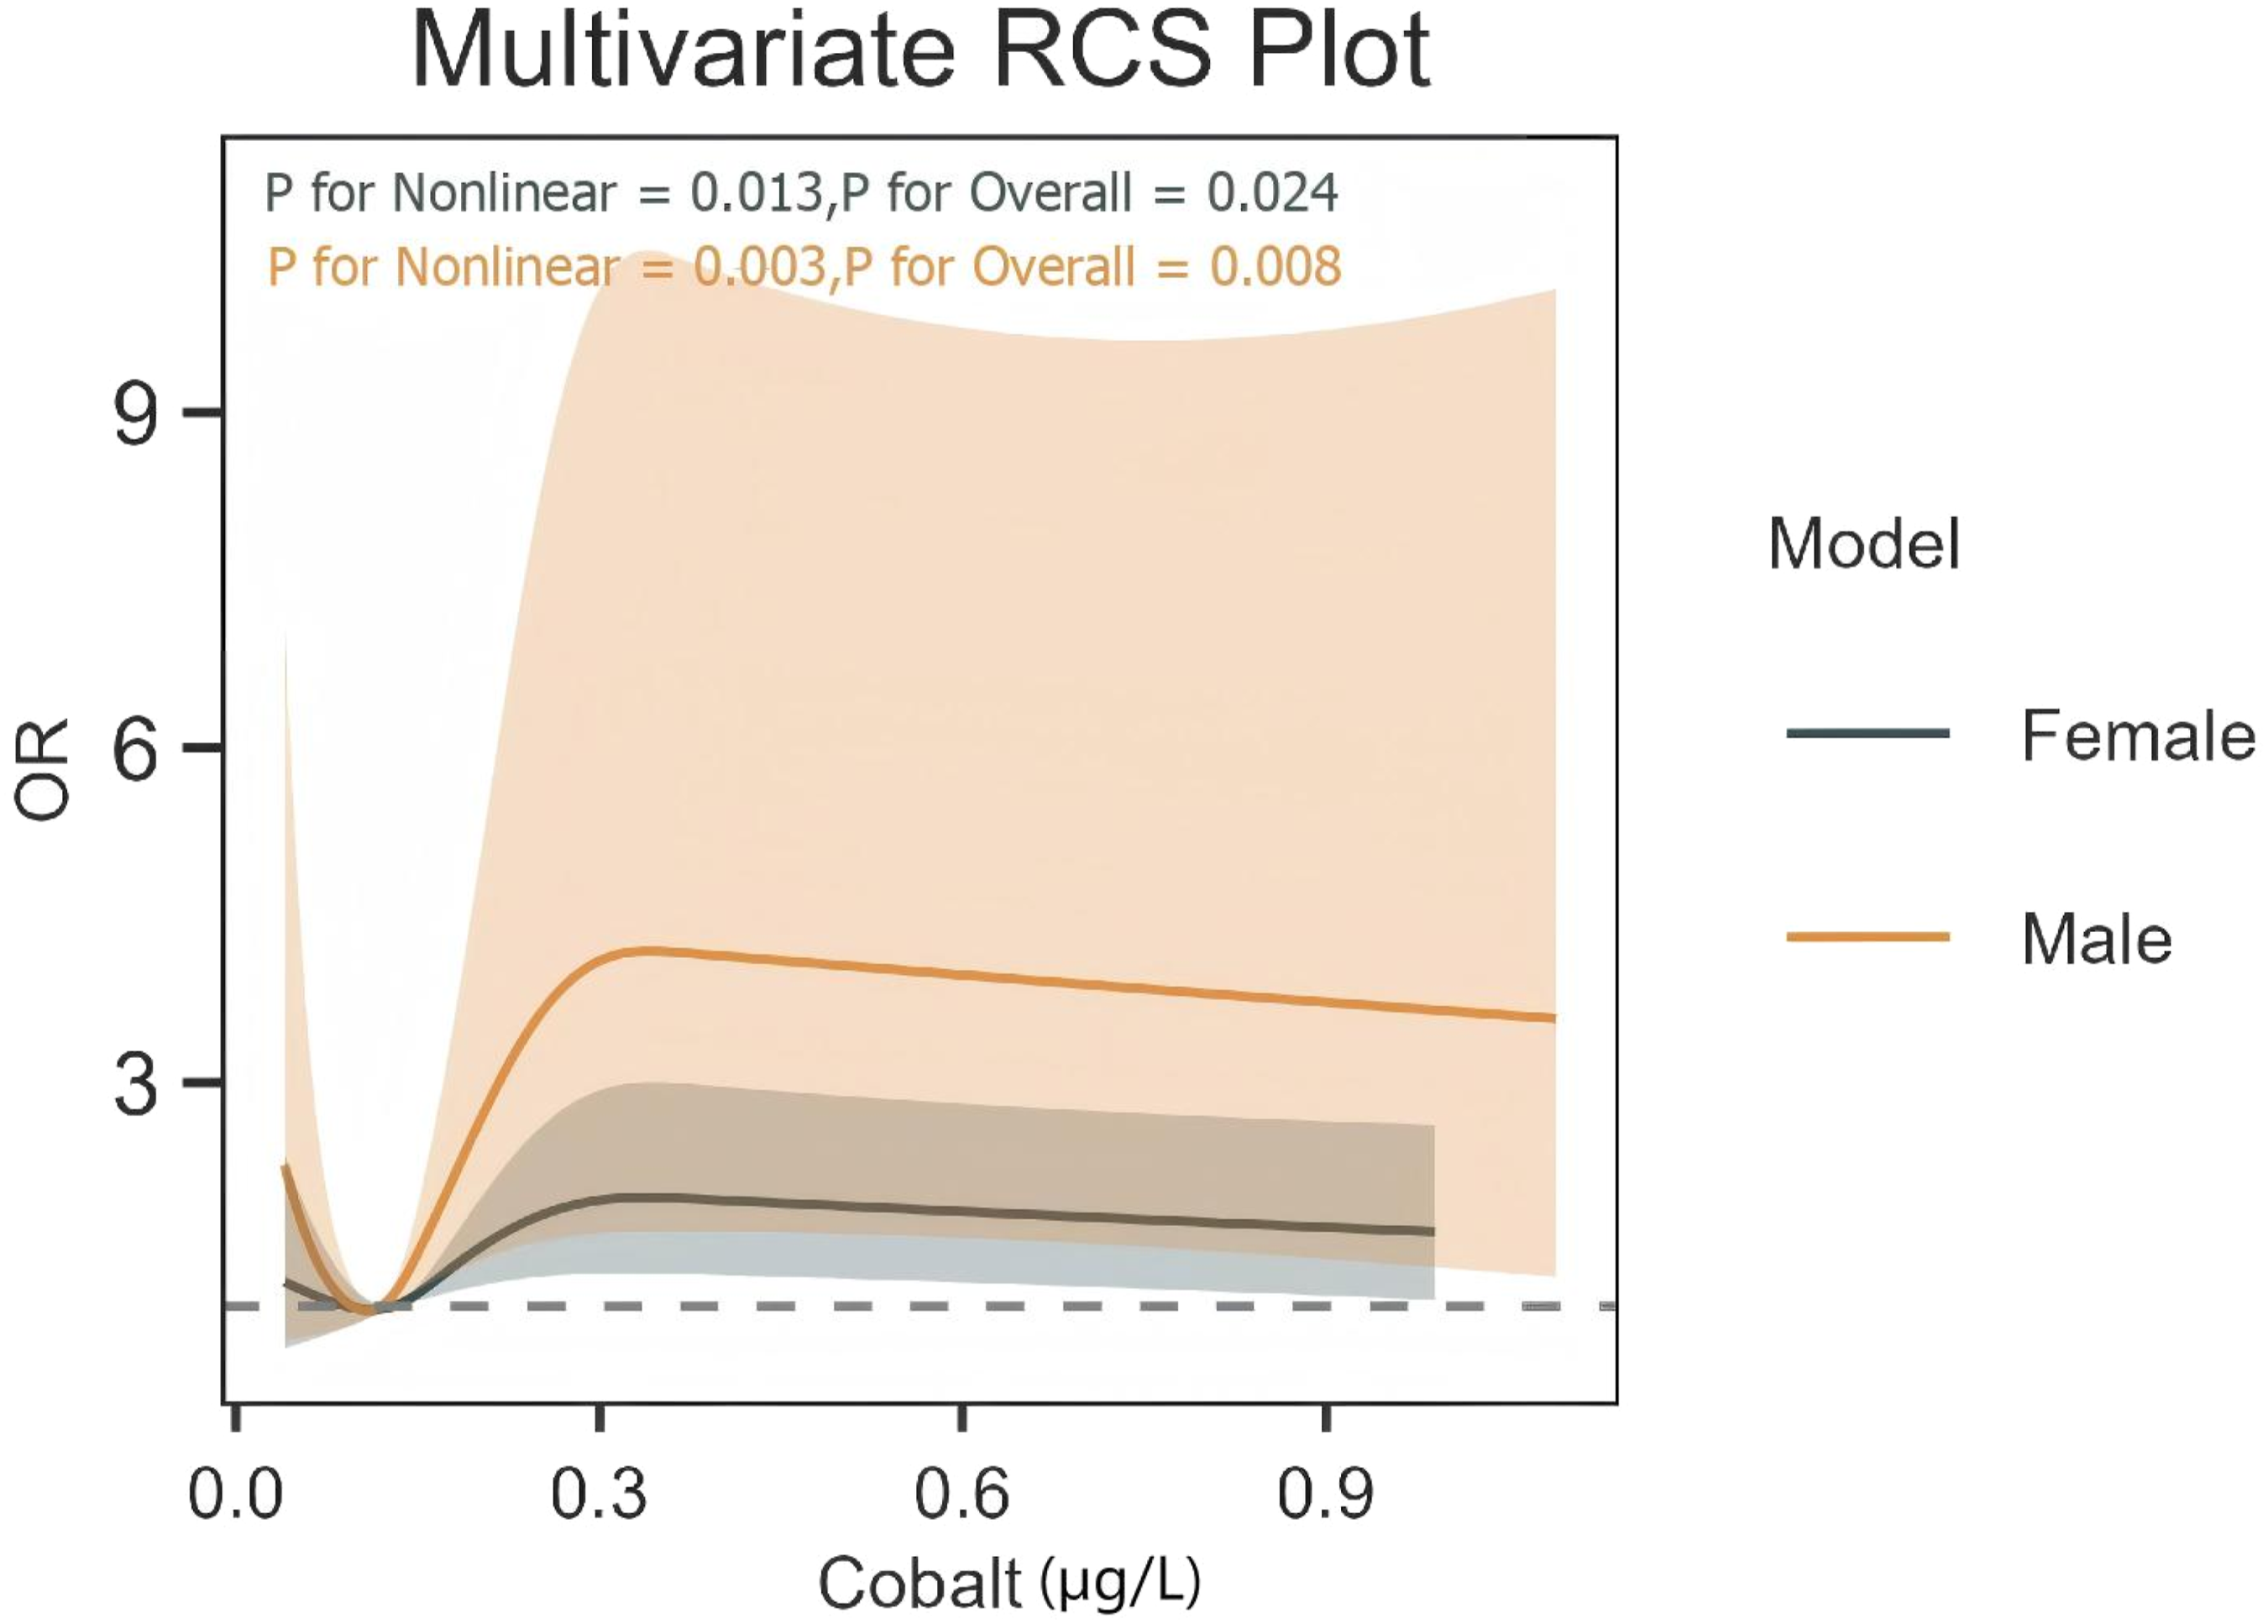
The curve for males demonstrated a steeper increase in osteoporosis prevalence at higher cobalt levels, suggesting a more pronounced dose-response relationship. The confidence intervals (CIs) were wider for males, indicating greater variability in the risk estimates.
The curve for females showed a more gradual increase in risk, with narrower CIs compared to males. This suggests a more stable and consistent association between cobalt levels and osteoporosis prevalence in females.
The P-value for nonlinearity was 0.003 for males and 0.013 for females, indicating that the nonlinear relationship was statistically significant in both groups. However, the interaction analysis (Table 3) showed a significant difference in the cobalt-osteoporosis association between sexes (P for interaction = 0.022), highlighting the importance of sex-specific analysis.
Discussion
Our study reveals 3 principal findings regarding blood cobalt levels and osteoporosis prevalence in the general U.S. population. First, we identified a significant dose-response relationship, with participants in the highest cobalt quartile (0.19-29.03 μg/L) exhibiting 32% increased osteoporosis prevalence compared to the lowest quartile after full adjustment. Second, restricted cubic spline analysis demonstrated a nonlinear association with an inflection point at 0.12 μg/L, suggesting potential threshold effects below regulatory safety limits. Third, significant effect modification emerged across demographic strata, particularly showing 91% greater risk elevation in females vs males and 36-fold higher odds among Non-Hispanic Black participants.
These findings extend previous occupational studies documenting cobalt’s skeletal toxicity at extreme exposures (>50 μg/L) by demonstrating measurable risks at environmental exposure levels (median 0.14 μg/L).13,14 The observed nonlinear relationship aligns with experimental evidence of hormetic effects, where low-dose cobalt may stimulate osteoblast activity through hypoxia-inducible factor activation, while higher concentrations induce oxidative DNA damage in bone marrow stromal cells.15,16 Our inflection point (0.12 μg/L) corresponds closely to the 75th percentile in recent European biomonitoring studies, highlighting potential underestimation of population risks in current safety frameworks.7,8
The pronounced gender disparity (female OR = 1.91 vs male OR = 1.24) may reflect endocrine-disrupting properties of cobalt. Experimental models show cobalt mimics estrogenic activity by binding estrogen receptor-α, potentially accelerating postmenopausal bone loss through receptor-mediated pathways.17,18 This mechanism could synergize with age-related hormonal changes, explaining the stronger association in older females (mean age 67.8 years).19,20 The striking risk elevation in Non-Hispanic Black participants (OR = 36.54) warrants further investigation—potential contributors include genetic polymorphisms in cobalt metabolism (eg, CTR1 transporter variants), socioeconomic disparities in cumulative exposure, or unmeasured dietary factors influencing cobalt bioavailability. While our RCS analyses revealed a nonlinear cobalt-osteoporosis relationship and significant interactions by gender, age, and education, these findings should be interpreted cautiously due to potential exposure misclassification. For instance, occupational cobalt exposures, which may dominate in certain demographics, could exhibit different dependencies compared to ambient or dietary sources. This undifferentiated exposure assessment in NHANES data may confound the observed nonlinear patterns and interactions, warranting future studies with source-specific exposure metrics.
Methodologically, our application of Boruta algorithm addressed critical collinearity challenges in metal mixture studies, confirming cobalt’s independent association despite strong correlations between trace elements.21,22 The retained covariates—particularly waist circumference and selenium—suggest adipose tissue may modulate cobalt’s skeletal toxicity through sequestration/release mechanisms, while selenium’s antioxidant capacity could partially mitigate oxidative damage.23,24
This study has several limitations that warrant consideration. First, the cross-sectional design precludes causal inference regarding the temporal relationship between cobalt levels and bone loss. Second, reliance on self-reported osteoporosis may introduce biases related to education, language barriers, or healthcare access, potentially contributing to the observed subgroup differences in odds ratios. While NHANES validation studies demonstrate 89% concordance between self-reported osteoporosis and clinical diagnoses, residual misclassification bias may persist due to undiagnosed cases or recall inaccuracies. We did not cross-verify with objective femoral neck bone mineral density (BMD) data (T-score ≤ −2.5) due to dataset constraints in this analysis. Future research should incorporate BMD measurements for validation in subpopulations with both outcomes to enhance outcome accuracy and confirm our findings.Third, unmeasured confounders such as physical activity levels, dietary calcium intake, and genetic predisposition could partially explain the observed associations. Finally, single-timepoint blood cobalt measurements may not fully capture chronic exposure patterns, potentially introducing exposure misclassification given cobalt’s relatively short biological half-life (40-60 hours) in systemic circulation. In addition to the inherent constraints of our cross-sectional NHANES design, our findings may be influenced by selection biases such as the healthy worker effect and survival bias. Specifically, the observed elevated osteoporosis risk at lower cobalt exposures could reflect scenarios where highly exposed individuals experience early health effects leading to job termination or attrition, leaving a healthier subgroup in the dataset. Without longitudinal data on occupational histories or exposure trajectories, we cannot fully disentangle these biases. Future prospective cohort studies are needed to mitigate such effects and provide clearer causal insights. As a secondary analysis of the NHANES dataset, a prospective sample size or power calculation was not performed. While the large sample (N = 2901) provided adequate power for our primary analyses, this could limit generalizability or the detection of subtler subgroup effects. Future studies with targeted recruitment and a priori power analyses are recommended to validate these findings.
Conclusion
This nationally representative study provides novel evidence that environmental cobalt levels, even at levels below current safety thresholds, associates with increased osteoporosis prevalence in a nonlinear, sex-specific manner. The identification of 0.12 μg/L as a potential risk threshold and marked disparities in vulnerable subgroups underscores the need for revised biomonitoring standards and targeted screening strategies. Future longitudinal studies incorporating bone turnover markers and genomic data could elucidate mechanisms while informing personalized prevention approaches in high-risk populations.
Supplemental Material
Supplemental material - The Association Between Cobalt and Osteoporosis: A Cross-Sectional Study Utilizing NHANES Data
Supplemental material for The Association Between Cobalt and Osteoporosis: A Cross-Sectional Study Utilizing NHANES Data by He Liu, Yilong Hu, Jianming Liu in Dose-Response.
Footnotes
Acknowledgements
We confirm that no third-party services were involved in preparing or submitting this manuscript. All work, including writing, data analysis, and revisions, was conducted by the listed authors and our research team.
Ethical Considerations
The NCHS Research Ethics Review Board approved the study protocol, with written informed consent obtained from all participants prior to data collection.
Consent to Participate
Author contributions
He Liu drafted the manuscript and performed the literature review. Jianmin Liu and Yilong Hu collected and analysed the data. All the authors read and approved the final version of the manuscript.
Funding
The authors received no financial support for the research, authorship, and/or publication of this article.
Declaration of Conflicting Interests
The authors declared no potential conflicts of interest with respect to the research, authorship, and/or publication of this article.
Data Availability Statement
The datasets used or analyzed during the current study are available from the corresponding author on reasonable request.
Supplemental Material
Supplemental material for this article is available online.
References
Supplementary Material
Please find the following supplemental material available below.
For Open Access articles published under a Creative Commons License, all supplemental material carries the same license as the article it is associated with.
For non-Open Access articles published, all supplemental material carries a non-exclusive license, and permission requests for re-use of supplemental material or any part of supplemental material shall be sent directly to the copyright owner as specified in the copyright notice associated with the article.