
Abstract
Objective
To explore the value of 5T magnetic resonance imaging (MRI) T1ρ and T2 mapping sequences in evaluating muscle changes around knee osteoarthritis (KOA).
Methods
50 KOA patients and 36 healthy volunteers underwent knee MRI and peripheral muscle T1ρ/T2 mapping scans, comparing intergroup differences in each muscle’s T1ρ/T2 values and analyzing their correlation with KOA severity.
Results
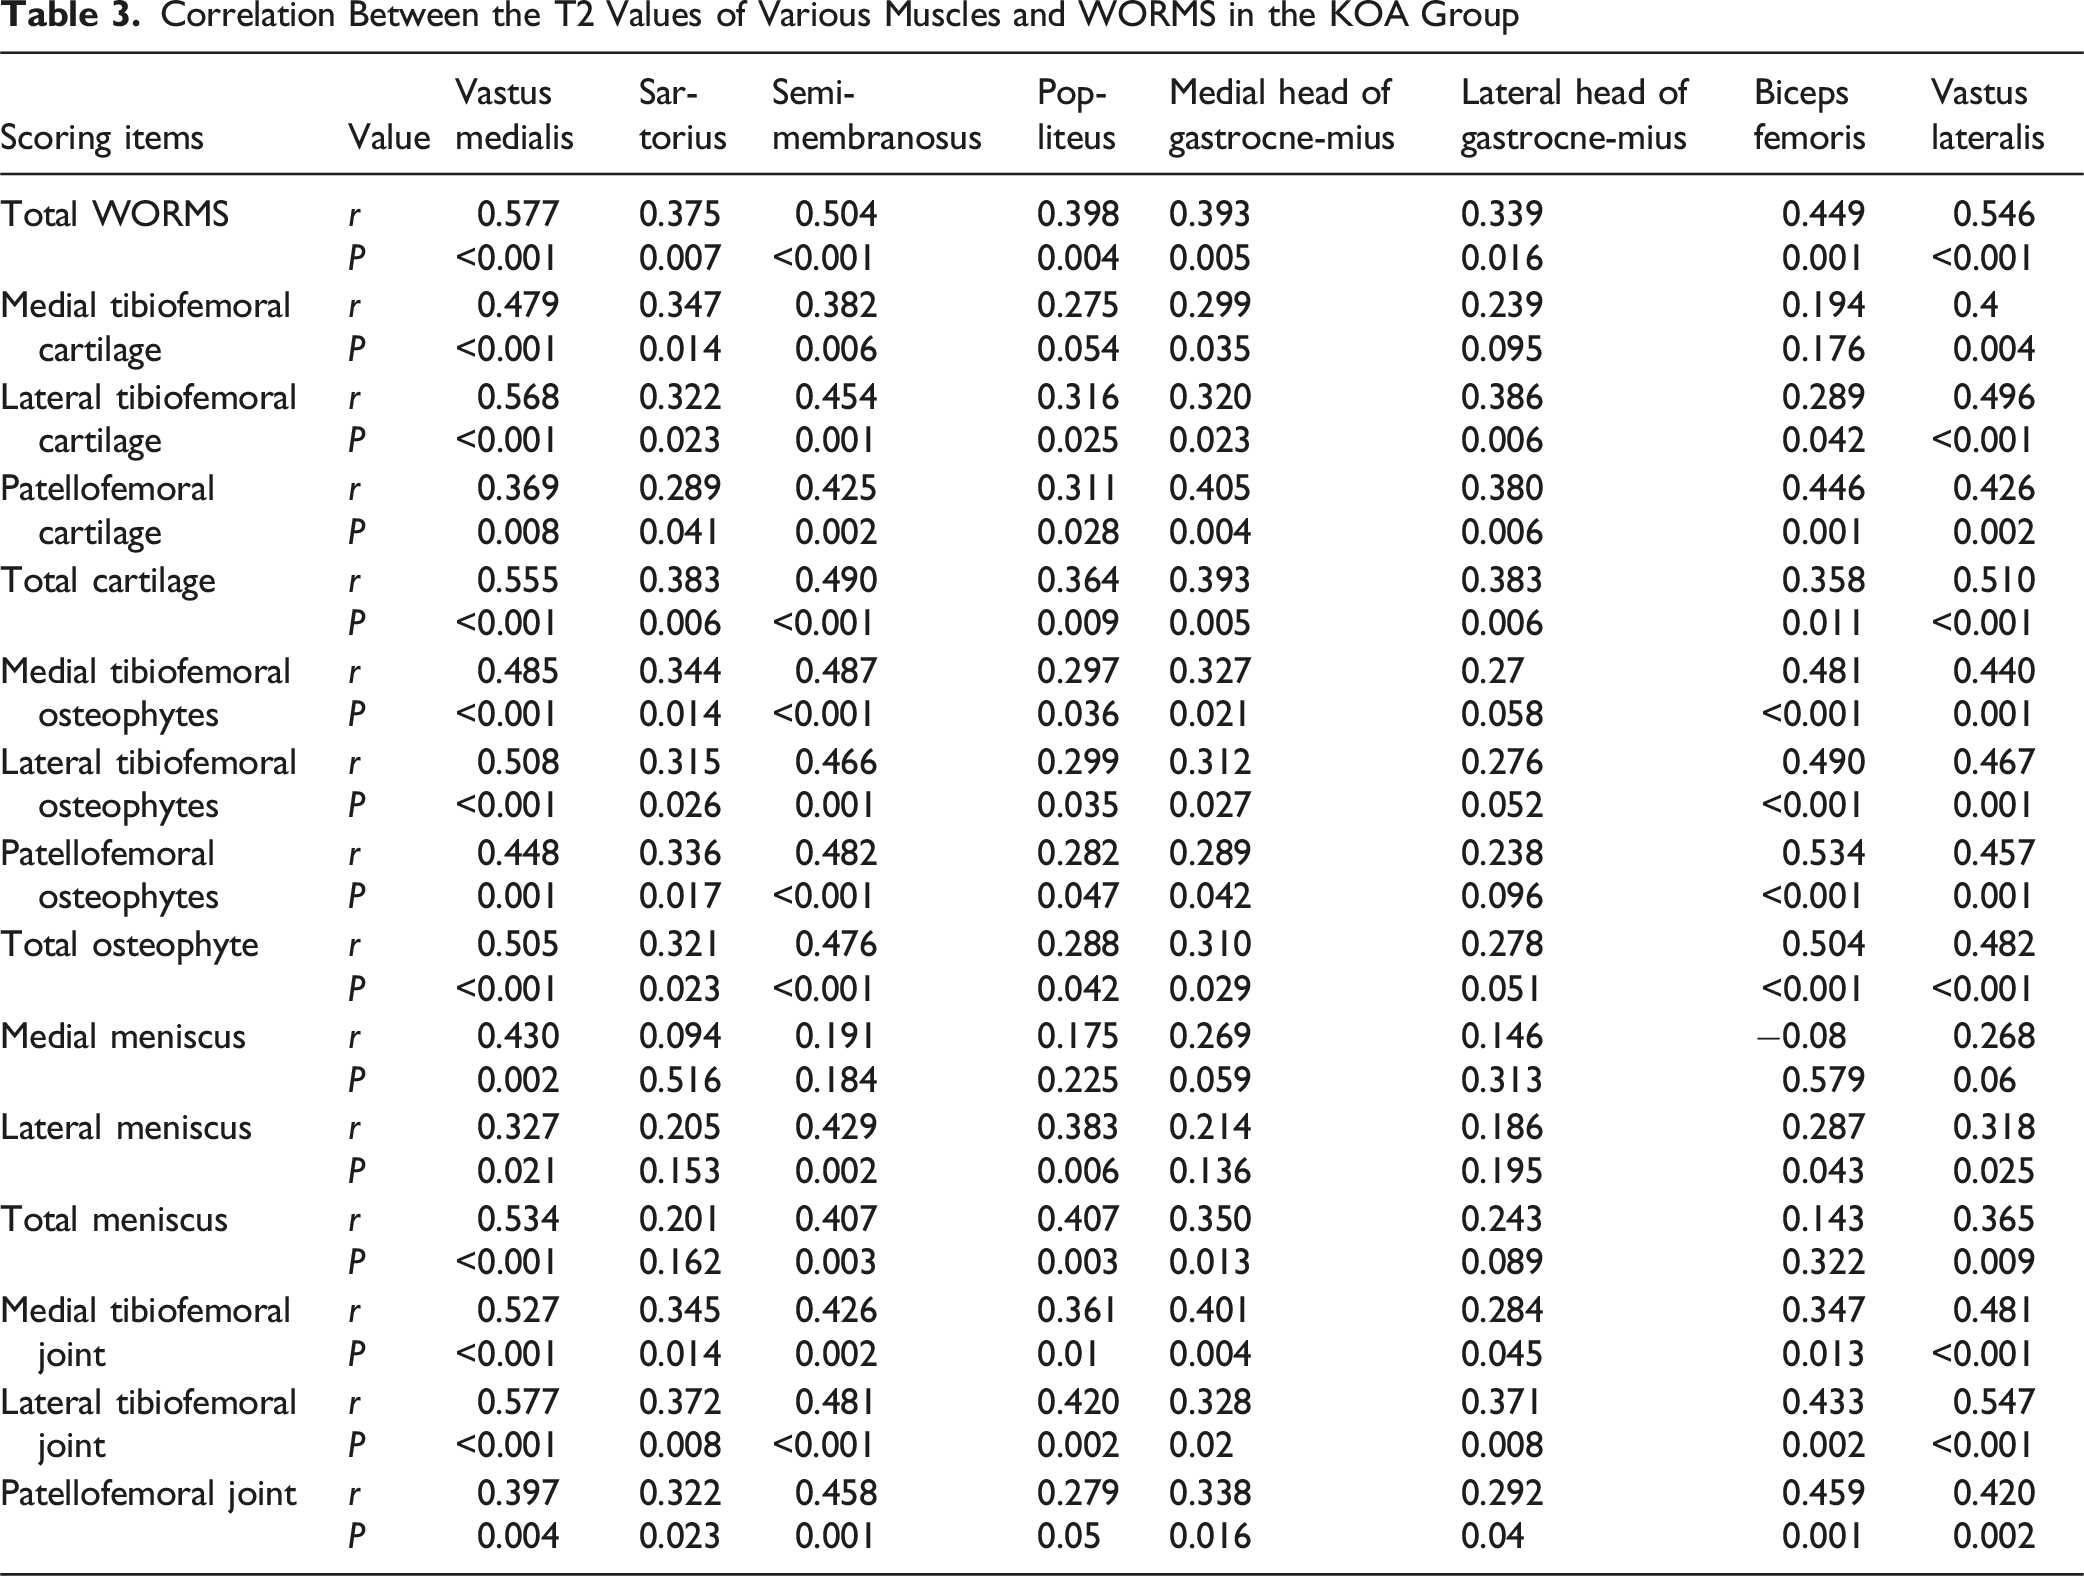
The T1ρ and T2 values of the vastus medialis, vastus lateralis, biceps femoris, medial head of gastrocnemius, lateral head of gastrocnemius, and popliteus in KOA patients were higher than those in healthy volunteers, as well as the T2 values of the sartorius and semimembranosus. The T1ρ value of the vastus medialis is positively correlated with the whole-organ MRI score (WORMS) for the knee. The T2 values of the vastus medialis, sartorius, semimembranosus, popliteus, medial head of gastrocnemius, lateral head of gastrocnemius, biceps femoris and vastus lateralis are also positively correlated with the WORMS for the knee.
Conclusion
The 5T MRI T1ρ and T2 mapping techniques can sensitively and quantitatively evaluate the changes in peri-articular muscles with KOA, providing important references for the clinical diagnosis and treatment of KOA.

Keywords
Introduction
Knee osteoarthritis (KOA) is a degenerative disease characterized by cartilage degeneration, synovitis, and peri-articular muscle dysfunction. Typical magnetic resonance imaging (MRI) findings of KOA include cartilage thinning or loss, bone marrow edema, joint effusion, meniscal and ligament abnormalities, and joint space narrowing. 1 Numerous studies have demonstrated that fat infiltration, fibrosis, and the peri-articular muscles are not only secondary changes in KOA, but may also accelerate joint degeneration through biomechanical imbalances.2-4 The decrease in the function and quality of muscles around the knee joint is closely related to the progression of KOA, and the recovery and rehabilitation training of muscle strength and function can effectively alleviate the symptoms of KOA and delay disease progression.5,6
The Whole-Organ Magnetic Resonance Imaging Score 7 (WORMS) is a semi-quantitative, multi-feature scoring system for comprehensively assessing the structural integrity and lesion severity of KOA on MRI. It divides the knee into 4 compartments (medial tibiofemoral joint, lateral tibiofemoral joint, patellar joint, intercondylar area) and evaluates 15 distinct regions across these compartments. The evaluation encompasses 5 key characteristics within these regions: cartilage signal and morphology, subchondral bone marrow abnormalities, subchondral cysts, bone attrition, and marginal osteophytes. Additionally, WORMS assesses the medial and lateral menisci, the anterior and posterior cruciate ligaments, the medial and lateral collateral ligaments, synovitis, loose bodies, and periarticular cysts or bursae. A higher WORMS score indicates more severe structural damage to the knee joint.
T1ρ and T2 mapping sequences are 2 quantitative imaging methods in MRI technology, which can provide tissue-specific relaxation time parameters. T1ρ imaging probes the macromolecular content in tissues by measuring the spin-lattice relaxation time in the rotating frame (T1ρ). The T1ρ value is sensitive to changes in the concentration of proteins and proteoglycans due to its sensitivity to low-frequency interactions between water and the macromolecular matrix.8-10 T2 mapping quantifies the transverse relaxation time (T2 value) on a pixel-by-pixel basis, typically by fitting data from a multi-echo sequence. The T2 value is sensitive to changes in tissue water content and the composition of its microenvironment, including interactions with proteins and lipids.11,12 In the assessment of KOA, T1ρ and T2 mapping sequences can provide quantitative information about the muscle status around the knee joint, which is of great value for evaluating pathological changes in muscles.
Most previous studies using quantitative MRI sequences (including T1ρ and T2 mapping) to assess musculoskeletal tissue of KOA were conducted at a field strength of 3T. This field strength provides a good balance between signal-to-noise ratio (SNR), spatial resolution and clinical usability, and demonstrates value in detecting early cartilage degradation.13-15 However, imaging muscles around knee joint, especially quantifying subtle fat infiltrates and composition changes, poses unique challenges. These tissues often require higher spatial resolution to distinguish fine structures, which sacrifices SNR at regular field strengths. As an emerging ultra-high field (UHF) strength platform, 5T MRI provides potential solutions to overcome these limitations. The main theoretical advantage of 5T is its significantly improved SNR compared to 3T.16,17 This enhanced SNR can be strategically used to (i) achieve higher spatial resolution to present finer anatomical details, (ii) shorten scan times to improve patient comfort and reduce motion artifacts, and (iii) improve the accuracy and repeatability of quantitative Mapping techniques. Consequently, the superior SNR of 5T MRI is expected to enhance the sensitivity of T1ρ and T2 mapping for detecting subtle muscular changes in KOA. To our knowledge, no studies have yet investigated the peri-articular muscles in KOA using 5T MRI. Therefore, this study aims to provide a new perspective for the evaluation of KOA using 5T UHF MRI combined with quantitative imaging techniques (T1ρ and T2 mapping).
Materials and Methods
Research Object
This cross-sectional prospective study was conducted from May 2023 to May 2024. The study enrolled patients with KOA from Shandong Provincial Third Hospital and healthy community-based volunteers as controls.
The inclusion criteria for KOA patients were as follows: (1) age ≥40 years; (2) knee pain lasting >1 month; (3) clinical symptoms such as joint stiffness (lasting <30 minutes), pain during squatting, standing, and stair climbing; and (4) imaging findings consistent with KOA. Healthy volunteers were recruited from the community and matched to the KOA group by age and sex. To be eligible, they had to have no history of knee disorders or related clinical symptoms. Exclusion criteria for all participants included: (1) history of knee or peri-knee muscle injury; (2) acute or chronic knee infection; (3) neuromuscular diseases; (4) non-infectious inflammatory knee conditions such as rheumatoid arthritis; (5) developmental abnormalities of the hip, spine, or lower limb joints; and (6) contraindications to MRI or poor image quality.
Scanning Sequences and Parameters
Scan Sequences and Parameters

Note: FOV, field of view; Res., in-plane resolution; TR, repetition time; TE, echo time; ST, slice thickness; Time, scan time.
WORMS for the Knee
The WORMS scoring was performed independently by 2 radiologists: an associate chief physician with 15 years of experience and a chief physician with 20 years of experience. Both are highly experienced in musculoskeletal imaging. Any discrepancies in scoring were resolved through consensus discussion. The medial tibiofemoral joint cartilage, lateral tibiofemoral joint cartilage, patellofemoral joint cartilage, medial tibiofemoral joint osteophytes, lateral tibiofemoral joint osteophytes, patellofemoral joint osteophytes, medial meniscus, lateral meniscus, medial tibiofemoral joint, lateral tibiofemoral joint, and patellofemoral joint were scored respectively. The parameters assessed for the medial tibiofemoral, lateral tibiofemoral, and patellofemoral joints were subarticular bone marrow edema, subarticular cysts, and bone wear. The WORMS total score was obtained by summing the scores from all sub-items.
Image Post-Processing and Analysis
In this study, muscle parameters were measured in the sagittal plane in combination with cross-sections. The muscles selected for measurement around the knee joint included the vastus medialis, sartorius, semimembranosus, popliteus, medial and lateral heads of the gastrocnemius, biceps femoris, and vastus lateralis. All measurements were performed using the post-processing software package on the United Imaging 5T MRI workstation. The region of interest (ROI) was manually delineated on T1ρ and T2 mapping images, and the values for each muscle were recorded. For each muscle, the largest visible slice was selected. A circular ROI with an area of approximately 0.5 cm2 was placed at the center of the muscle contour on the corresponding slice, carefully avoiding visible blood vessels and intramuscular fat areas (Figure 1). The same method was applied to the anterior and posterior layers of the largest muscle slice, resulting in 3 measurements per muscle. The T1ρ and T2 values for each muscle were then analyzed based on the average of these 3 measurements. All T1ρ and T2 value measurements were conducted in a double-blind manner by 2 radiologists: one attending physician with 5 years of experience and one associate chief physician with 15 years of experience. Magnetic Resonance Images and Region of Interest (ROI) Presentation of the Medial Head of Gastrocnemius in a 50-Year-Old Female With Knee Osteoarthritis (KOA). Note. (A) PD-FSE-SAG; (B) T1ρ-SAG; (C) T2MAP-SAG. A Whole-Organ Magnetic Resonance Imaging Score (WORMS) Score of 173 in this KOA Patient
Statistical Methods
Statistical analysis was performed using SPSS software (version 26.0). The normality of all continuous data was assessed using the Kolmogorov-Smirnov (K-S) test. Normally distributed measurement data are presented as mean ± standard deviation (
Results
General Information
Finally, 50 KOA patients (KOA group) were included, including 28 males and 22 females, aged 40-76 (58.14 ± 10.20) years; 36 healthy volunteers (control group), including 20 males and 16 females, aged 40-69 (56.50 ± 7.71) years. No statistically significant differences were found in gender distribution or mean age between the 2 groups (P > 0.05). A total of 86 knee joints were included (50 in the KOA group and 36 in the control group). Normality tests indicated that the T1ρ and T2 values of all muscles, as well as the WORMS data, were non-normally distributed. Figures 2 and 3 show the T1ρ and T2 values, respectively, for all 8 studied muscles (vastus medialis, sartorius, semimembranosus, popliteus, medial and lateral gastrocnemius, biceps femoris, and vastus lateralis) in both the KOA and control groups. The WORMS scores of 50 KOA patients were shown in Figure 4. Distribution of Peri-articular Muscle T1ρ Values in KOA and Control Groups. Note. The Box Plots Depict the Median (Central Line), Interquartile Range (Box Boundaries), and the Minimum and Maximum Values (Whiskers). The P-value Indicates the Significance of the Inter-group Difference Distribution of Peri-articular Muscle T2 Values in KOA and Control Groups. Note. Box Plot Details are as Described in Figure 2. The P-value Indicates the Significance of the Inter-group Comparison Distribution of WORMS Scores in the KOA Group


Comparison of Muscle T1ρ and T2 Values Between KOA Group and Control Group
The T1ρ values were significantly higher in the KOA group compared to the control group for the vastus medialis, popliteus, medial and lateral gastrocnemius, biceps femoris, and vastus lateralis (P < 0.05; Figure 2). The T2 values were significantly elevated in the KOA group for all 8 muscles studied (P < 0.05; Figure 3). Figures 2 and 3 respectively show the box plots of T1ρ and T2 values distribution, as well as the statistical analysis of the differences in T1ρ and T2 values between the 2 groups of each muscle.
Correlation Between T1ρ Value of KOA Group Muscles and WORMS
Correlation Between the T1ρ Values of Various Muscles and Whole-Organ Magnetic Resonance Imaging Score (WORMS) in the Knee Osteoarthritis (KOA) Group


Heatmap of Correlations Between Muscle T1ρ/T2 Values and WORMS in the KOA Patients. Note. Color Intensity Represents the Strength of the Correlation Coefficient (r), With Blue and Red Indicating Negative and Positive Correlations, Respectively
Correlation Between Muscle T2 Values and WORMS in KOA Group
Correlation Between the T2 Values of Various Muscles and WORMS in the KOA Group
Repeatability Analysis of T1ρ and T2 Values of Muscles Around the Knee Joint
The inter-observer reliability of muscle T1ρ and T2 measurements between the 2 radiologists was excellent in both the KOA group and the control group, with ICC values of 0.910 (95% CI: 0.793-0.961) and 0.913 (95% CI: 0.802-0.962), respectively.
Discussions
The pathophysiological mechanisms underlying peri-articular muscle changes in KOA involve multiple aspects such as muscle atrophy, functional imbalance, fatty infiltration, abnormal neuromuscular control, biomechanical imbalance, inflammatory response, and metabolic disorders.18,19 These mechanisms interact and collectively lead to knee joint dysfunction and increased pain. Previous studies using T1ρ and T2 mapping in KOA have primarily focused on pathologies of the joint cartilage, menisci, and ligaments, while research on peri-articular muscle changes has been limited.20,21 This study utilizes quantitative T1ρ and T2 mapping at 5T MRI to investigate the correlation between changes in muscle T1ρ and T2 values and WORMS scores in KOA patients, and to explore the potential mechanisms behind these quantitative MRI alterations.
Analysis of the Reasons of T1ρ Value Changes in the Muscles Around the Knee Joint of KOA Patients
In patients with KOA, the increase in T1ρ values of surrounding muscles may be related to the following mechanisms: these patients often experience fat infiltration, fibrosis, and atrophy due to pain and reduced activity, which leads to disorganization of muscle fiber structure. 22 When the content of proteoglycans is relatively low, the relaxation time of T1ρ is relatively high, resulting in an increase in T1ρ values.23,24 In muscle morphology, there is a change in fiber type, mainly manifested as atrophy of type II fast muscle fibers and an increase in the proportion of type I slow muscle fibers. 25 Slow muscle fibers exhibit higher T1ρ values due to their abundant mitochondria and dense vascular network, as the presence of mitochondria and vascular network increases tissue complexity and signal intensity. Muscle atrophy is accompanied by a decrease in mitochondrial function and energy metabolism disorders, which can lead to changes in the intracellular environment, such as increased membrane permeability and swelling of organelles. These changes can increase the T1ρ value.26,27 Muscle atrophy and decreased strength can lead to a redistribution of mechanical loads across the knee. This may cause excessive activation or fatigue in specific muscles (such as the vastus medialis), which in turn exacerbates joint damage and degeneration. In addition, chronic inflammation may affect the extracellular matrix components of muscle cells through cytokines such as IL-6 and TNF-α, increasing T1ρ values.28,29 These factors work together to cause changes in the microstructure and composition of muscle tissue, resulting in an increase in T1ρ values. This study showed a significant positive correlation between the T1ρ value of the vastus medialis and most of the WORMS scoring items, especially in the WORMS total score, cartilage and osteophyte scores. This suggests that the condition of the vastus medialis is closely related to joint health (especially cartilage and osteophyte) and is a key muscle for joint protection. The cross-sectional area of the vastus medialis decreases, and may be accompanied by fat infiltration and fibrosis. 30 Its functional decline leads to decreased dynamic stability of the knee joint, abnormal joint load distribution, and further accelerates cartilage degeneration. The correlation between the T1ρ value of the vastus medialis and the cartilage score of the lateral tibiofemoral joint was the highest, which is consistent with previous literature results. 31
Insufficient strength of the vastus medialis can lead to mechanical imbalance in the knee joint, causing the patella to shift laterally and increasing the load on the lateral side of the knee joint. This deviation not only increases the stress on the lateral compartment of the knee joint, but also damages to the cartilage of the lateral tibiofemoral joint. This study showed that the T1ρ value of the lateral head of the gastrocnemius muscle is significantly positively correlated with the medial tibiofemoral joint score (including intra-articular bone marrow edema, bone capsule degeneration, and bone wear). A previous study has indicated that an increase in the contraction force of the lateral head of the gastrocnemius muscle can reduce the load on the medial compartment. 32 During knee arthritis, the gastrocnemius muscle strength decreases, which may increase the load on the medial tibiofemoral joint, leading to bone marrow edema, cystic degeneration, and wear of the medial tibiofemoral joint. 33 Further research is needed to determine whether there is a significant difference between the T1ρ value of the popliteus and the scores of cartilages and medial tibiofemoral joint. There was no significant difference in T1ρ values between the KOA group and the control group for the sartorius and semimembranosus muscles. This may be due to the fact that the role of the sartorius muscle in knee joint function may not be as significant as that of the quadriceps core, and it bears less load in daily activities, resulting in less significant degeneration and less significant increase in T1ρ values. As a part of the hamstring muscle, the semimembranosus plays an auxiliary role in knee joint stability, and its degeneration may have a weak relationship with joint degeneration.
There is no significant correlation between the T1ρ value of the vastus lateralis and WORMS. This may be due to the fact that the vastus lateralis is the largest and strongest muscle among the quadriceps femoris. At the same time, when the knee joint flexes, the length of the muscle fibers of the vastus lateralis increases, and it uses connective tissue elasticity to store energy, generating greater contraction force. When the knee is extended, the vastus lateralis exerts less force and only needs low strength to maintain joint stability. Therefore, the vastus lateralis may degenerate later than the vastus medialis in KOA.
Analysis of the Reasons of T2 Value Changes in the Muscles Around the Knee Joint of KOA Patients
This study showed that the T2 values of muscles around the knee joint in the KOA group were significantly higher compared to the control group. The increase in T2 values of muscles around the knee joint in KOA patients arises from multiple factors: direct factors include edema, fat infiltration, atrophy, and inflammation, and indirect factors include biomechanical compensation, metabolic abnormalities, and neural control dysregulation. 34 The T2 values of each muscle were positively correlated with the total WORMS score, cartilage score, and joint score, indicating that T2 value is an important indicator reflecting the degree of knee disease and functional impairment, and is also a key parameter for early diagnosis and evaluation of knee disease progression. This study found that the T2 values of the vastus medialis and vastus lateralis were more strongly correlated with WORMS scores, while those of the sartorius and popliteus had a relatively weaker correlation. The vastus medialis is mainly responsible for the internal rotation and flexion of the knee joint, while the vastus lateralis participates in the external rotation and extension of the knee joint. These muscles bear greater loads during knee joint activity, resulting in stronger fatigue and weaker endurance, making them more susceptible to knee joint pathologies.35,36 In contrast, the sartorius and popliteus focus more on controlling the movement of the anterior and posterior thighs, rather than directly bearing the mechanical load of the knee joint. The vastus medialis and vastus lateralis contain a high proportion of rapidly contracting fibers (such as IIA fibers), which are prone to fatigue and degeneration during knee joint activity. As age increases or knee joint lesions develop, the proportion of fat infiltration and fibrotic tissue in these muscles will increase, leading to an elevated T2 value. 37 In addition, a study has shown that the degeneration of the vastus medialis and vastus lateralis not only directly affects the mechanical balance of the knee joint, but may also accelerate the degeneration of knee cartilage by altering joint stress distribution and increasing cartilage burden. 38 From a rehabilitation perspective, strengthening training for the vastus medialis and vastus lateralis can better improve knee joint function. This study also found that there were differences in the correlation between different WORMS indicators of the knee (such as cartilage, osteophytes, and meniscus) and the T2 values of the muscle. The correlation between osteophyte related indicators and muscle T2 values was the strongest, followed by cartilage related indicators, and meniscus related indicators were relatively weak. At present, there is no direct literature to study the relationship between T2 values of muscles around the knee joint and osteophytes and meniscus scores. We speculate that the reasons may be as follows: Osteophytes usually develop at the joint margins, altering the biomechanical properties of the knee. The formation of osteophyte and cartilage wear can lead to uneven joint surfaces, increased friction and pressure on the joint, and thus affect the mechanical load on surrounding muscles. This change in mechanical stress may lead to overuse, fatigue, and injury of muscles, causing muscle edema and fibrosis. At the same time, the formation of osteophyte, cartilage wear, and degeneration are usually accompanied by local inflammatory reactions. Inflammatory factors can spread to surrounding muscles, causing inflammation and edema of the muscles. The joint pain and mechanical stress changes caused by osteophyte may also affect the blood flow and metabolism of surrounding muscles through neural reflex mechanisms, which can lead to metabolic stress, muscle atrophy and edema, fibrosis, and thus increase T2 values. Cartilage wear can lead to increased joint instability, requiring more strength from surrounding muscles to maintain joint stability, which may result in muscle overuse and fatigue, ultimately affecting T2 values. The meniscus is located inside the knee joint and its main function is to distribute joint load and absorb buffering, reducing the risk of cartilage wear. Although meniscus lesions (such as tearing or degeneration) can affect the mechanical properties of joints, their direct impact on surrounding muscles is relatively small due to their deep location. The inflammatory response caused by meniscus lesions is usually confined to the joint cavity, and the concentration of inflammatory factors reaching the surrounding muscles is low, resulting in a minimal impact on muscle T2 values. Following meniscus lesions, peri-articular muscles may maintain joint stability and function through compensatory mechanisms, thereby mitigating the impact on muscle tissue.
The Added Value of 5T
Our study utilized a 5T MRI system, which contributed significantly to the robustness of our findings. The UHF strength provides superior SNR, which likely improved the precision of our T1ρ and T2 measurements as well as the reliability of the WORMS assessments in the musculature. This technological advantage may explain why we were able to detect significant correlations between quantitative muscle changes and clinical WORMS scores. While 3T remains the clinical workhorse for musculoskeletal imaging and is undoubtedly capable of detecting gross muscular pathology, the superior sensitivity of 5T could be particularly valuable in a research context for identifying the earliest stages of muscle degeneration, potentially enabling earlier intervention. It is also important to note that 5T MRI has limitations, including increased susceptibility to artifacts, a higher specific absorption rate, and limited clinical availability, which currently restricts its use primarily to research institutions. Future studies directly comparing muscle quantitative imaging at 3T and 5T within the same cohort would be invaluable to precisely quantify the added benefit of UHF.
Limitations and Future Research Directions
This study has several limitations: (1) Due to limitations in image acquisition, we were unable to obtain measurements from other muscles of the knee joint, such as the rectus femoris and vastus intermedius. (2) The sample size was relatively small; larger-scale cohort studies are needed to provide stronger evidence for the relationship between muscle changes and KOA progression. (3) We did not account for the biomechanical stress experienced by the control group, which could have introduced bias.
In future work, we plan to integrate muscle fat quantification techniques to clarify the impact of fat infiltration on T1ρ and T2 values. We also plan to conduct a longitudinal study to observe temporal changes in T1ρ and T2 values and evaluate their potential as biomarkers for monitoring disease progression and treatment efficacy.
Conclusion
In summary, 5T MRI T1ρ and T2 mapping techniques can be used to sensitively and quantitatively evaluate changes in the muscles around the knee joint in patients with KOA, offering valuable insights for clinical diagnosis and treatment. As the severity of KOA increases, the T1ρ and T2 values of certain muscles increase. When the T1ρ and T2 measurements are compared with each other, the sensitivity of the T2 values may be better than the sensitivity of the T1ρ values.
Footnotes
Ethical Considerations
This study was approved by the Ethics Committee of the Shandong Provincial Third Hospital, Shandong University (approval number: KYLL-2023092), and all subjects were informed and signed informed consent forms.
Funding
The authors received no financial support for the research, authorship, and/or publication of this article.
Declaration of Conflicting Interests
The authors declared no potential conflicts of interest with respect to the research, authorship, and/or publication of this article.
Data Availability Statement
The datasets generated during and/or analyzed during the current study are available from the corresponding author on reasonable request.