
Abstract

Introduction
Cytokinins are a large group of phytohormones that regulate the growth and development of plants. Natural cytokinins are adenine derivatives with an aromatic or isoprenoid moiety at the N6 position. N6-(Δ2-Isopentenyl)adenine and its hydroxylated derivatives, zeatin (ZTN) and dihydrozeatin, are typical examples of isoprenoid cytokinins that regulate plant cell division and nutrient assimilation. 1 Researchers have been interested in how cytokinins modulate mammalian cells, and numerous studies on the potential of cytokinins in the treatment of various pathological conditions have been published. 2 Moreover, cytokinins have been included in cosmetic preparations to enhance skin structure and reduce signs of aging.
In both plant and animal cells, it has been shown that cytokinins trigger programmed cell death3,4 and demonstrate an antiproliferative effect on tumor cells. 5 In fact, ZTN is the most abundant cytokinin and one of the most extensively studied concerning its growth-regulating and anti-senescence activities in plant and human cells. 2 ZTN is isolated from immature Zea mays kernels 6 and is present in the tRNA of a wide range of organisms. 7 Two isomers of ZTN exist; cis-ZTN and trans-ZTN, according to the location of the terminal hydroxyl group on the isoprenoid side chain. Despite being relatively less active than trans-ZTN, cis-ZTN carries out numerous functions in plants. 8 Importantly, previous reports have demonstrated the anticancer activity of ZTN against leukemia, osteosarcoma, breast, melanoma, and cervical cancer cells. 9
Similar to nucleated cells undergoing apoptosis, red blood cells (RBCs) can undergo eryptosis, 10 characterized by membrane blebs, phosphatidylserine (PS) exposure, cell shrinkage, and decreased acetylcholinesterase (AChE) activity. 11 Eryptosis is triggered by an increase in cytosolic Ca2+ activity, hyperosmotic shock, ceramide, oxidative stress, energy depletion, and a number of endogenous and xenobiotic compounds. 12 Enhanced eryptosis is seen in several clinical conditions, such as sickle-cell disease, iron deficiency, Hb-C, G6PD deficiency, 10 and cancer. 13 Since the interaction between ZTN and human RBCs is still poorly understood, the current study was conducted to determine whether ZTN affects the physiology and lifespan of RBCs.
Methods
Chemicals and Solutions
All chemicals were purchased from Solarbio Life Science (Beijing, China) and were of the highest purity. A stock solution of trans-ZTN (CAS #13114-27-7) was prepared by dissolving 5 mg in 1 mL of dimethylsulfoxide (DMSO) and stored in aliquots at −80°C. Ringer solution was composed of 125 mM NaCl, 5 mM KCl, 1 mM MgSO4, 32 mM HEPES, 5 mM glucose, and 1 mM CaCl2, pH 7.4. Sucrose-Ringer was prepared by replacing NaCl with 250 mM sucrose, while KCl-Ringer was prepared by replacing NaCl and KCl with 125 mM KCl. Urea was added to standard Ringer solution at 300 mM, and PEG 8000 was added at a final concentration of 10% w/v. 14
Ethical Approval and Blood Collection
This study, conducted from October 2023 to January 2024, was approved by the Ethics Committee of King Saud University Medical City (E-23-7552). Inclusion criteria include being between 18 and 55 years of age, nonsmoker, and free from chronic disease or conditions that affect RBC health. Exclusion criteria include the lack of one or more of the inclusion criteria. No sample size calculation is required given the descriptive nature of the study. 15 EDTA and heparin whole blood samples were collected after informed consent according to the Declaration of Helsinki from 19 healthy individuals with normal CBC and BMI values. Donors were 14 males and 5 females aged 27-38 years. RBC suspensions in PBS (33% v/v) were prepared by centrifugation of whole blood at 3000 RPM for 20 min at room temperature. ZTN exposure (40-200 μM) was carried out for 24 h at 37°C in different buffers with a hematocrit of 5%.
Hemolysis
Control and treated cells were pelleted at 13,000 × g for 1 min at room temperature and the supernatants were harvested. Using LMPR-A14 microplate reader (Labtron Equipment Ltd., Surrey, UK), the absorbance of the supernatants was determined at 405 nm. Cells suspended in ddH2O to create a positive control (100% hemolysis) were run in parallel. 16
Hemolytic Markers
Aspartate aminotransferase (AST), lactate dehydrogenase (LDH), creatine kinase (CK), and magnesium (Mg2+) were evaluated in supernatants by BS-240Pro clinical chemistry analyzer (Mindray Medical International Limited, Shenzhen, China). K+, Na+, and pH were measured by EXIAS e1 electrolyte analyzer (EXIAS Medical GmbH, Graz, Austria).
AChE Activity
The activity of AChE was measured using BS-240Pro clinical chemistry analyzer. In the reaction mixture, butyrylthiocholine is hydrolyzed by AChE to butyrate and thiocholine which reduces hexacyanoferrate(III) to hexacyanoferrate(II) with a decrease in absorbance monitored at 405 nm.
PS Exposure
Annexin V-FITC was used to detect PS exposure on the outer membrane leaflet of the RBCs. Following incubation, control and experimental cells were stained with 1% annexin-V-FITC in a staining buffer containing 5 mM CaCl2 for 10 min at room temperature protected from light. Northern Lights flow cytometer (Cytek Biosciences, Fremont, CA, USA) was then used to quantify fluorescence (10,000 events) at an excitation wavelength of 488 nm and an emission wavelength of 512 nm. 16
Cell Morphology
Forward scatter (FSC) and side scatter (SSC) were used to estimate cell volume and surface complexity in 10,000 events. JSM-7610 F ultra-high resolution Schottky field emission scanning electron microscope (SEM) was also utilized at 15.0 kV to elucidate ultrastructural changes (JEOL Co., Ltd., Akishima, Tokyo, Japan). 16
Intracellular Ca2+
Intracellular Ca2+ was measured using Fluo4/AM. Briefly, cells were incubated with 5 μM of Fluo4/AM for 30 min at 37oC in the dark, washed twice to remove excess dye and fluorescence intensity was examined in 10,000 events (Ex/Em = 488/520 nm). 14
Oxidative Stress
Reactive oxygen species (ROS) were estimated by 2-,7-dichlorodihydrofluorescin diacetate (H2DCFDA). Control and experimental cells were incubated with 10 μM of H2DCFDA for 30 min at 37oC in the dark. DCF fluorescence was measured in 10,000 events at (Ex/Em = 488/533 nm). 17
Erythrocyte Aggregation
Erythrocyte sedimentation rate (ESR) of control and treated (200 μM) whole blood samples were determined by Westergren tubes. 16
Signal Transduction Analysis
Cells were treated with 200 μM of ZTN in the presence or absence of p38 inhibitor SB203580 (100 μM), CK1α inhibitor D4476 (20 μM), PKC inhibitor staurosporin (StSp; 1 μM), nitric oxide synthase (NOS) inhibitor L-NAME (20 μM), or ATP (500 μM).
CBC
Whole blood in EDTA was diluted 1:2 in PBS with and without 200 μM of ZTN, and, after incubation for 24 h at 37°C, a CBC was carried out using BC-6200 hematology analyzer (Mindray Medical International Limited, Shenzhen, China). 14
Statistics
All data were expressed as mean ± SEM (n = 9). The results were analyzed using GraphPad Prism 9.0 software (GraphPad Software Inc., CA, US). Two groups were analyzed by Student’s t-test while three or more groups were analyzed by one-way ANOVA. A P-value of <0.05 was considered statistically significant.
Results
Exposure of RBCs to ZTN in PBS caused significant hemolysis at 80 μM (20.81 ± 3.38%, P < 0.0001) and 100 μM (31.69 ± 2.76%, P < 0.0001) compared to control values of 1.17 ± 0.16%, as revealed in Figure 1A. In Ringer solution, control values of 0.68 ± 0.15% were only significantly increased at 200 μM (11.72 ± 3.44%, P < 0.001, Figure 1B). Accordingly, hemolytic markers including K+ (5.80 ± 0.02 mmol/L to 5.99 ± 0.03 mmol/L, P < 0.01, Figure 1C), LDH (13.40 ± 0.41 to 143.5 ± 15.16 U/L, P < 0.0001, Figure 1D), AST (4.78 ± 0.16 vs 9.41 ± 1.26 U/L, P < 0.001, Figure 1E), CK (0.30 ± 0.13 U/L to 3.12 ± 0.64 U/L, P < 0.0001, Figure 1F), and Na+ (150.9 ± 0.27 mmol/L to 154.9 ± 0.81 mmol/L, P < 0.001, Figure 1G) were significantly elevated upon exposure to 200 μM of ZTN. Disruption of membrane integrity may influence ion trafficking and the extracellular environment. Indeed, a significant decreased in extracellular Mg2+ levels from 0.79 ± 0.003 mmol/L to 0.64 ± 0.07 mmol/L (P < 0.05) and in pH from 7.08 ± 0.004 to 7.02 ± 0.02 (P < 0.01) were noted in Figure 1H and I, respectively. ZTN induces hemolysis. Hemolytic activity of ZTN in (A) PBS and (B) Ringer solution. Leakage of (C) K+, (D) LDH, (E) AST, (F) CK, (G) Na+, and (H) Mg2+ into the supernatants. (I) Extracellular pH. Results are shown as means ± SEM (n = 9). NS indicates no statistical significance, while *(P < 0.05), **(P < 0.01), ***(P < 0.001), and ****(P < 0.0001).
Next, we tested the potential eryptotic activity of ZTN using PS exposure and cellular morphology as toxic endpoints. As illustrated in Figure 2A and B, exposure to 200 μM of ZTN caused a significant increase in the percentage annexin-V-binding erythrocytes (2.92 ± 0.24% to 7.12 ± 0.3%, P < 0.0001). Additionally, there was a significant increase in the percentage of cells undergoing shrinkage (1.42 ± 0.04% to 2.45 ± 0.28%, P < 0.001, Figure 2C and D). No effect on AChE was detected (Figure 2E). ZTN also caused significant dacrocyte formation (Figure 3). Eryptotic activity of ZTN. (A) Representative histograms of annexin-V-FITC fluorescence. (B) Percentage of eryptotic cells. (C) Representative histograms FSC. (D) Percentage of shrunk cells. (E) AChE activity. Results are shown as means ± SEM (n = 9). NS indicates no statistical significance, while ***(P < 0.001), and ****(P < 0.0001). Effect of ZTN on cellular morphology. Representative SEM micrographs (x7,000) of control and treated cells showing the formation of dacrocytes (teardrop cells) upon ZTN exposure. Scale bar: 1 μm.

Other markers of eryptosis include increased Ca2+ and oxidative stress. The percentage of cells with high Ca2+ (Figure 4A and B) was significantly elevated (7.22 ± 0.35%, P < 0.0001) at 200 μM of ZTN in comparison with the control which was 2.99 ± 0.43%. Moreover, extracellular Ca2+ removal provided no protection against ZTN-induced hemolysis (Figure 4C). Compared to control cells, there was a significant increase in the percentage of cells with increased ROS following treatment with 200 μM of ZTN (2.20 ± 0.31% to 6.74 ± 0.33%, P < 0.0001) as seen in Figure 4D and E. Furthermore, the hemolytic action of ZTN (100 μM) was significantly reduced by L-NAME (18.19 ± 5.01% to 4.09 ± 0.6%, P < 0.01) as shown in Figure 4F, identifying NOS as a target of ZTN. ZTN increases cytosolic Ca2+ and ROS levels. (A) Representative histograms of Fluo4 fluorescence. (B) Percentage of cells with Ca2+ accumulation. (C) Effect of extracellular Ca2+ elimination on ZTN-induced hemolysis. (D) Representative histograms of DCF fluorescence. (E) Percentage of oxidized cells. (F) Effect of 20 μM of L-NAME on ZTN-induced hemolysis (100 μM). Results are shown as means ± SEM (n = 9). NS indicates no statistical significance, while **(P < 0.01) and ****(P < 0.0001).
In our analysis of signaling enzymes involved in RBC death, we found that StSp significantly decreased ZTN-induced hemolysis (11.65 ± 1.5% to 4.51 ± 1.27%, P < 0.0001, Figure 5A) but energy replenishment with ATP did not (Figure 5B). The addition of D4476 significantly inhibited the hemolytic activity of ZTN (11.53 ± 2.28% to 5.23 ± 1.83%, P < 0.05, Figure 5C). Like ATP, SB203580 did not attenuate ZTN toxicity (Figure 5D). Altogether, these findings implicate PKC and CK1α in ZTN-induced RBC death. Signal transduction analysis of the hemolytic activity of ZTN. Effect of (A) 1 μM of StSp (200 μM of ZTN), (B) 500 μM of ATP (100 μM of ZTN), (C) 20 μM of D4476 (200 μM of ZTN), and (D) 100 μM of SB (100 μM of ZTN) on hemolysis. Results are shown as means ± SEM (n = 9). NS indicates no statistical significance, while *(P < 0.05) and ****(P < 0.0001).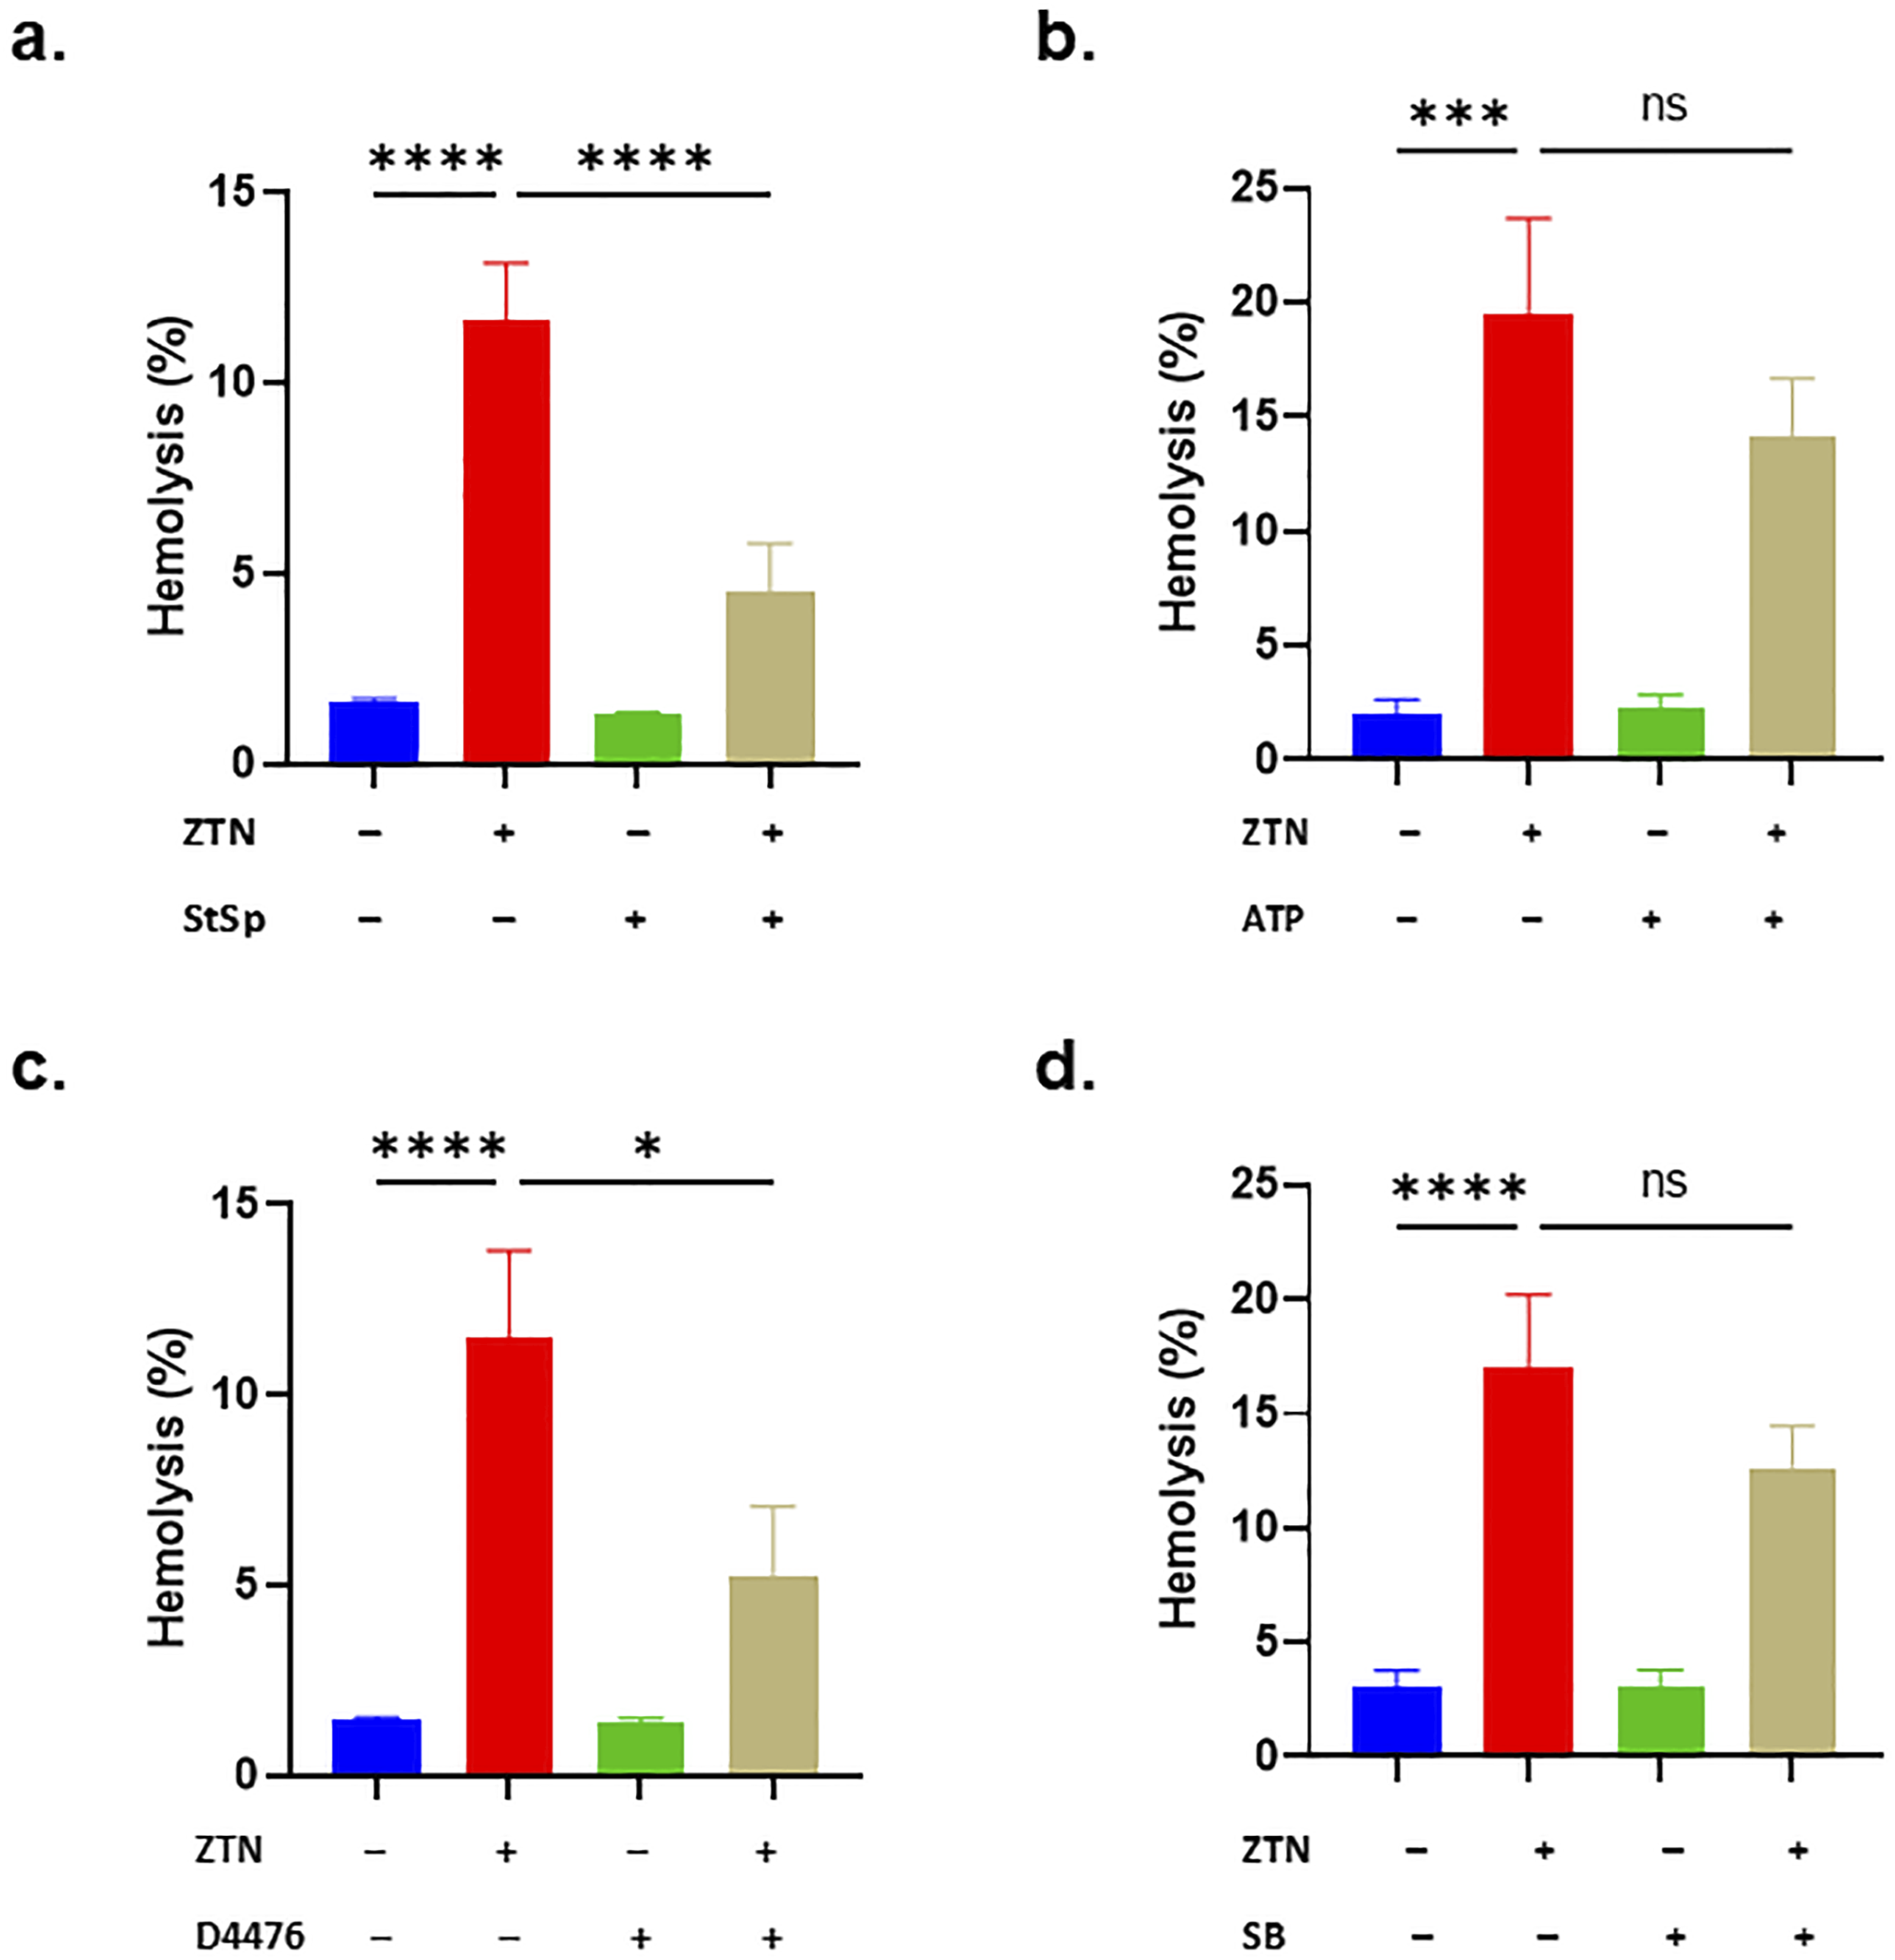
Furthermore, suspending the cells in K+-rich medium was not effective in reversing ZTN action (Figure 6A) unlike sucrose (10.36 ± 1.25% to 2.69 ± 0.45%, P < 0.0001, Figure 6B) and PEG (10.80 ± 1.92% to 8.55 ± 3.01%, P < 0.05, Figure 6C) supplementation. Interestingly, urea on its own (Figure 6D) failed to significantly attenuate the hemolytic activity of ZTN and the combined elimination of Ca2+ and addition of either 125 mM KCl (Figure 6E) or urea (Figure 6F) had no inhibitory effect. However, simultaneously increasing KCl to 125 mM and adding urea (Figure 6G) significantly inhibited ZTN toxicity (17.23 ± 2.76% to 5.99 ± 3.08%, P < 0.01) similar to what was observed when, in addition, Ca2+ was also removed (17.15 ± 1.48% to 10.26 ± 1.50%, P < 0.001. Figure 6H). Effect of modified Ringer solutions on ZTN toxicity. Hemolytic rate in control and treated (200 μM) cells in the presence and absence of (A) 125 mM of KCl, (B) 250 mM of sucrose, (C) 10% PEG, (D) 300 mM of urea (100 μM of ZTN), and combinations thereof (E-H). Results are shown as means ± SEM (n = 9). NS indicates no statistical significance while *(P < 0.05), **(P < 0.01), ***(P < 0.001), and ****(P < 0.0001).
We tested the effect of the presence of plasma proteins on ZTN toxicity to RBCs and other blood cells. Figure 7A shows the distribution of RBCs relative to their size. While the RBC count (Figure 7B), hematocrit (Figure 7C), hemoglobin (Figure 7D), and MCH (Figure 7E) remained unchanged, MCHC (301 ± 1.13 g/L to 287.7 ± 1.31 g/L, P < 0.0001, Figure 7F) was decreased and MCV (95.22 ± 0.91 f/L to 99.50 ± 0.51 f/L, P < 0.0001, Figure 7G) and RDW-CV (15.47 ± 0.31% to 15.78 ± 0.29%, P < 0.05, Figure 7H) were increased. In contrast, no significant toxicity was observed in platelet count (Figure 7I), MPV (Figure 7J), reticulocytes (Figure 7K), or ESR (Figure 7L). Also, WBCs (Figure 8A), their distribution (Figure 8B), and their subsets (Figure 7C–G) were not affected by ZTN. Effect of ZTN on RBC and platelet indices. (A) Representative histograms of RBC volume, (B) RBC viability, (C) HCT, (D) hemoglobin, (E) MCH, (F) MCHC, (G) MCV, (H) RDW-CV, (I) platelet viability, (J) MPV, (K) reticulocyte viability, and (L) ESR. Results are shown as means ± SEM (n = 9). NS indicates no statistical significance, while *(P < 0.05) and ****(P < 0.0001). Effect of ZTN on white blood cells. (A) Leukocyte viability. (B) Representative dot plots of the differential count of leukocytes, (C) neutrophil, (D) lymphocyte, (E) monocyte, (F) eosinophil, and (G) basophil viability. Results are shown as means ± SEM (n = 9). NS indicates no statistical significance.

Discussion
ZTN is a phytohormone with numerous biological properties including anti-aging and anticancer activities. The current study demonstrates a novel effect of ZTN which is the stimulation of eryptosis and hemolysis in human erythrocytes at concentrations that parallel those shown to be cytotoxic to a panel of cancer cells. 9 ZTN caused hemolysis with simultaneous K+, LDH, AST, and Na+ leakage (Figure 1) which indicates cell membrane rupture. Clinical implications of high quantities of circulating Hb include thrombosis and dystonia of the digestive, pulmonary, cardiovascular, and urogenital systems. 18 Moreover, preserving the equilibrium of electrolytes is necessary to maintain the acid-base balance. 19 Accordingly, disturbances in extracellular Mg2+, K+, and Na+ caused significant acidity (Figure 1). Previous research has shown that oxidative damage (Figure 4) to membranes is related to a lower cellular pH. 20 These findings point at the possible involvement of excess lactic acid formation and perturbed ATP turnover through glycolysis which deserves further examination.
ZTN treatment (40-200 μM) failed to trigger any extra apoptosis in young and senescent human skin fibroblasts. 21 Nevertheless, our findings demonstrate that ZTN possesses eryptotic effects which are reported for the first time (Figure 2). PS translocation from the inner leaflet to the outer surface of the cell membrane is identified by T-cell immunoglobulin mucin receptor 4. Consequently, macrophages immediately engulf and destroy PS-exposing cells.22,23 When hemolysis is preceded by eryptosis, Hb cannot be released, which could otherwise precipitate in the acidic lumen of renal tubules, pass through renal glomeruli, occlude nephrons, and cause renal failure. 24 Although eryptosis enables the removal of aged and damaged erythrocytes from the bloodstream before hemolysis commences, it nonetheless can result in a fall in the number of circulating RBCs and anemia. 10 This occurs when eryptosis is prematurely triggered by xenobiotics and compensatory erythropoiesis is overwhelmed. Several clinical conditions can predispose to anemia by increasing erythrocyte susceptibility to eryptosis including iron deficiency, malignancy, Hb-C, G6PD deficiency, sickle-cell disease, β-thalassemia, 10 dehydration, 25 diabetes mellitus, 26 hemolytic-uremic syndrome, 27 and chronic kidney disease. 28
Shrinkage of erythrocytes (Figure 2) is secondary to Ca2+ accumulation within the cells (Figure 4). This activates Ca2+-sensitive K+ channels, which allow K+ exit causing hyperpolarization of the cell membrane. As this happens, Cl− follows through along with water leading to cellular dehydration and shrinkage. 10 When Ca2+ was absent from the incubation medium, ZTN-induced hemolysis was not significantly reduced suggesting that Ca2+ is dispensable to the cytotoxicity of ZTN. Notably, we also found that ZTN induces the accumulation of ROS (Figure 4) despite reports that it has antioxidant effects against amyloid β-protein-induced neurotoxicity. 29 ROS can prime cells for eryptosis and hemolysis by activating Ca2+-permeable non-selective cation channels 30 or by causing direct damage to membrane proteins and lipids. Interestingly, inhibiting the activity of NOS with L-NAME completely abrogated ZTN-mediated cell death, identifying the enzyme as essential to the full cytotoxic activity of ZTN. 31 Previous reports have unequivocally established that NO donors nitroprusside and PAPA NONOate rescue RBCs from eryptosis.32,33 However, since NO can both promote and block apoptosis, it seems likely that in the presence of ZTN, NO functions as an eryptosis stimulator. To this end, future studies must explore the role of NO in mediating ZTN cytotoxicity possibly through oxidative stress and Ca2+ signaling.
Inhibition of PKC by StSp significantly diminished ZTN toxicity (Figure 5). Numerous investigations demonstrate that PKC activation and Rac GTPase trigger the generation of ROS (Figure 4) mediated by NADPH oxidase.34,35 Of note, PKC activation increases Ca2+, cell shrinkage, and PS exposure. 36 Likewise, D4476 significantly blunted ZTN-induced hemolysis. CK1α regulates RBC survival under hyperosmotic stress and energy depletion through Cl–-responsive Ca2+ channels. 37 ZTN toxicity was also greatly reduced when isosmotic sucrose was added to the incubation medium (Figure 6). Sucrose may inhibit colloidal osmotic swelling by accepting H+ from ZTN, reduce Cl– efflux, or restrict water influx. 38 Also, hemolysis was shown to be significantly reduced by PEGylation indicating that either ZTN or erythrocytes are ensnared by PEG.39,40 Furthermore, our findings demonstrate that neither urea nor KCl, each on its own, was able to rescue the cells; rather, a requirement for both modifications appears likely which is even more pronounced upon elimination of extracellular Ca2+. Altogether, these observations strongly suggest that ZTN action involves varying degrees of Ca2+ mobilization and KCl exit. Additionally, urea may modulate several transport systems which include Na+/K+/ATPase, KCl cotransport, or Na+/K+/2Cl− cotransport; or reduce sphingomyelinase activity. 41
In whole blood, ZTN treatment showed no evidence of cytotoxicity to platelets (Figure 7) or leukocytes (Figure 8). However, a significant increase in MCV and RDW-CV and a decrease in MCHC (Figure 7) was evident. This discrepancy between the increased MCV in whole blood and cell shrinkage in isolated RBCs (Figure 2) suggests differential regulation of ionic transport induced by ZTN in whole blood and in purified cells. It is reasonable to assume that KCl exit was paralleled by Na+ entry which increased cellular volume in whole blood.
Limitations of this work include the uncertainty surrounding the extrapolation of the findings in vivo, the inability to study the pharmacokinetics of ZTN, and the lack of chronic exposure. Nonetheless, the results presented herein provide an important framework upon which future studies can be based, particularly with regard to the hematological toxicity of ZTN as an anticancer agent.
Conclusion
In conclusion, this work shows that ZTN induces hemolysis and eryptosis characterized by cell membrane scrambling, cytosolic Ca2+, cell shrinkage, and oxidative stress. Importantly, we also describe the essential roles of NOS, PKC, and CK1α in triggering cell death by ZTN, and the protective effects of urea, sucrose, and PEG. Further validation of ZTN toxicity in animal models and in clinical trials is warranted.
Footnotes
Acknowledgments
We extend our appreciation to the Researchers Supporting Project (RSPD2024R554), King Saud University, Riyadh, Saudi Arabia for funding this work.
Author Contributions
Conceptualization, M.A.A.; methodology, all authors; software, M.A.A.; validation, I.A.A. and M.A.A.; formal analysis, all authors; investigation, I.A.A. and J.A.; resources, M.A.A.; data curation, all authors; writing—original draft preparation, all authors; writing—review and editing, all authors; visualization, J.A.; supervision, M.A.A.; project administration, M.A.A.; funding acquisition, M.A.A. All authors have read and agreed to the published version of the manuscript.
Declaration of Conflicting Interest
The author(s) declared no potential conflicts of interest with respect to the research, authorship, and/or publication of this article.
Funding
The author(s) disclosed receipt of the following financial support for the research, authorship, and/or publication of this article: this work was financially supported by the researchers supporting project (grant no. RSPD2024R554), King Saud University, Riyadh, Saudi Arabia.