
Abstract
Background
Computed Tomography has become the major source of population exposure in diagnostic x-rays. This concerned issue will be resolved by stetting Local Diagnostic Reference Levels.
Objectives
The main objective of this study is to assess dose indicators for the establishment of Local Diagnostic Reference Levels.
Materials and methods
A prospective cross-sectional study design was conducted on 8 public and private hospitals performing CT examinations. A total of 725 adult patients who underwent abdominopelvic, chest, and head CT examinations were evaluated from October 2021 to March 2022. Patients’ demography, exposure parameters, and dose descriptors were collected. The minimum, maximum, mean, median, and third quartile values were analyzed using SPSS software version 26. Finally, the third quartile values of collected data were compared with national and international values.
Results
The third quartile values obtained from median of volumetric computed tomography dose index (mGy) and dose length product (mGy.cm) which are considered as local DRLs for head, chest, and abdominopelvic CT examination, respectively, were 53 mGy, 14 mGy and 13 mGy
Conclusion
The results of this study showed that practices of CT imaging in both public and private hospitals in Addis Ababa were comparable to other national and international values.
Keywords
Introduction
There are various diagnostic imaging modalities, based on their image reconstruction techniques, the protocols involved for imaging, shape of the machine designed, and the basic science for discovery of machines in general.
CT is one of the popular diagnostic imaging modalities. It is used to provide cross-sectional images of the body for the sake of detecting and managing of different diseases. 1 In the history of healthcare services, CT has a crucial role in patient treatment procedures. According to published evidences, there is a rise in CT imaging for pediatric and adult patients across the continents, due to improvements of its hardware and software technologies. 2
Although CT has played a significant role in management of diseases, it is responsible to medical radiation induced cancer risks, since CT involves used ionizing radiation to generate images of the body being examined.3–5 The amount of radiation dose to the patients is associated with various factors. 6
As per request to radiation dose management, the International Commission on Radiological Protection (ICRP) introduced an intellectual term named as DRL to predict the amount of radiation doses delivered to the patients and to pass some corrective actions when necessary. 7 It is considered as an international best practice for radiation regulatory authorities and healthcare providers.
DRL plays a significant role to improve regional, national, or local distribution of observed dose metric results for a general imaging task, to promote good practice for a more specific medical imaging task and to promote an optimum range of values for a specified medical imaging protocol.8,9 The main objective of this study was to establish local DRLs for a common adult CT examination in Addis Ababa as a basement for future national DRLs in Ethiopia.
Materials and Methods
Study Design
This study was made through a prospective and descriptive cross-sectional study design in Addis Ababa, from October 2021 to March 2022. A total of 8 active private (5) and public (3) hospitals performing CT examination were identified from a total of eighteen active centers during the study period. The centers were chosen based on ICRP135 9 recommendations to conduct DRLs. Data was collected for the procedures in which acceptable image quality had observed. In this work, active CT scanners in the public and private Hospitals in Addis Ababa were identified and checked for the quality assurance certification.
Sample Size and Sampling Technique
In this study, a total of 725 adult patients, who visited the most routine CT examinations of abdominopelvic, chest, and head from 8 public and private Hospitals were targeted. The sample size was determined based on ICRP 135 recommendations to conduct such study. According to ICRP 135, patient dose surveys should include at least 30 standard size patients. As evidence showed, the standard size of Ethiopian adult weight is 56.7 kg. 10 In order to obtain an average weight of 57 kg, all patients between 40 and 80 kg who were undergoing the 3 anatomical CT projection were included from each hospitals/clinics.
Data Collection Technique and Statistical Analysis
Initially self-administered questionnaires regarding patient’s demographic, CT unit scan parameters, dose describes was prepared in English and distributed to the radiographers working in the study Hospitals/Clinics. During data collection manufacturer, model, year of installation, number and of detector rows was recorded for each CT scanner. In addition to this, exposure parameters like tube current time product (mAs), peak kilovolt (kVp), scan length, and patient’s demographic data were collected. Also, with scan parameters the 2 CT dose indicator parameters like the volumetric CT dose index (CTDIvol) in (mGy) and dose length product (DLP) in (mGy.cm) was recorded from the console. The collected data were analyzed using IBM SPSS statistics of version 25. All recorded scan parameters and CT dose indicators were expressed in the order of mean, median, maximum, and minimum and standard deviation values. Finally, the local DRLs were determined as the third quartile of median values of CTDIvol and DLP for the most common CT examinations of head, chest, and abdominopelvic scans of adult patients.
Ethical Consideration
To respect the study group’s bill of rights, ethical considerations were taken into account. Any piece of information was kept confidential by not recording the names of respondents. The study was conducted after having ethical clearance from the Research and Ethics Committee of the department.
Results
Descriptive statistics of demographic data and CT exposure parameters in this study.

Note: T.sc.t; total scan time in second.
Descriptive statistics of CT dose quantities, CTDIvol (mGy) and DLP (mGy.cm) in this study.

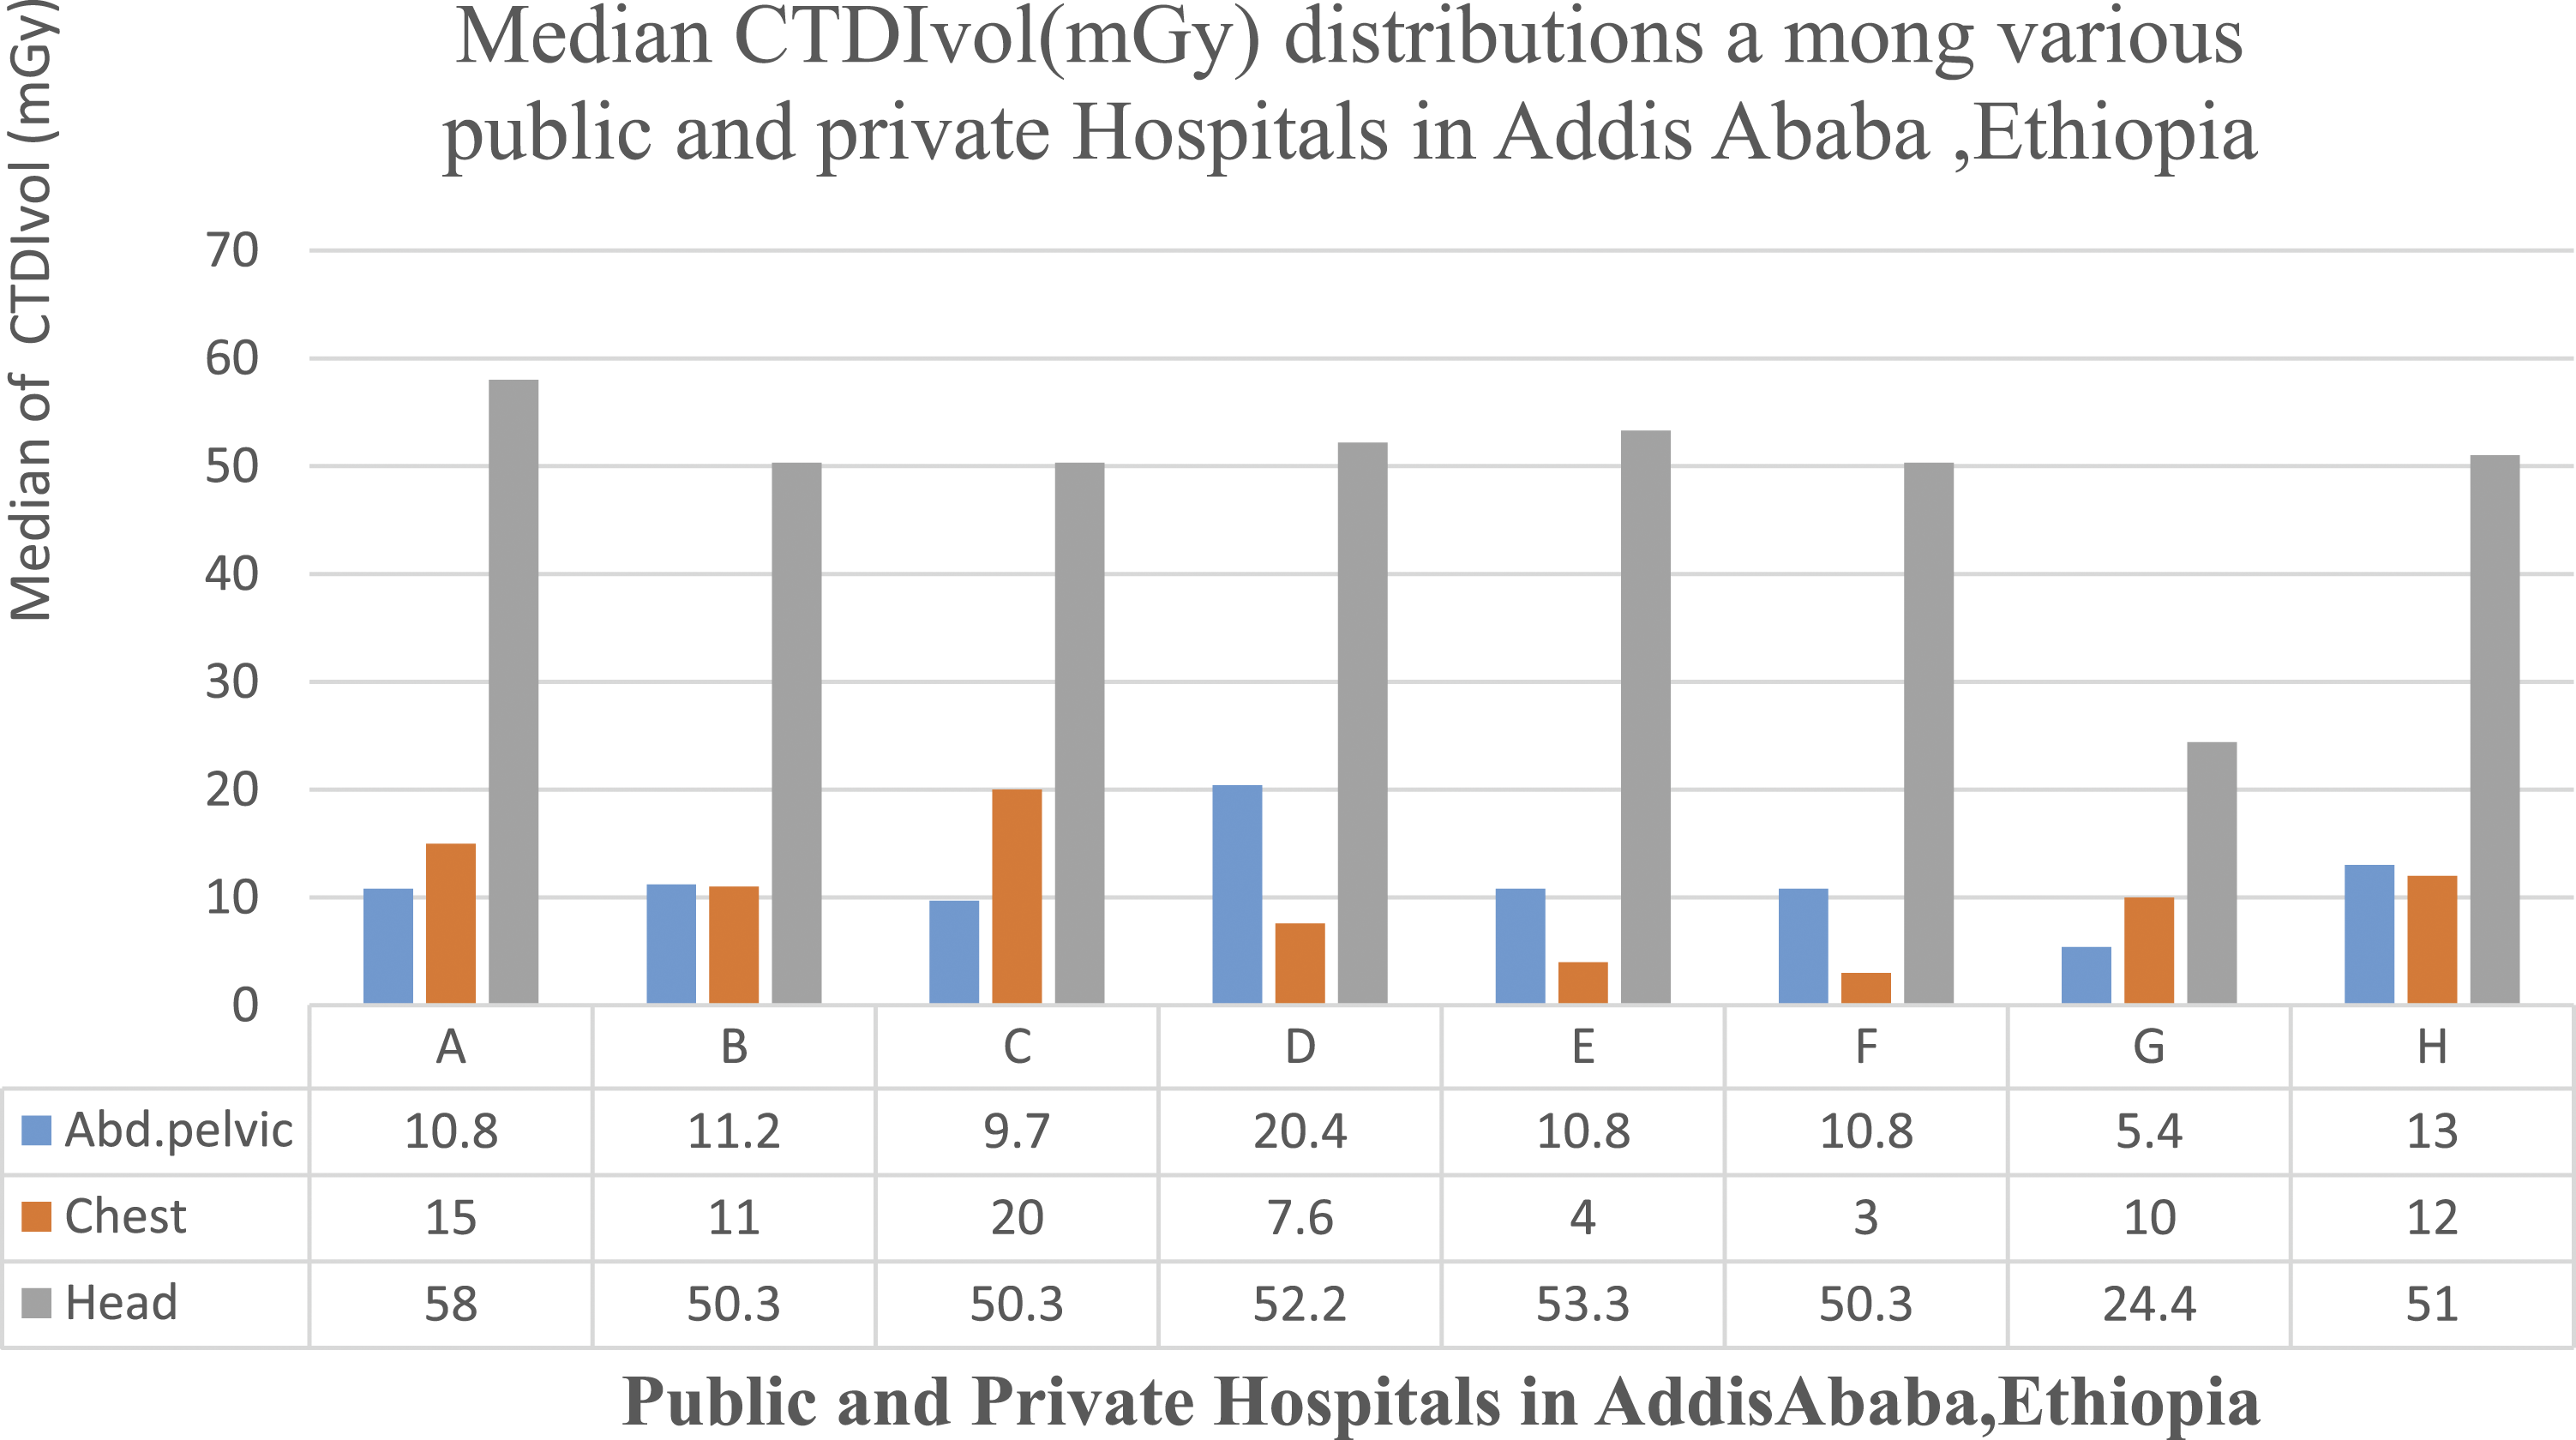
The CTDIvol (mGy) distribution among various CT scan centers in Addis Ababa.

The DLP (mGy.cm) distribution among various CT scan centers in Addis Ababa.
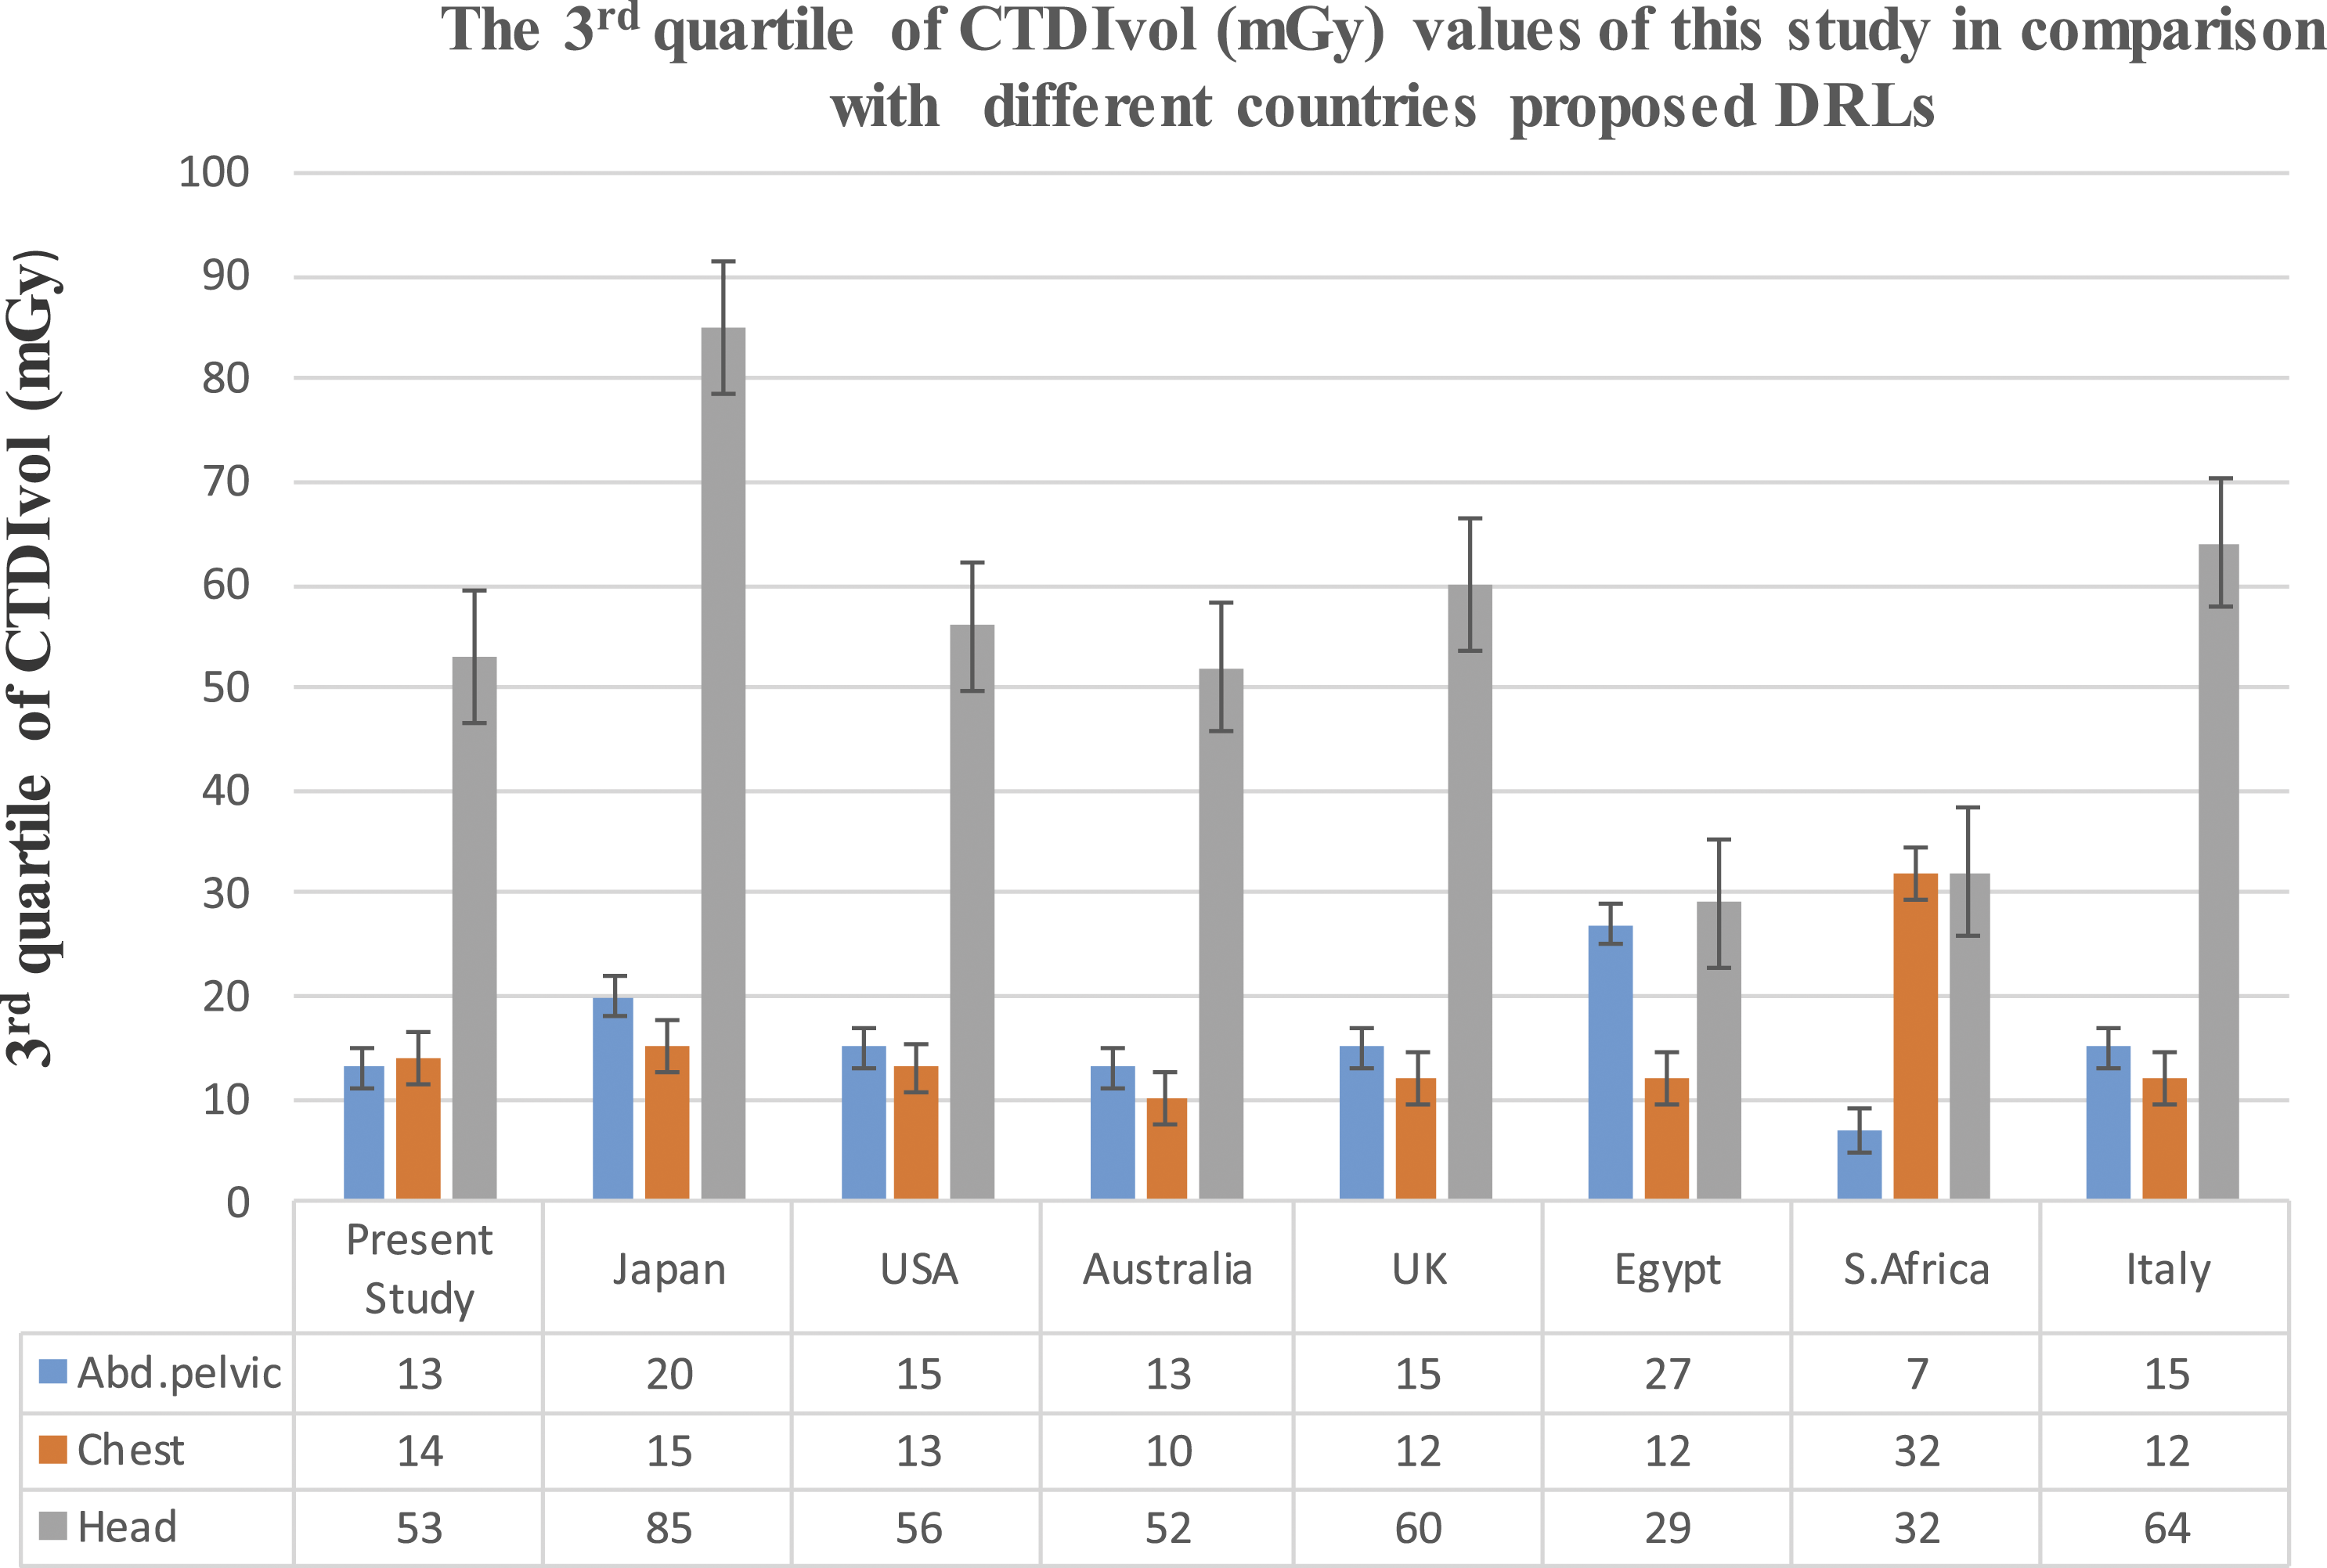
Shows comparison of local DRLs obtained from CTDIvol in this study with others similar studies proposed DRLs

Shows comparison of local DRLs obtained from DLP in this study with others similar proposed DRLs.
Discussion
In this study, wide ranges of CT examinations performed for 1 year in Addis Ababa for the most frequent procedures of the abdominopelvic, chest, and head were clearly assessed. Due to the new improvements of CT scanners hardware and software technologies, hospitals are equipped of theses scanners and physicians have also developed an interest of requesting CT scan for better investigation of acute and chronic diseases in public and private hospitals in Addis Ababa. The CT exposure parameters such as peak kilovolt (kVp), tube current time product (mAs), scan time, pitch factor, and scan length have a direct impact on the patients absorbed dose.11–14 As evidences have shown, the variation of those scan parameters has resulted a wide range of dose variations even for a specific CT scan procedures.15–17
When LDRLs in this study compared to those similar studies, the LDRLs values of CTDIvol (mGy) obtained from head CT examination in this study were smaller than those proposed values in Japan, 18 Italy, 19 USA, 20 and UK 21 but it was higher than those proposed values in Egypt 22 and South Africa 11 (Figure 3). The LDRLs for CTDIvol for the head scan established in this study were almost 2 times the CTDIvol values established in Egypt (29 mGy) 22 and South Africa 11 (32 mGy) (Figure 3). The higher value of CTDIvol of this study is due to usage of high kVp (121), mAs (171–400) and scan time of (.6–29sec) (Table 1) as compared with South Africa usage of kVp (120), mAs (30–300) and (.5–.10sec). 11
Likewise, the obtained local DRL value of CTDIvol (mGy) from abdomen pelvis in this study was by 2 folds higher than that of local DRLs in south Africa (7 mGy) due to the usage of high kVp, mAs and scan time on this study (Table 1) 11 as compared with the usage of similar scan parameters in South Africa. Moreover, differences in the training and experiences of radiology technologists may vary from place to place across the continents and this may cause to variations in reference dose. 23
The obtained local DRL value from DLP (mGy.cm) for a routine head examination in this study was much higher than the values developed in South Africa 11 (467 mGy.cm), Australia 24 (880 mGy.cm), and USA 20 (962 mGy.cm) (Figure 3). This great variation may be caused due to larger tube current time product (171–400 mAs), longer scan time (.6–29 sec) and higher scan range (16–52 cm) used in this study.
The local DRLs obtained from DLP for a common chest examination was 575 (mGy.cm). This value was higher by far, compared to other studies proposed values in Egypt 22 388 mGy.cm, Australia 24 390 mGy.cm, Italy 19 453 mGy.cm, USA 20 469 mGy.cm, and Japan 18 550 mGy.cm (Figure 4). This variation was expected due to higher tube potential (80–130 kVp), higher tube current time product (44–250 mAs), longer scan time (.6–17 sec), and higher scan range (29–50 cm) used in this study (Table 2). Again the established local DRL (932 mGy.cm) in this study from DLP of a routine abdominopelvic scan was much higher than those reported values in South Africa 11 386 mGy.cm, Australia 24 600 mGy.cm, Italy 19 733 mGy.cm, UK 21 745 mGy.cm, and USA 20 755 mGy.cm (Figure 4). Basically, the type and model of a CT scanner contributed to dose variations observed due to its impact on filtration, geometry of the beam, number of detector rows, scattered X-ray beams, 25 and number of scan series performed by the operators.26,27 This study has verified the fact that the amount of radiation doses delivered to the patients can be minimized through a combined reduction of tube current time product and tube potential. 28
DRLs in either local or national-based study used to optimize the amount of radiation doses delivered to patients for any CT procedures and medical diagnostic facilities with dose values below the first quartile should pay particular attention to confirm that image quality is professionally accepted. 24 Results of this study showed that practices of CT iamging in both public and private Hospitals in Addis Ababa are partially comparable to other developed countries; even no national DRLs have been established in Ethiopia (Figure 3 and 4).
Moreover, effective dose, a dosimetry quantity useful for comparing health effects, was calculated by multiplying each conversion coefficients of the body region 29 with their corresponding DLP values recorded in this study. Hence, calculated effective doses were 9.8 mSv, 6.2 mSv, and 2.0 mSv for abdominopelvic, chest, and head CT, respectively (Table 2). In this study, effective dose of abdominopelvic (9.8 mSv) and chest (6.2 mSv) was slightly less than the corresponding values ICRP (26, 60, 103) 30 for 120 kv CT examinations. As opposed to this, abdominopelvic effective dose is higher than studies done in Iran. 31 Likewise, the amount of effective dose for patients of head CT was comparable with similar study. 30
Conclusion
Generally, local DRLs in this study were comparable to others similar studies. This study also provides an opportunity to reduce the amount of radiation dose delivered to patients by eliminating the combined tube potential, and tube current time products. Therefore, Ethiopian Radiation Protection Agency should encourage those professionals, upon their continuous development of local DRLs for establishment of future national DRLs.
Footnotes
Acknowledgments
We gratefully acknowledge the financial support of Addis Ababa University and we would like to acknowledge support from the ICTP through the Associates Program (2018–2023). Our gratitude also goes to all the Hospitals that participated in this study and their staff for their cooperation.
Declaration of Conflicting Interests
The author(s) declared no potential conflicts of interest with respect to the research, authorship, and/or publication of this article.
Funding
The author(s) disclosed receipt of the following financial support for the research, authorship, and/or publication of this article: This work was supported by Addis Ababa University, College of Health Sciences.