Fuciarelli TM, Rollo CD. Trans-Generational Impacts of Paternal Irradiation in a Cricket: Damage, Life-History Features and Hormesis in F1 Offspring. Dose-Response. October 2020. doi:10.1177/1559325820983214
The authors wish to notify error in dose-rate calculations for the publication. The correct dose-rate is not 0.25 Gy/min but 0.58 Gy/min. This mistake does not affect the conclusions, but the doses need to be corrected. The doses mentioned throughout the article (2, 4, 7, 10 and 12 Gy) must be replaced with the correct doses (4.6, 9.3, 16.2, 23.2 and 27.8 Gy, respectively). Correct figures are included below.
Figure 1. Dose-response effects of early juvenile radiation on juvenile growth rates of F0 male Acheta domesticus. Values represent the mean growth rate of each group +SEM. Growth rates were calculated by dividing the mass at maturation (mg) by the time taken to reach maturation (days) for each individual male. A one-way ANOVA indicated significant differences between groups F (5, 300) ¼ 86.53, P < .0001, with a Dunnett’s multiple comparison test indicating significant reductions in the 9.3 Gy, 16.2 Gy, 23.2 Gy, and 27.8 Gy groups (P < .0001) compared to nonirradiated males. (A) Dose-response effects of paternal early juvenile radiation on growth rates of F1 Acheta domesticus. A one-way ANOVA indicated significant differences between groups F (3724) ¼ 45.99, P < .0001. A Dunnett’s multiple comparison test indicated significant reductions in the 9.3 Gy (P < .0001), 16.2 Gy (P < .0001), and 23.2 Gy (P < .0017) groups compared to F1 controls (B).
Figure 2. Kaplan-Meier survival curves for F0 populations of male Acheta domesticus. A Gehan-Breslow-Wilcoxon test showed significant differences in survivorship in both 16.2 Gy (P < .0001) and 23.2 Gy (P ¼ .0055) compared to the 0 Gy group (A). Kaplan-Meier survival curves for F1 offspring of F0 irradiated males and non-irradiated females. A Gehan-Breslow-Wilcoxon test, indicating the variation in survivorship curves showed significant differences in 16.2 Gy (P < .0001) and 23.2 Gy (P < .0001) groups compared to the F1 control group (B).
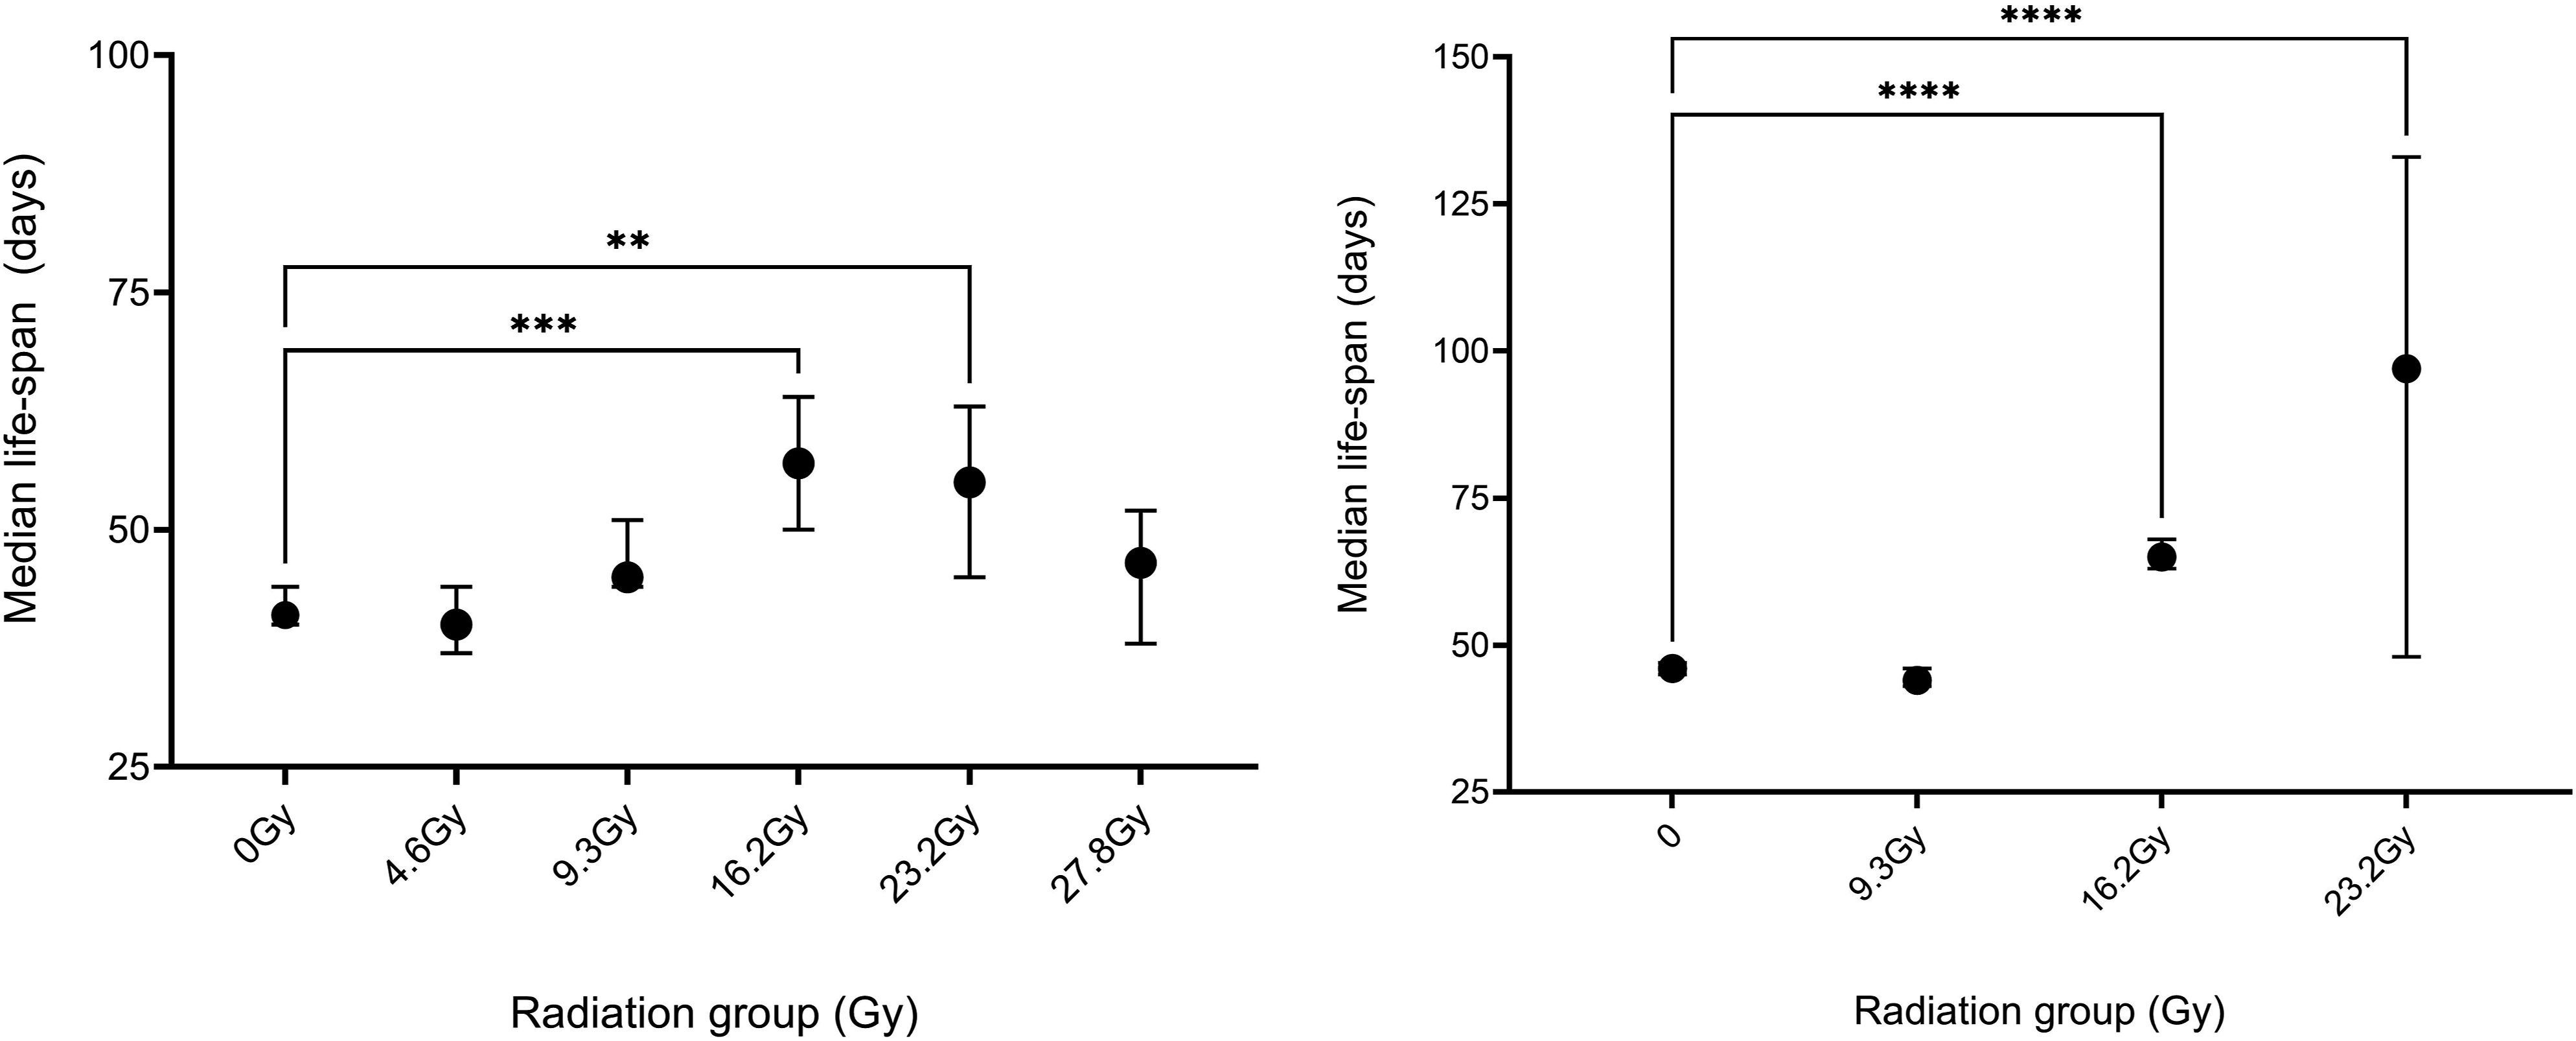
Figure 3. Dose-response effects of early juvenile radiation on longevity of F0 male Acheta domesticus. All values are the median lifespan of each group with 95% CI. A one-way ANOVA indicated significant differences between groups F (5, 711) ¼ 6.242, P < .0001, with a Dunnett’s multiple comparison test indicating significant increases for the 16.2 Gy (P ¼ .0002) and 23.2 Gy (P ¼ .0016) compared to controls (A). Dose-response effects of paternal early juvenile radiation on longevity of F1 offspring. All individuals were offspring of corresponding F0 irradiated males mated with virgin females. A one-way ANOVA indicated significant differences between groups F (3, 1554) ¼ 103.4, P < .0001, with a Dunnett’s multiple comparison test indicating significant increases in median longevity for 16.2 Gy (41.3%) and 23.2 Gy (110.9%) groups (P < .0001) relative to controls (B).