
Abstract
Magnesium oxide (MgO) and manganese oxide (MnO) have been reported to be effective against Diabetes Mellitus (DM). However, their nanoparticulate form has not been evaluated for antidiabetic effect. MgO and MnO nanoparticles (15–35 nm) were synthesized and subsequently characterized by ultraviolet-visible spectroscopy (UV-VIS), zeta sizer, and scanning electron microscopy. 6–7 weeks old rats weighing 200–220 mg were divided into 07 equal groups (n = 8), namely, negative control (NC), positive control (PC), standard control (Std-C), MgO high dose group (MgO-300) and low dose group (MgO-150), and MnO nanoparticle high dose (MnO-30) and low dose group (MnO-15). Diabetes was chemically induced (streptozotocin 60 mg/kg B.W) in all groups except the NC. Animals were given CMD and water was ad libitum. Nanoparticles were supplemented for 30 days after the successful induction of diabetes. Blood and tissue samples were collected after the 30th day of the trial. The mean serum glucose, insulin, and glucagon levels were improved maximally in the MgO-300 group followed by MgO-150 and MnO-30 groups. Whereas the MnO-15 group fails to show any substantial improvement in the levels of glucose, insulin, and glucagon as compared to the positive control group. Interesting the serum triiodothyronine, thyroxine, and thyroid-stimulating hormone levels were markedly improved in all the nanoparticle treatment groups and were found to be similar to the standard control group. These results highlight the modulatory properties of MgO and MnO nanoparticles and merit further studies delineating the molecular mechanisms through which these nanoparticles induce antidiabetic effects.
Introduction
Diabetes mellitus (DM) is a multifaceted metabolic disorder that has manifested itself as an immense challenge for the medical practitioners and research fraternity. Its financial and socioeconomic impact has been exhaustively documented among the various strata of races, nations, and even continents. 1 DM is defined as a chronic metabolic derangement characterized by hyperglycemia and antecedent complications. DM is caused by either one of two mechanisms. First, due to the inadequate ability of pancreatic beta-cells to synthesize or secrete insulin, and second due to the inability of insulin to activate insulin receptors (insulin resistance). 2 The most frequent symptomology of DM is constituted of elevated urination and resultant thirst, decreased visual acuity, lethargic wound healing, deranged immune functions, neurological disorders, nephropathy, and foot ulcers. Mean body weight, pancreatic histology, serum insulin, and glucagon levels are all disturbed in diabetes mellitus. Innovative strategies are urgently required to mitigate the ever-increasing prevalence of DM. Glucose is the major energy source in the human body and its qualitative attributes are disturbed due to DM. Insulin is responsible for an increase in glycogen synthesis, fat synthesis, amino acid uptake, and concomitant decrease in hepatic gluconeogenesis and glycogenolysis. The physiological dynamics of insulin are primarily disturbed in DM.3–6 Recent data have elucidated that DM is intimately related to the qualitative dynamics of carbohydrates and carbohydrate metabolism.7,8 Furthermore, thyroid dysfunction is strongly correlated with DM and the diabetic patient may be screened for the presence of thyroid disorder as thyroid serological markers abnormality is correlated with DM. 9 Hence, any treatment option for DM must be cognizant of correcting thyroid function.
Magnesium is an essential trace element that is required for the sustainment of life and is involved in proper cell membrane functionality, cellular transport of glucose, and activation of enzymes.10,11 More than 300 enzymes and ATP formation are dependent on magnesium. Magnesium is considered beneficial for the treatment of dysregulated insulin, diabetes mellitus, and suppression of inflammatory response. The recommended daily dosage of magnesium is 400–420 mg. The commonly used form of magnesium in human beings is magnesium oxide. Manganese is another essential trace element required for the maintenance of human health. It is a necessary element for the functioning of metalloenzymes, antioxidant activity, immune response, and nervous system.12–14 Daily intake of manganese is around 2.3 mg/day. 15 Manganese oxide (MnO) nanoparticles have been reported to exert cytoprotective effects on ß insulinoma cells. 16 It was also validated that MnO exerted a catalase-like effect and substantially down-regulated oxidative stress and inflammatory processes. 17
Bio-nanotechnology has ushered in an era of new approaches toward disease diagnosis, mitigation, and treatment. Bio-nanotechnology deals with the synthesis and application of nanosized entities with a size range between 1 and 100 nm. These entities are called nanoparticles and their various iterations and include silver, iron, magnesium, and zinc nanoparticles.18,19 Interestingly the nanoparticulate form of an element produces a greater physiological effect in contrast with the microparticulate or bulk form. Nanoparticles are also less prone to deactivation and offer easier and greater absorption properties in the various body and mucus membranes.20,21 Magnesium and manganese and their oxide forms have been explored for their antidiabetic potential; however, the nanoparticle form of magnesium oxide and manganese oxide have not been fully explored for their antidiabetic potential. In addition, the effect of MgO and MnO on thyroid profile has yet to be dissected in detail. An ideal and innovative antidiabetic agent should possess the ability to regulate thyroid functioning and maintain normal thyroid hormone concentrations. Thus, the present study was designed to explore the antidiabetic activity of MgO and MnO nanoparticles in a chemically induced diabetic rat model. The ability of these nanoparticles to positively impact the thyroid profile in the diabetic rat model was also explored in the current study.
Materials and methods
Preparation and Characterization of Nanoparticles
The synthesis of MgO nanoparticles was undertaken by utilizing magnesium nitrate as a primary source together with sodium hydroxide (Sigma Aldrich). First, .2 M magnesium nitrate was set to dissolve in 100 ml double distilled and deionized water. Following this, .5 M NaOH solution was gradually added dropwise into a prepared and standardized magnesium nitrate solution. It was followed by continuous stirring. A white precipitate of magnesium hydroxide was generated in the beaker after five minutes. This was subsequently stirred for 30 minutes. Its pH was evaluated to be 12.5. The precipitate was consequently washed by utilizing methanol 5 times to remove ionic impurities. It was passed through centrifugation at 5000 rpm/min for a maximum of five minutes. Afterward, it was subjected to drying at room temperature and passed through an annealing process at 400 C. 22 Manganese sulfate monohydrate and manganese oxalate salt solution were used at a molar concentration of .01 M for the production of the manganese oxide nanoparticles. These were produced separately and subsequently; these were combined in an equivalent volume ratio. The pH was adjusted at 12 with the addition of NaOH in a dropwise fashion. This was carried out for one hour and the resultant precipitate was calcinated and dried at 500 C for a maximum of 4 hours. 23 Nanoparticle characterization was undertaken by the zeta sizer (Malvern Panalytical, Zetasizer Nano-ZS90), ultraviolet-visible spectroscope (Perkin-Elmer); scanning electron microscope (Nova nano-SEM-450). 24 It was undertaken at the Department of Physics, G.C University Faisalabad (GCUF), Pakistan.
Animals
Sixty male albino Wistar rats aged 6–7 weeks and weighing 200–220 gm were obtained from the Animal Research Station at the Department of Physiology, GCUF. After the approval from the Ethical Review Committee of GCUF, the animal trial was started. The ethical approval number was Ref. No. GCUF/ERC/34. Rats were acclimatized at 250C ± 5 with humidity of 40% ± 5. Chow maintenance diet (CMD) and water were ad libitum. Type 1 DM was induced in the 12-hour fasted rats by employing a single dosage of streptozotocin (STZ) at a dose rate of 60mg/kg body weight. The rats having blood glucose levels of more than 200 mg/dl after 72 hours were considered hyperglycemic and diabetes induction was deemed successful.
Experimental Design
Rats were divided into seven equal groups. Each group was treated with a different dosage regimen for 30 days.
Blood Glucose Evaluation, Insulin, and Glucagon Assessment
The plasma glucose levels were measured by using commercially available glucose strips and a glucometer (Accu-Chek® Instant Blood glucose monitor by Roche). The competitive ELISA was employed for the measurement of the plasma levels of insulin and glucagon. Commercially available ELISA kits were used. Specifically, for insulin detection, the RayBio® Rat Insulin ELISA kit (CODE: ELR-Insulin-1) was utilized with the detection range and sensitivity of 5uIU/mL-300uIU/mL and 5uIU/mL, respectively. For the glucagon measurement Rat GC(Glucagon) ELISA Elabscienes Kit (Cat No.: E-EL-R0425) with a detection range of 62.5–4000pg/mL. The intra-assay and inter-assay coefficient of variance was <10%.
Serum T3, Serum T4, and TSH Assessment
The serological levels of the T3 in the rat serum were observed by utilizing the Lifespan biosciences kit (Cat No.: LS-F10015) with a detection range of .5–8ng/mL and intra-assay and inter-assay percentage coefficient of variance were <15%. The serum thyroxine concentration was observed by utilizing the Lifespan Biosciences Rat T4 ELISA kit (Cat No.: LS-F28089) with the detection range of 10-250 ng/mL and the intra-assay and inter-assay percentage coefficient of variance was <10%. The rat TSH was evaluated by utilizing the Lifespan Biosciences Rat TSH ELISA kit (Cat No.: LS-F5124) with the detection range of 24–15000 pg/mL and the intra-assay and inter-assay coefficient of variance was <12%.
Histopathology and Statistical Analysis
Pancreatic tissue was collected in 4% formalin overnight. Tissue samples were then washed and stored in 70% ethanol. Tissues were routinely embedded in paraffin and were sectioned to obtain in 5 µm thick sections employing a Leica SM 2000R microtome. The tissue sections were deparaffinized and rehydrated in descending ethanol grades and stained with hematoxylin and eosin. After staining the sections were dehydrated and mounted using the mounting medium. The tissue sections were then observed by using a light microscope (Olympus CX43). Images were taken by Optikam B1 Digital Camera. The diameter of the pancreatic islets of Langerhans was measured by ImageJ software. Statistical analysis in the form of ANOVA (IBM® SPSS® software) was undertaken.
Results
Spectrophotometric Analysis of Optimal Nanoparticle Synthesis
Spectroscopic investigation of MgO and MnO nanoparticles revealed MgO having a peak at 295 nm and MnO having a peak at 240 nm. These findings are in agreement with earlier studies.28–30 The Perkin-Elmer lambda-40 spectrometer was employed.
Zeta Sizer Analysis
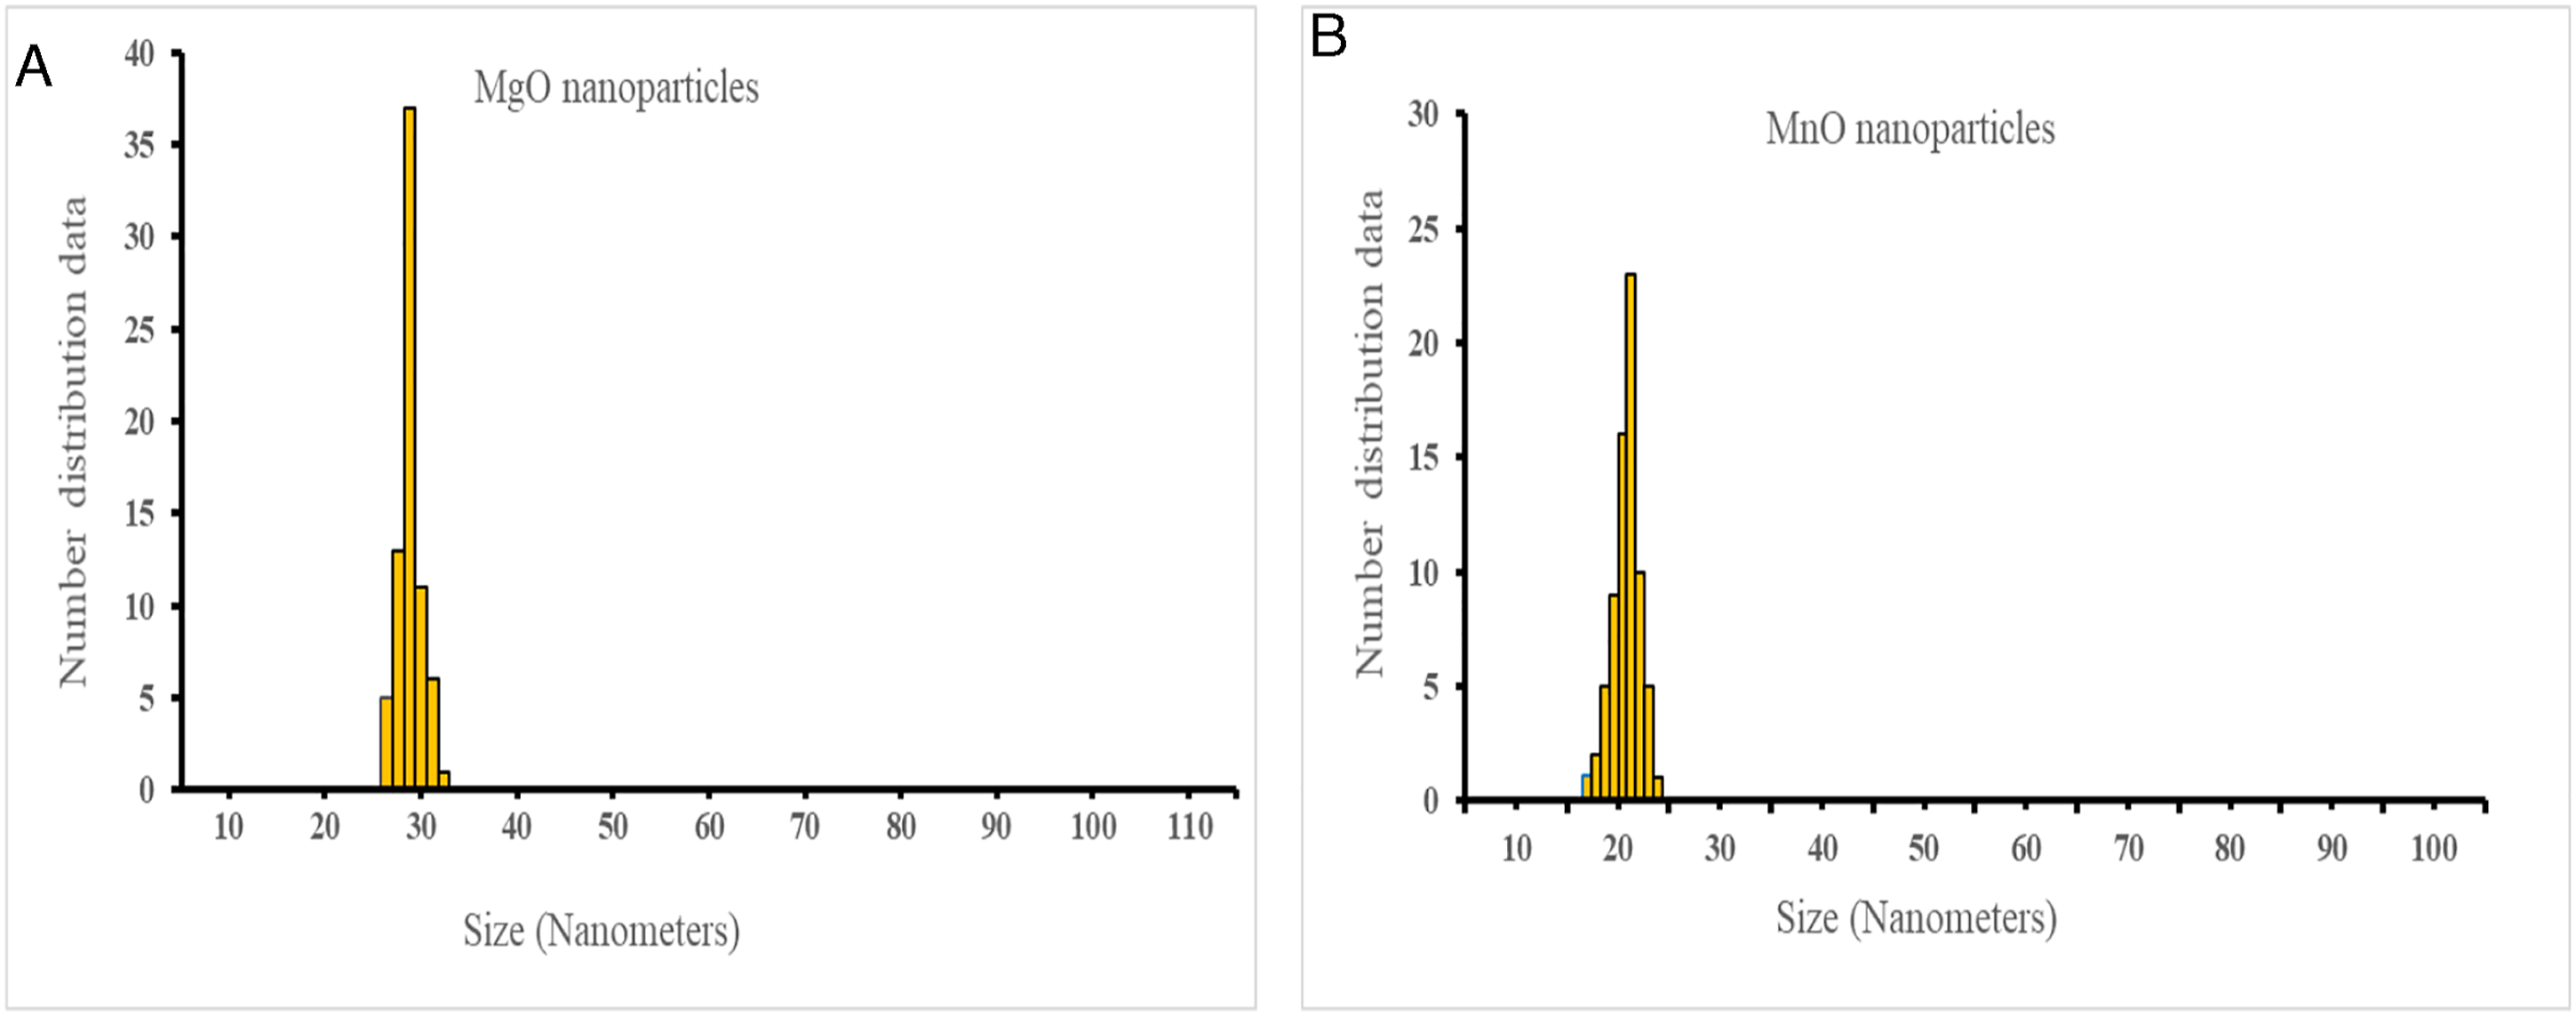
The zeta sizer analysis revealed the formation of MgO nanoparticles in the size range of 25–35 nm and MnO nanoparticles in the range of 15–20 nm (Zeta sizer Nano ZS90; Malvern).
Scanning Electron Microscopy
Scanning electron microscopy (Nova Nano R SEM-450) revealed the formation of MgO nanoparticles in a rhomboid configuration and MnO nanoparticles SEM analysis revealed the formation of spherical and elongated particles.
Mean Body Weight Analysis
Mean body weight in the PC group exhibited a significant decline (P ≤ .05) as compared to the NC group (Figure 4). A significant increase was noted in MgO-300 treatment group as compared to the MgO-150, MnO-15, and Mn30 and StdC treatment groups (P ≤ .05).
Mean Serum Glucose, Insulin, and Glucagon Measurement
The serum glucose levels were found to be significantly (P ≤ .05) high in the PC group as compared to all the other groups on the 28th day of the trial. The initial mild increase observed in the serum glucose levels started to decline from the 7th day onwards in all the treatment groups. The serum glucose levels were quite similar in all the treated groups and were close to the normal serum glucose levels observed in the NC group up till the 28th day of the trial. A non-significant difference exists between the serum glucose levels in MnO and MgO treatment groups where the MgO-300 treated group illustrated maximum antihyperglycemic activity. (Figure 1A; P ≤ .05). Serum insulin levels were significantly decreased in the PC (6 µIU/ml) as opposed to the NC (16 µIU/ml) group (P ≤ .05). The metformin elicited a net increase in insulin levels in the standard group (P ≤ .05). The MgO-150 (14 µIU/ml) and MgO-300 (16 µIU/ml) groups exhibited a higher insulin level as contrasted with PC (6 µIU/ml), MnO-15 (9 µIU/ml), and MnO-30(11µIU/ml) groups. Similarly, the serum concentration of glucagon was affected dose-dependently in treatment groups (P ≤ .05) (A) Mean serum glucose levels in different treatment groups observed at 7-day intervals. Note the steady levels of serum glucose observed in the NC group as compared to the significantly high levels ((P > .05, *) in the PC group. The progressive decline in the serum glucose levels after the 7th day in the MgO, MnO and StdC groups is also notable. B) Mean serum insulin levels in different treatment groups. Note the similar levels of insulin in the NC, StdC and MgO-300 groups. A dose-dependent increase in the mean serum insulin levels is also visible in MnO and MgO treatment groups. Different superscripts on the bars represent statistical significance (P ≤ .05). (C) Mean serum glucagon levels in different treatment groups. MgO-300 treatment group exhibits glucagon levels similar to the NC group. A dose-dependent decline in glucagon levels is also visible in MnO and MgO treatment groups. Different superscripts on the bars represent statistical significance.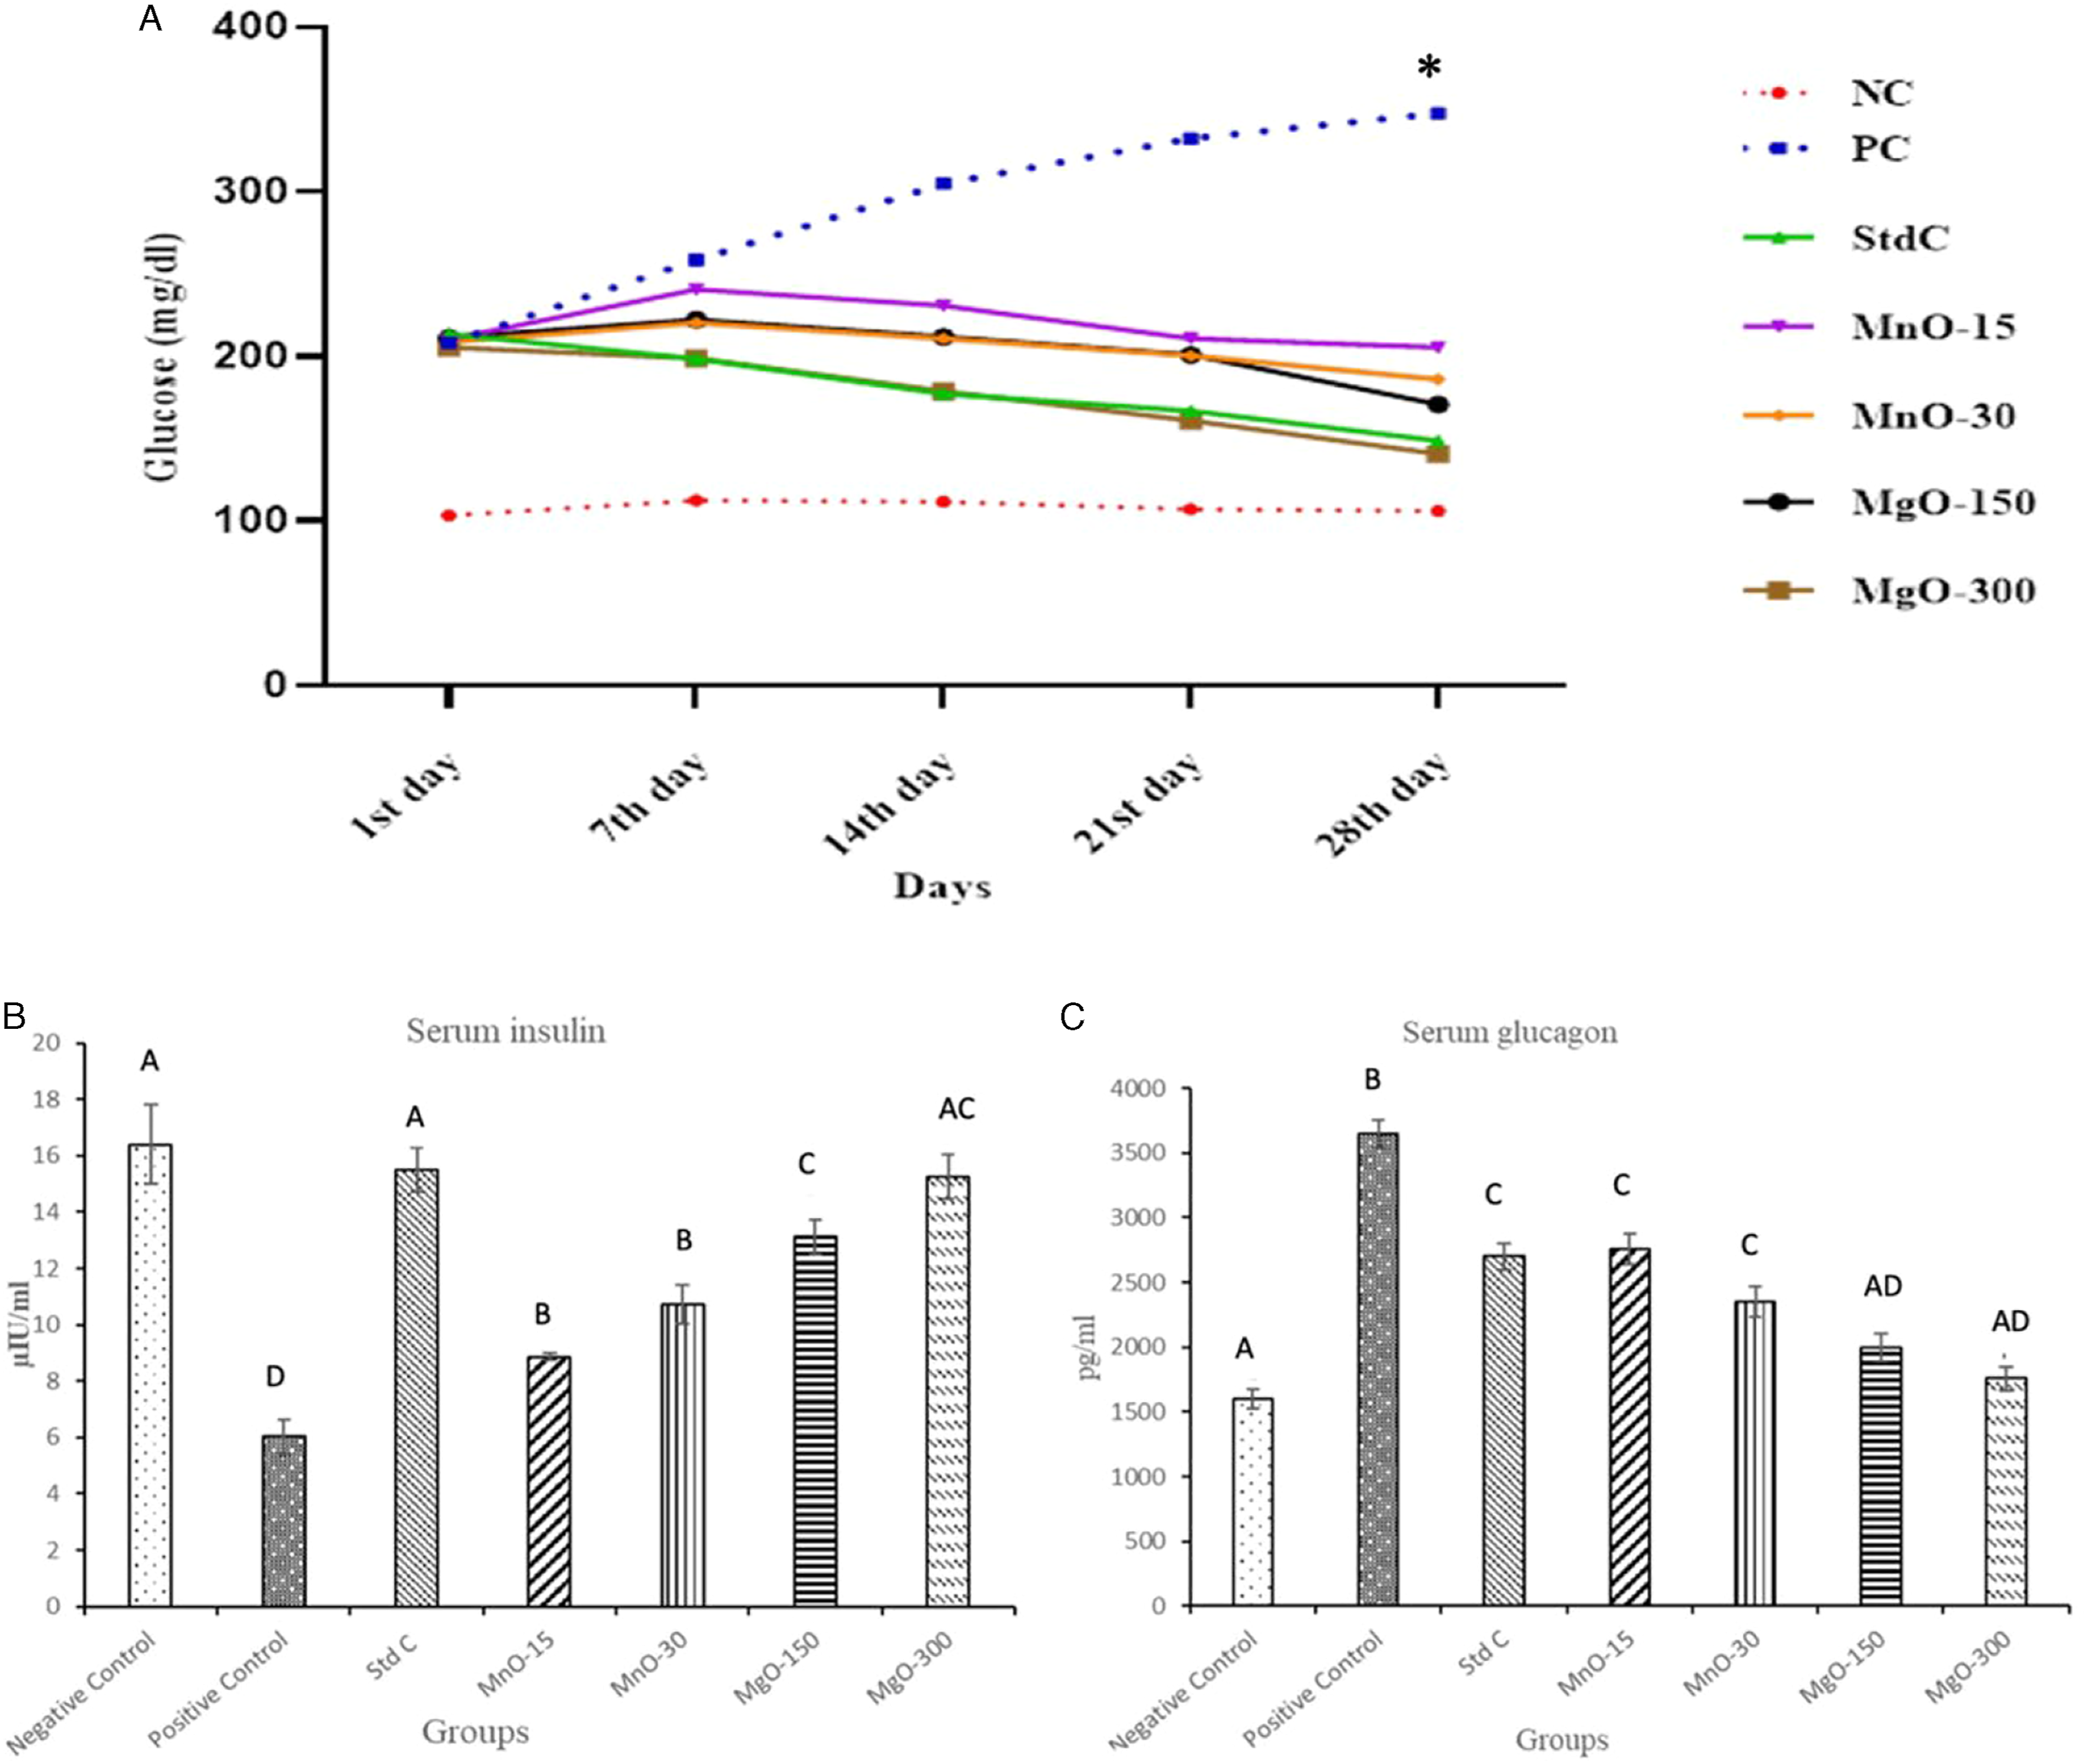
Thyroid Profile
Mean serum T3 levels revealed a significant variation among the PC group and the treatment groups (P ≤ .05) (Figure 2A). The T3 was also significantly reduced in the PC group as compared to the NC group (P ≤ .05). Interestingly the T3 levels were found to be similar in nanoparticle treatment groups. The MgO-300 group had the most significant improvement in T3 (6.2 ng/ml; P ≤ .05) proceeded by MgO-150 and MnO-30, respectively. Serum thyroxine (T4) concentrations exhibited a similar trend where the positive control group had significantly low levels of T4 as compared to the NC and treatment groups (Figure 2B). Serum TSH levels were also significantly reduced in the PC group as compared to the NC and treatment group (Figure 2C; P ≤ .05). Interestingly the dose-dependent effect of the MgO and MnO nanoparticle was not observed and a similar level of T3 and TSH were observed in all the treatment groups. (A) Mean serum levels of T3 in different treatment groups. Similar mean serum levels of T3 were observed in the StdC, MgO-150, and MgO-300 treatment groups. A slight dose-dependent effect is also visible in treatment groups but it is not statistically significant. Different superscripts on the bars represent statistical significance. (B) Mean serum TSH levels in different treatment groups. Mean T3 levels observed in treatment groups were similar to the StdC group levels. A slight and statistically non-significant dose-dependent response was observed in treatment groups. Different superscripts on the bars represent statistical significance. (C) Mean serum levels in different groups of rats. Similar levels of TSH were observed in the StdC and treatment groups. Different superscripts on the bars represent statistical significance.
Pancreatic Histology
The representative photomicrographs of the islets of the Langerhans in the different treatment groups are presented (Figure 3A and B). The diameter of the islet of Langerhans is decreased in the positive control (62 um) as compared to the negative control group (155 um). The most noticeable increase in the diameter of the islet of Langerhans size was observed in the MgO-300 group that exhibited a size like that of NC (152um; fig 7.1 G). Representative photomicrographs of the islets of Langerhans of rats from different treatment groups. Negative control (A), Positive control (B), Std-C (C), Mgo-300 (D), MgO-150(E), MnO-30 (F), and MnO-15 (G). ±Mean body weight in different treatment groups. A significant (P>.05, *) decline in body weight was observed in PC group as compared to the NC group on the 30th day. The MgO-300 treatment group illustrated a significant (P≤.05, *) increase in body weight on the 30th day as compared to all other treatment groups including StdC.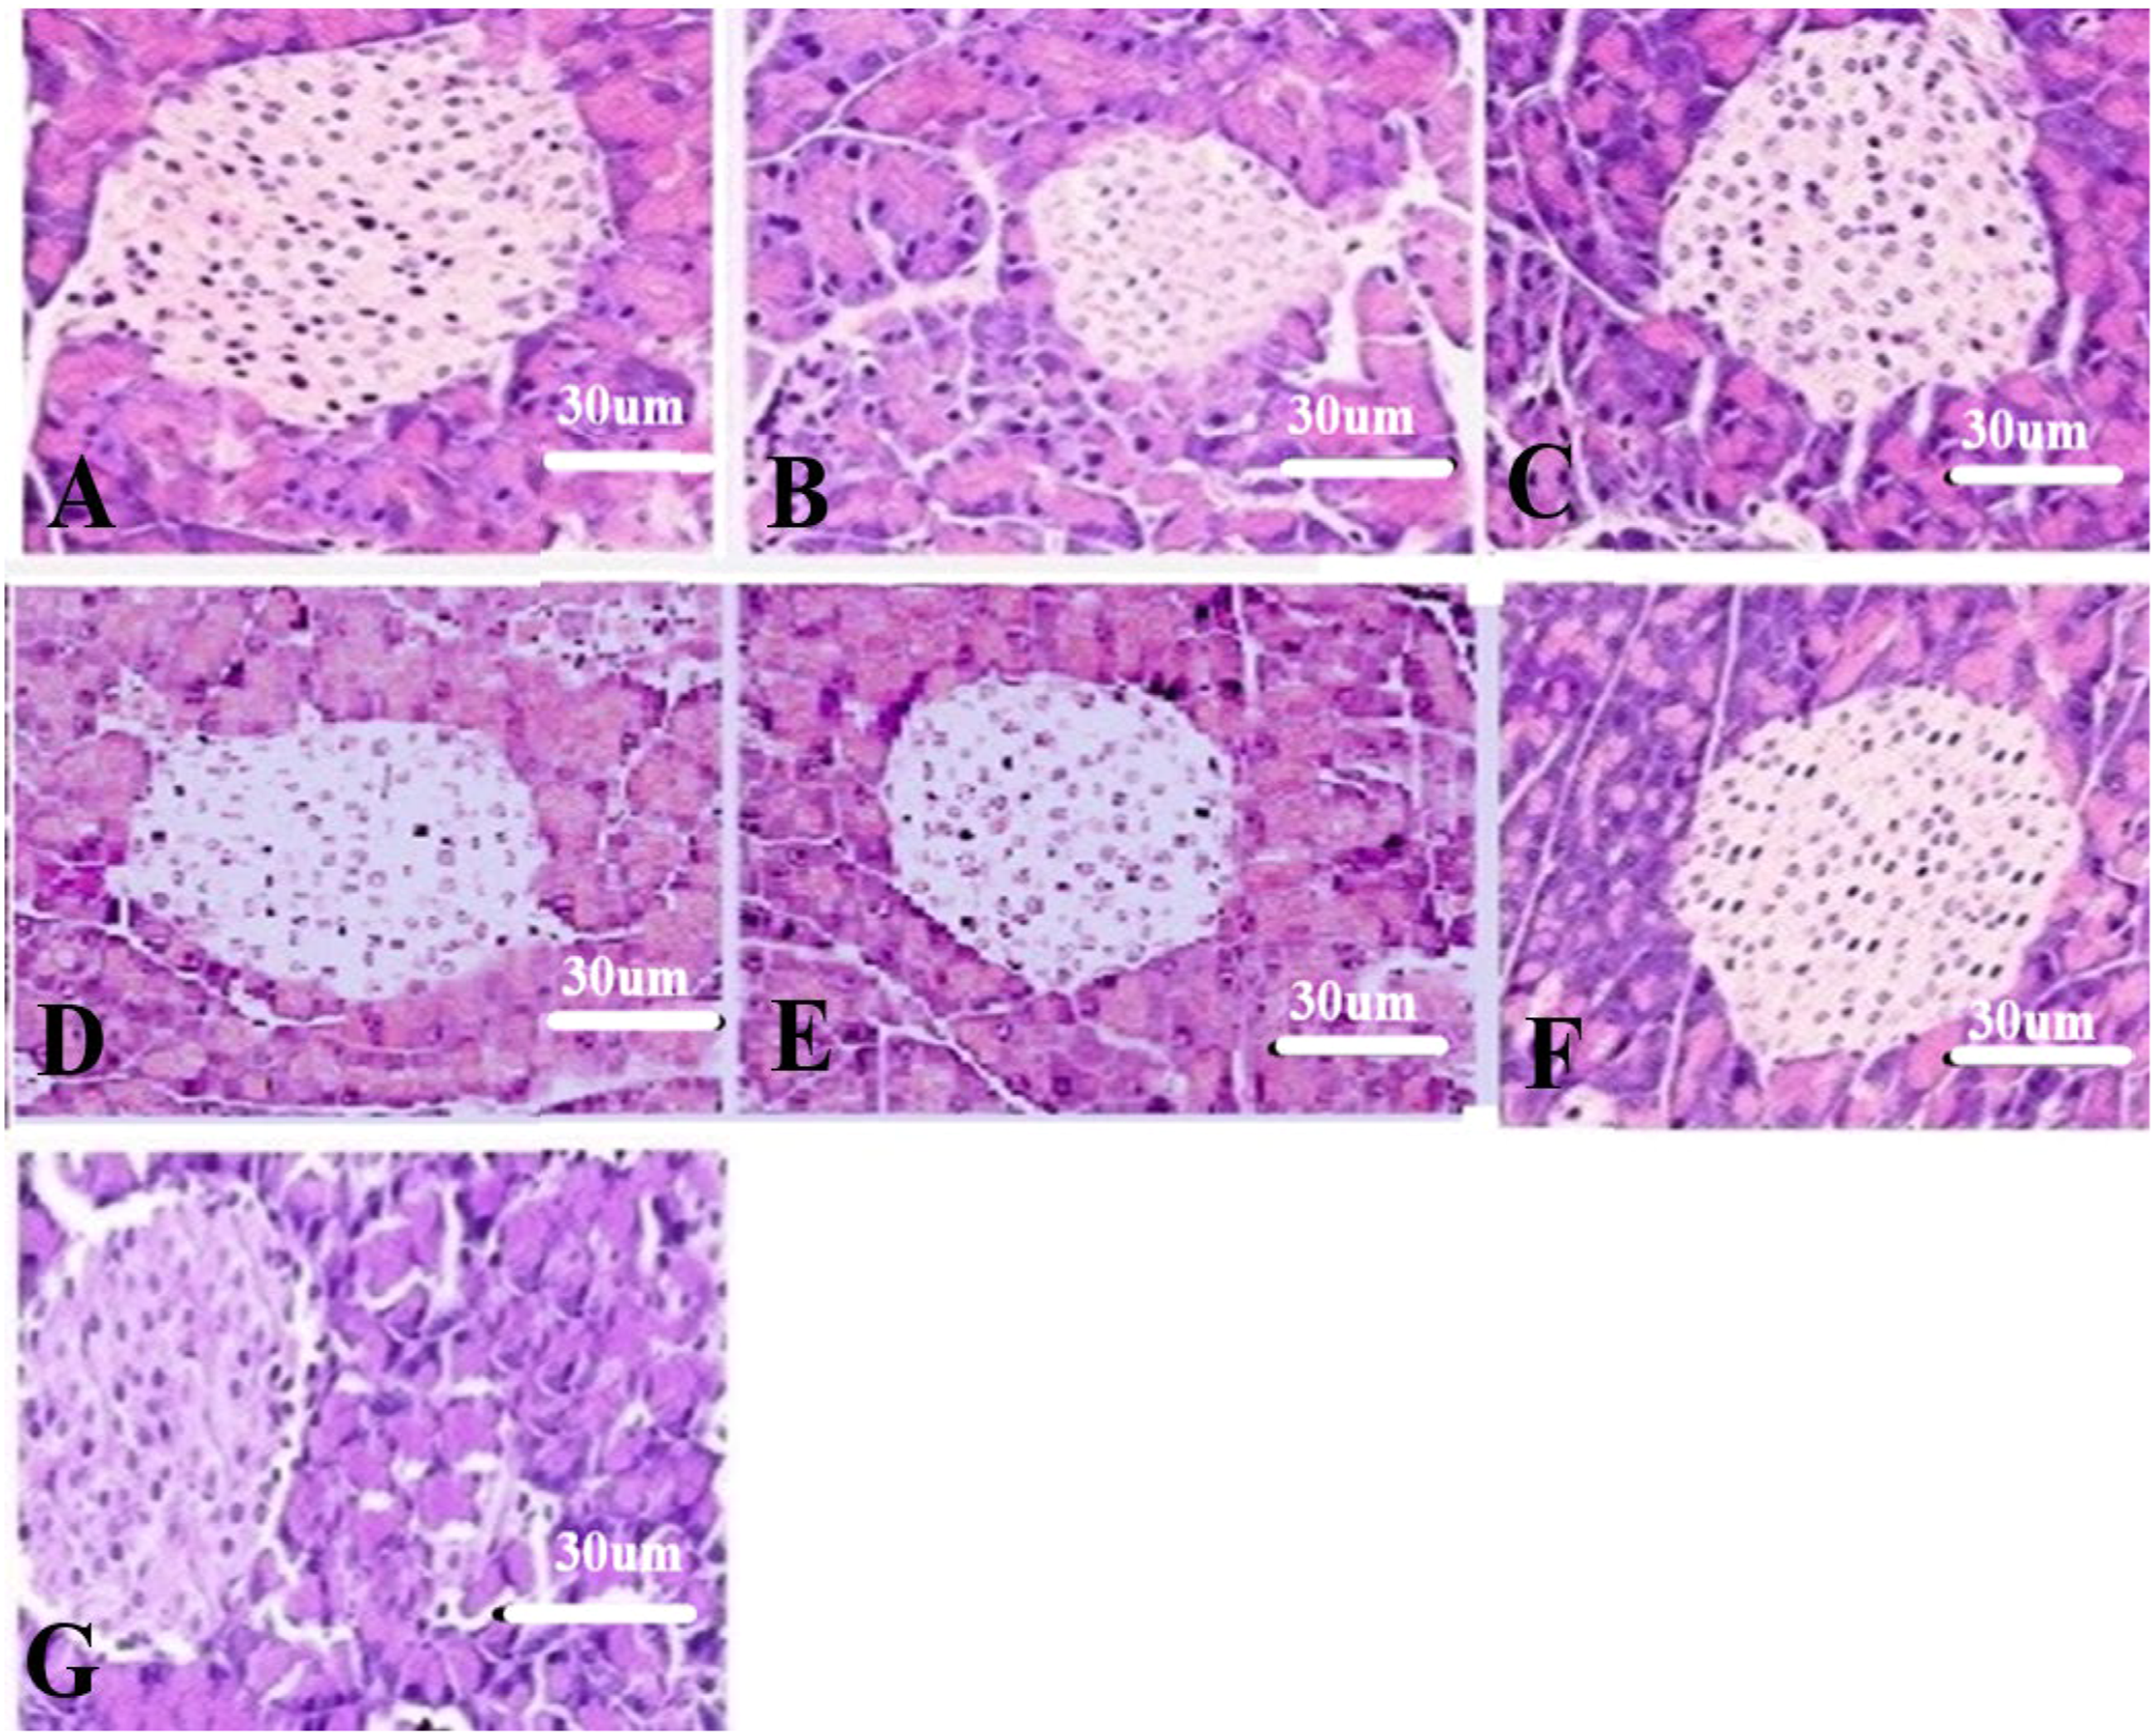

Discussion
The present research unambiguously showcased that the chemical method is efficient, cost-effective, reproducible, and ideal for the rapid synthesis of MgO and MnO nanoparticles. The qualitative assessment of the nanoparticles by SEM (Figure 5), zeta sizer (Figure 6), and UV-Vis (Figure 7) attested to the high quality and optimal yield. Our findings are in agreement with previously published works.16,22,23,30,31 In our assessment, the chemical method provides a unique opportunity to fine-tune the size and shape of the nanoparticles by varying the quantity and reactivity dynamics of the initial reactants. This phenomenon of absolute control over the qualitative aspects of the initial reactants also explains the high quality and optimal yield of the said nanoparticles that were synthesized. The chemical method is cost-effective owing to the easy availability and low cost of the initial reactants, that is, magnesium nitrate, sodium hydroxide, and manganese sulfate. Scanning electron microscopic analysis of MgO (A) and MnO nanoparticles (B). Zeta sizer analysis of MgO (A) and MnO (B) nanoparticles. Spectrophotometric analysis of MgO (A) and MnO (B) nanoparticles.

The present research elucidated a relationship between the diabetic status, body weight changes, and employment of selected nanoparticles. The PC group showed a measurable reduction (188 ± 6.1 gm) in body weight as opposed to the negative control (238.7 ± 7.8 gm) and this assessment is in agreement with previously published works. 32 Significant weight normalization and subsequent gain were observed in the MgO-300 (231.5 ± 7.1 gm) group followed by the MgO-150 (219.5 ± 5.9 gm) as contrasted with the positive control (P ≤ .05). These observations are congruent with those of Burlet and Jain. 33 However, the exact molecular and mechanistic dimensions of this change need further exploration, whether these changes are due to increased protein and lipid synthesis or some other causal link exists between the selected nanoparticles and weight gain.
A statistically significant change in the hyperglycemic effect was noted in the MgO-300 group as contrasted with the PC at various days and it was most noticeable at the end of the experiment, that is, 290.4 ± 15.2 mg/dl for the PC as contrasted with the MgO-300 group 176.7 ± 12.0 mg/dl (P ≤ .05). These observations were followed by the effect of the MgO-150 group (203.3 ± 12.3 mg/dl). The findings are in agreement with earlier reports that detailed that optimal magnesium and manganese supplementation can reduce hyperglycemia.34,35 Various treatment groups showed a statistically significant difference in the serum insulin and glucagon concentration (P ≤ .05). MgO-300 group appropriated the greatest increase in the insulin levels (15.25 ± 1.8 µIU/ml) as compared and contrasted with the positive control (6.02 ± .63 µIU/ml; P ≤ .05). Similarly, the MgO-300 group produced a significant effect on serum glucagon levels. It was subsequently followed by the MgO-150 and MnO-30 groups, that is,1760 ± 90 pg/ml for MgO-300 as contrasted with the positive control, that is, 3650 ± 110.2 pg/ml. Several investigations posit that magnesium supplementation is correlated with an increase in the GLUT-2 and insulin mRNA expression in rats supplemented with magnesium.34–36 Recent studies have revealed that magnesium supplementation has a positive effect on insulin receptor activity and its sensitivity. Magnesium supplementation also upregulates the insulin receptor expression and suppresses insulin resistance in a rat model. Reduced manganese levels can plausibly correlate with hypoinsulinemia and lead to diabetic manifestation.36–38 Serum magnesium levels are intimately correlated with various endocrinopathies including T1DM and T2DM. Both diabetic types have been associated with hypomagnesemia and decreased serum magnesium levels within the parenchymatous and other tissues. 39 The causal dynamics of hypomagnesemia include osmotic diuresis that elicits increased renal excretion of magnesium coupled with insulin insensitivity that causes dysregulation of the intracellular magnesium transport and manifests as increased magnesium losses from the body. In addition, nephropathy as evidenced routinely in DM elicits reduced magnesium reabsorption and increased magnesium loss. 40 Furthermore, persistent magnesium deficiency is causally linked with increased levels of tumor necrosis factor-alpha (TNF-α), which consequently, is a contributory factor for the post-receptor insulin resistance.41,42 Hence, it can be gleaned from the above discussion that magnesium supplementation in a diabetic model or patient can have direct and manifestly qualifiable and quantifiable effects to offset the above-mentioned pathophysiology, reset magnesium homeostasis, replenish lost magnesium stores, and protect the cellular and parenchymatous tissue against the effects of diabetes mellitus. Our results, within the context of magnesium supplementation, in the form of MgO nanoparticles, show such effects and stress the need for further mechanistic exploration of how magnesium supplementation translates into protection against DM.
One of the important pathophysiological manifestations of DM is mitochondrial dysfunction and the resultant oxidative stress that accompanies it. In this context, manganese superoxide dismutase (MnSOD) is an enzyme that offers antioxidant protection. 43 In diabetic syndrome, the serum and cellular concentration of MnSOD are decreased which result in exacerbating the pathological footprint of DM. It has been previously shown that manganese supplementation is correlated with the increased concentration and activity of MnSOD. In addition, it has been observed that manganese supplementation also elicits improved glucose tolerance. Furthermore, a recent investigation elucidated that isolated pancreatic islets from manganese supplemented animal models had improved insulin secretion, decreased lipid peroxidation, and a robust mitochondrial function profile. 44 Our investigation supports these findings and we report that nanoparticulate manganese supplementation can augment the defense against DM. However, further work is required to elucidate the exact mechanistic underpinnings. Research, within the context of MgO and MnO supplementation and glucagon levels, is insufficient to draw any tentative conclusion or come to a plausible mechanistic picture explaining the currently observed phenomena.
Magnesium is considered an essential element for the conversion of T4 (inactive thyroid hormone) into the active thyroid hormone T3. In the absence of this process, cells are unable to receive the appropriate bioactive form of thyroid hormone. Hence, hypomagnesemia leads to improper functioning of the thyroid gland and leads to hypothyroidism. 45 In addition, DM has been associated with causing abnormalities in thyroid hormone homeostasis. Thyroid disorders and DM are intimately related. 46 Present work elucidates that MgO and MnO nanoparticle supplementation had a significant effect on thyroid profile and caused a substantial improvement and normalization in the serum thyroid concentrations. Our research tentatively established that magnesium supplementation significantly improved thyroid profile and associated DM-related parameters. The primary reason is that magnesium supplementation has been associated with upregulating the T4 conversion into T3. Also, magnesium plays a central role as an enzyme and co-factor in various metabolic pathways. Furthermore, Magnesium supplementation has been shown to regulate and reset the disturbed thyroid concentrations. 47 Hypomagnesemia has been associated with hypothyroidism, increased antithyroglobulin antibody production, etc. In this context, magnesium supplementation is highly effective to correct thyroid hormone dysregulation as shown by Wang et al. 45 We posit that magnesium nanoparticle supplementation can offer dose-dependent protection against hypothyroidism and thyroid dysfunction. Present work elucidates that MgO nanoparticles can potentially be an ideal alternative for the bulk form of magnesium as a supplement for re-establishing the homeostatic concentration of thyroid hormone and controlling DM. Low manganese levels are associated with abnormalities in T3 and T4 in animal models. MnO supplementation is related to the normalization of the thyroid hormone profile. 48 The present study lends support to the previous investigations as MnO nanoparticles had a dose-dependent normalizing effect on the thyroid hormone profile. In addition, the causal link between manganese and thyroid function remains to be fully dissected. Nevertheless, recent research has posited that manganese has a substantial effect on the dopamine concentrations in the central nervous system and this phenomenon, in turn, can affect thyroid function, and T3 and T4 concentrations. However, greater work needs to be done to fully explore the causal and mechanistic relationship between the manganese oxide nanoparticle supplementation and thyroid profile.
The changes in the pancreatic histology were noticeable but mostly in terms of overall size. Magnesium supplementation has been associated with safeguarding the pancreatic parenchymatous tissue. Magnesium administration elicits a decrease in pancreatic edema, tissue necrosis, and pancreatic inflammation, along with downregulating the protease activation. Magnesium also antagonizes the various inflammatory pathways. Nutritional magnesium deficiency has been shown to cause increased susceptibility to pancreatitis. 49 In terms of morphological size, the PC had the smallest islet of Langerhans, and the NC and MgO-300 had the most pronounced improvement in size. Nanoparticle magnesium supplementation offered protection against the destruction of pancreatic cells and overall safeguarded the number of β-cells as well as the overall size of the islet of Langerhans. Hence, the present research offers credence to the previously mentioned research. In a research investigation by Lee et al., 44 it was revealed that manganese supplementation safeguarded the pancreatic β-cells' parenchyma, upregulated insulin secretion, reduced lipid peroxidation, and improved the mitochondrial functioning along with augmenting MnSOD activity. Our study supports these findings as the pancreatic histology shows a quantifiable improvement in islet size in MnO-15 and MnO-30 groups as compared with the positive control. This improvement is probably a direct result of MnSOD activity and the cellular protective ability of manganese nanoparticle supplementation.
Conclusion
The utilization of chemically synthesized MgO and MnO nanoparticles for the amelioration of DM and the appropriation of thyroid profile is a promising first step. Further work is required to assess the causal relationships, mechanistic dynamics, and cellular and genetic alterations underlying the observed findings. The present study serves as the first step for future research.
Footnotes
Acknowledgments
The authors would extend their appreciation to all the other faculty members who assisted with the present research.
Declaration of Conflicting Interests
The author(s) declared no potential conflicts of interest with respect to the research, authorship, and/or publication of this article.
Funding
The author(s) received no financial support for the research, authorship, and/or publication of this article.