
Abstract
Objectives:
In the present study, we introduced a practical approach to quantify organ-specific radiation doses and investigated whether low-dose head circumference (HC)-based protocols for non-enhanced head computed tomography (CT) could reduce organs-specific radiation dose in pediatric patients while maintaining high image quality.
Methods:
A total of 83 pediatric patients were prospectively recruited. Without limits to the HC, 15 patients were selected as a convention group (CON group) and underwent non-enhanced head CT scan with standard-dose protocols (tube current-time products of 250mAs). Low-dose group (LD group), including remaining 68 pediatrics were divided into 3 subgroups based on the HC: 54.1-57.0 cm for LD200mAs group (HC-based protocols of 200mAs), 51.1-54.0 cm for LD150mAs group (HC-based protocols of 150mAs), 48.1-51.0 cm for LD100mAs group (HC-based protocols of 100mAs). Subjective and objective image quality was evaluated and measured by 2 experienced radiologists. Radimetrics was used to calculate organs-specific radiation dose, including the brain, eye lenses, and salivary glands.
Results:
In CON250mAs group, radiation doses in the brain and salivary glands were conversely correlated with HC, and pediatric patients with smaller HC received higher organs-specific radiation dose. Reducing tube current-time product from 250 to 100mAs could significantly reduce the organ-specific radiation dose. The subjective image quality score ≥ 3.0 is acceptable for diagnosis purposes. The signal to noise ratio (SNR) and the contrast to noise ratio (CNR) of bilateral thalamus and centrum semiovale in 3 LD subgroups were not statistically different compared with the CON group.
Conclusion:
Our research indicated that low-dose HC-based protocols of non-enhanced head CT scan can evidently reduce the organ-specific radiation doses, while maintaining high image quality. HC can serve as a vital tool to guide personalized low-dose head CT scan for pediatric patients.
Keywords
Introduction
Non-enhanced head CT examinations have become a routine clinical examination in neurosurgery, neurology, and emergency department. Although non-enhanced head CT examinations are a user-friendly diagnostic approach with high diagnostic value for the patient and the physician, it is also a major contributor to collective radiation dose in daily diagnostic radiology practice. 1 -4 Thus, the increasing use of head CT scans raises the concern of the possibly negative impact of ionizing radiation exposure on health. 4 Although CT represents only 11% of radiologic examination, it accounts for as much as 70% of the total radiation dose from all diagnostic radiologic studies. 5-6 The largest increases in CT scans have been in the categories of pediatric diagnosis. 4 Various studies have shown that the slightest exposure to irradiation in childhood is associated with a quantifiable risk of developing a tumor in old age. Moreover, this risk dramatically decreases with increasing age, especially during the first year of life. Pediatric patients are in the growth stage; the speed and proportion of their cell division and renewal are much faster than in adults; therefore, they are more sensitive to radiation exposure. 4,7,8 Receiving the same radiation doses, pediatric patients have a higher risk of radiation exposure injury than adults. Also, their lifetime risk of cancer is much higher than in adults. 4,9 -12 Thus, reducing radiation doses for pediatric head CT scan under optimal image quality has gained increasing research interest. 13,14 Unfortunately, CT dose index (CTDI) is not a direct estimate of absorbed radiation doses, thus cannot be directly related to the risk. 15 However, the cancer risk, which is related to the radiation exposure, may be estimated by the organ-specific radiation doses from CT scan.
A personalized non-enhanced head CT examination is required for pediatric patients in clinical practice; however, an effective tool or biomarker to guide the low-dose head CT protocol has not yet been established. 16-17 In this study, we used head circumference (HC) as an index to determine the tube current-time product of the head CT scan. The specific organs including the brain, eye lenses, and salivary glands, were employed to evaluate the radiation exposure. The image quality was assessed by measure signal to noise ratio and contrast to noise ratio on the same workstation. Also, 2 experienced neuro-radiologists visually rated scores of image quality according to sharpness, diagnostic acceptability, and artifacts.
Materials and Methods
Participants
During a 7-month period from February to September 2019, pediatric patients from neurosurgery, neurology, and emergency departments were prospectively recommended to undergo a non-enhanced head CT scan for various clinical symptoms, such as headache, dizziness, nausea and trauma,. Finally, 83 patients are recruited in our study. Without limitations to the HC, 15 pediatric patients were selected as the conventional group (CON group) by random number method, with the HC ranging from 48.1-59.2 cm (53.75 ± 3.14 cm). The other 68 patients were separated into 3 low-dose group (LD group) based on the HC: LD200mAs group, 54.1-57.0 cm, (56.00 ± 0.24 cm); LD150mAs group, 51.1-54.0 cm, (52.98 ± 0.20 cm); LD100mAs group, 48.1-51.0 cm, (49.54 ± 0.23 cm).
This research was approved by the ethics committee of the First Hospital of Jilin University (date of approval: February 1, 2019), and written informed consent was provided by every participant prior to the start of this study.
Scanning Protocol
All subject’s non-enhanced head CT scans were performed with a 64-slice multisection spiral computed tomography (MSCT) scanner (Light Speed, GE Healthcare, USA) in the axial plane with the patient in the supine position. The tube current-time product of standard-dose head CT was set to 250mAs for the CON250mAs group. The tube current-time product corresponding to the 3 HC-based protocols of 200, 150, 100mAs were set for LD200mAs, LD150mAs, and LD100mAs group, respectively. The following remaining scanning parameters were the same for CON group and LD group: tube voltage of 120kVp, slice thickness of 5 mm, 0.45 mm interval, 360 ms rotation time, image matrix of 512 × 512 pixels, pixel spacing of 0.44 × 0.44 mm2 and a field of view of 38 mm × 38 mm.
Subjective Evaluation of Image Quality
Subjective image quality analysis was independently performed by 2 neuroradiologists with 8 and 20 years’ experience. The neuroradiologists were blinded to each other’s scanner, scan parameters, slice thickness, and the scoring. Images were displayed using a fixed brain window setting (window width, 80Hu; window level, 40Hu). In the subject image quality assessment (1) severity of background noise, (2) severity of imaging artifacts, and (3) clarity of demonstration of lesions and anatomical structure were taken into account. 18,19 Five grades were designed to each factor, with 5 representing the best quality (Table 1). The scores from the 3 domains determined by the 2 neuroradiologists were then averaged to generate an overall score for image quality. An image quality score ≥ 3 was considered as a qualified image for the diagnostic demand.
Grading Scale of Subjective Images Quality Score.

Objective Evaluation of Image Quality
All non-enhanced head CT images were viewed on a GE workstation ADW4.4 and a dedicated PACS workstation in our department. A neuroradiologist with 8 years’ experience who were blinded to the patients’ clinical information and scan protocols placed four 3 to 5mm2 regions of interest (ROIs) as follows: right thalamus (ROI1) and light thalamus (ROI2); right centrum semiovale (ROI3) and light centrum semiovale (ROI4). Then, average for both ROI1/ROI2 and ROI3/ROI4 were calculated. Quality of image was evaluated via mean CT density measured in Hounsfield units (HU). The standard deviation (SD) of mean CT density was used to measure the noise. The signal to noise ratio (SNR) for ROI1/ROI2 and ROI3/ROI4 were calculated using the formula SNR = HU/SD. The contrast to noise ratio (CNR) was calculated using the formula CNR = (HUROI1/ROI2 − HUROI3/ROI4) / ([SDROI1/ROI2 + SDROI3/ROI4]/2). 20 The representative images and sample measurements are shown in Figure 1.
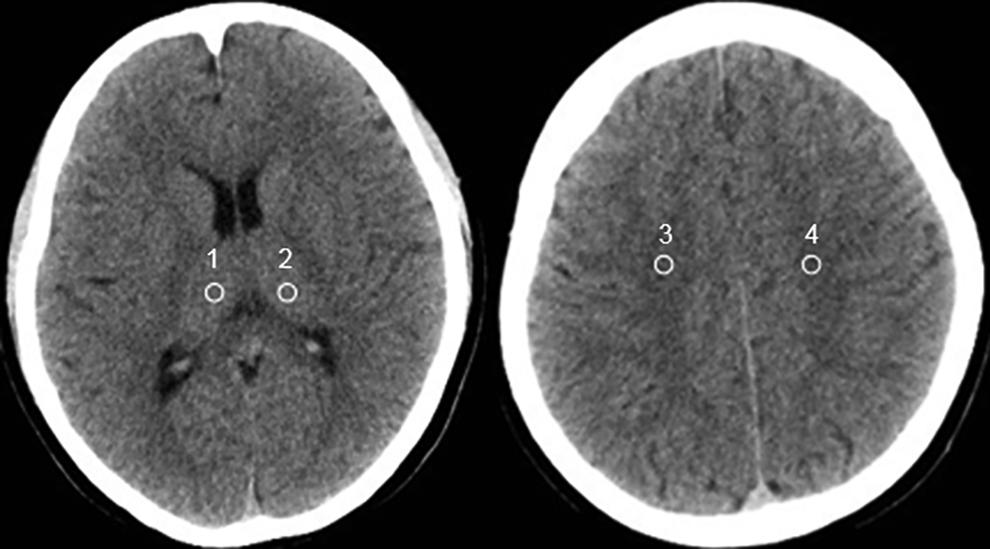
Sites of ROIs for analysis of image quality. An example of uncontrast head CT image with standard-dose protocols (250mAs). ROIs included the right thalamus (ROI1) and light thalamus (ROI2); right centrum semiovale (ROI3) and light centrum semiovale (ROI4). ROI, regions of interest. CT, computed tomography.
Organ-Specific Radiation Doses Estimation
Organs-specific (brain, eye lenses, and salivary glands) radiation doses data from MSCT examinations were collected and downloaded from Radimetrics Enterprise Platform (REP, Bayer HealthCare, Whippany, New Jersey, USA) for analysis, which was based on Monte-Carlo-Simulation used to analyze the effective radiation doses of specific organs. 16,17 The total organ dose was first calculated for each slice using the CTDIvoli at that slice and then was summed over all slices into the scan region:

where coeff is the ratio of the simulated organ to the simulated CTDIvol as described above, and i indicates slice specific values.
Statistical Analyses
All data were analyzed using SPSS software (Version 22; IBM, New York, USA). An initial analysis was performed using the Anderson–Darling test to evaluate whether the data were normally distributed. One-way analysis of variance (ANOVA) test was used to compare the difference in organ-specific radiation dose and image quality score in CON and LD groups. When the difference was significant, the Tukey-Kramer post hoc analysis was conducted to assess the difference among different groups. Wilcoxon rank-sum test was used for non-normal distribution. Spearman’s rank correlation coefficient was used to assess the correlation between HC and organ-specific radiation dose in the CON group. The consistency of the analysis results of 2 radiologists was checked by Kappa-test. The K value > 0.6 was good, 0.4 ≤ K value ≤ 0.6 was moderate, and the K value 0.4<was poor. P < 0.05 was considered as statistically significant.
Results
Patient Groups
A total of 83 patients were enrolled in our study. Eight pediatric patients were excluded due to excessive motion. Table 2 lists the characteristics of the patients included in the study. The mean age was 8.69 ± 4.84 years (range, 1 to 18 years). The patients’ HC ranged from 48.1 to 59.2 cm. The most common indications were head trauma, headache, and dizziness.
Demographic Characteristics of All Pediatric Patients.

* Multiple syptoms were reported by some patients; Numbers in parentheses are percentages. Percentages were rounded.
Confirmation of Radiation Overdose in CON Group
The standard-dose protocol (tube current time products of 250mAs) of non-enhanced head CT in CON group was set to ensure the image quality meets the clinical requirement. First, we aimed to identify how much radiation dose pediatric patients with various HC received from standard-dose non-enhanced head CT scan. We further investigated if the radiation dose was related to the HC. In Figure 2, we plotted the radiation dose v.s the HC in CON group. The brain radiation dose had a negative linear correlation with the HC (R2 = 0.565). F-test showed that the HC has a significant impact on the brain radiation dose (P = .00124, F = 16.9, Degree of freedom [DOF] = 13, Figure 2A). The salivary glands also showed a negative linear correlation with the HC (R2 = 0.268, P = .048, Figure 2C). On the other hand, the radiation dose of the eye lenses was not linearly correlated with the HC (R2 = 0.096, P = .26, Figure 2B), although the radiation dose seemed to decrease for larger HC. Our data indicated that pediatric patients with smaller HC received more radiation dose than larger HC. A personalized non-enhanced head CT scan considering low-dose HC-based protocol may help reduce the radiation exposure.

Radiation dose as a function of head circumference (HC) for organs-specific in convention group with standard-dose protocols (250mAs). (A) Brain, (B) eye lenses, and (C) salivary glands.
Subjective Image Quality in CON and LD Group Head CT Scan
We then separated the patients into 3 LD subgroups based on the HC and used low-dose HC-based protocols (tube current-time products of 200, 150, 100mAs) in 3 subgroups. The image quality was evaluated by 2 different radiologists who were blinded to the group information. There was no significant disagreement between the 2 radiologists. The Kappa value of the analysis results of 2 radiologists was K = 0.741, P = 0.441. The mean subjective image quality score is shown in Figure 3A. Although the tube current-time products decreased, the image quality score did not fell lower than 3.0 and was acceptable for diagnostic purposes. One way ANOVA test indicated that image quality in 4 groups was significantly different (P < .001, F = 41.48, DOF = 82). The Tukey-Kramer post-hoc analysis indicated that the image quality of 100mAs group was significantly lower than in other groups (P < .001 for all compare). In LD100mA s group, one image got a score of 3.0 that is the lowest acceptable quality for diagnosis (Figure 3B), and which indicates that a tube current-time products lower than 100mAs may produce image quality that is unacceptable for clinical diagnosis.
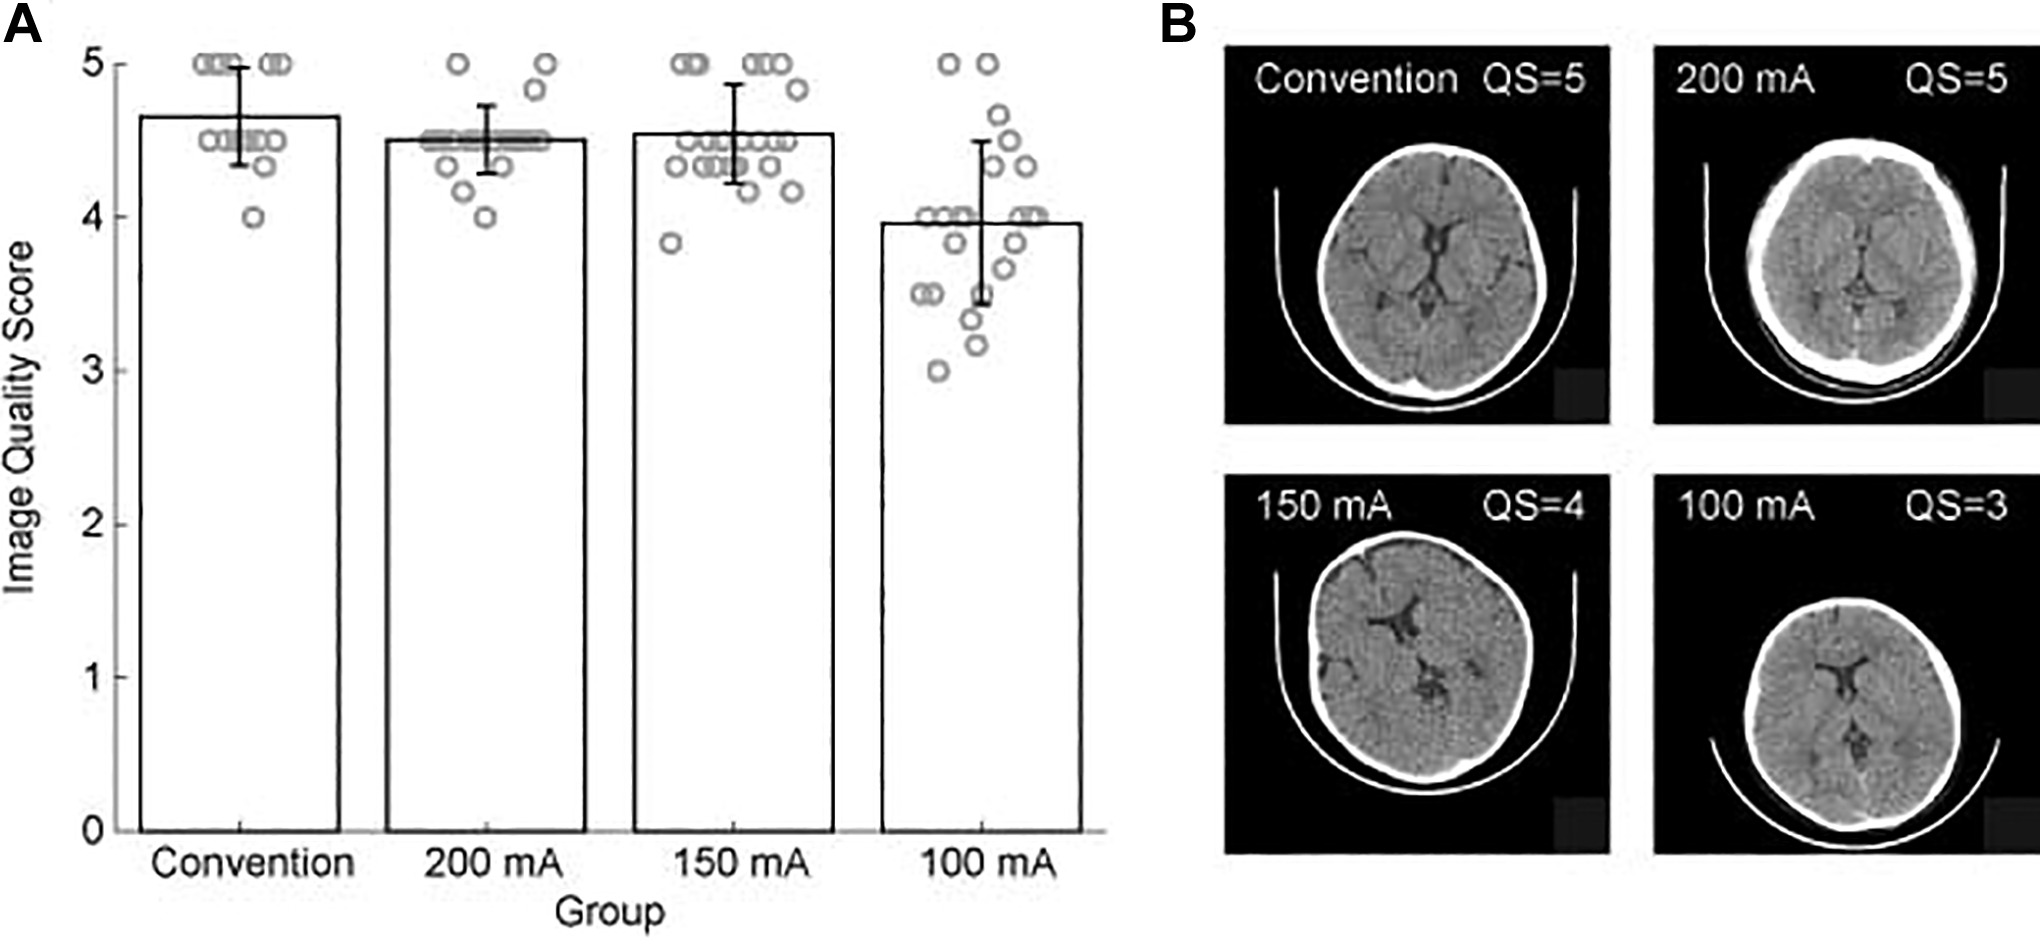
(A) The bar graph compares subjective unenhanced head CT image quality score under standarddose protocols (250mAs) and low-dose HC-based protocols (200, 150, 100mAs). (B) The representative images acquired from an unenhanced head CT scan with different mAs. HC, head circumference. CT, computed tomography.
Objective Image Quality in CON and LD Group Head CT Scan
The mean CT density, SD and SNR, CNR of the thalamus, and centrum semiovale in CON group and LD group are shown in Table 3. We further evaluated the image’s quality by measuring the SNR and CNR of 4 ROIs located at different structures. Although SNR and CNR of ROI1/ROI2 and ROI3/ROI4 gradually reduced with the decrease of mAs in LD group, there were no significant differences in SNR and CNR for the CON group and LD group (P = .08
Comparison of Mean CT Density, SD and SNR of Thalamus and Centrum Semiovale in Convention and Low-DOSE Group.

right thalamus (ROI1) and light thalamus (ROI2); right centrum semiovale (ROI3) and light centrum semiovale (ROI4).
Radiation Absorption Benefit of Low-Dose Head CT Scan
Since personalized low dose scan can still provide qualified images for the diagnosis, we wanted to further investigate whether pediatric patients could eventually benefit from reducing the tube current-time product. Figure 4 shows the brain radiation doses in the CON group and LD group. When the tube current-time product was reduced to 200, 150, and 100 mAs, the organ-specific radiation doses respectively decreased to 25%, 33%, 49% in brain, 20%, 37%, 50% in eye lenses, 6%, 34%, and 57% in salivary glands compared with 250mAs. With the decrease of tube current-time product, the brain radiation dose also decreased (Figure 4A). The ANOVA test indicated that the brain radiation dose in the 4 groups was significantly different (F = 54.51, P < .001, DOF = 82). The Tukey-Kramer post-hoc analysis indicated that 3 LD subgroups were different compared to the CON group (P < 0.001 for all 3 compares). The radiation doses in the LD100mA s group were significantly lower than in the other 3 groups (P < .001 for all 3 compares). The radiation doses in the LD200 mA s group and LD150 mA s group were not significantly different (P = .110). For salivary glands, the radiation doses reduced following the same pattern observed in the brain (Figure 4C). One way ANOVA test showed that the radiation doses in 4 group were significantly different (F = 65.737, P < .001, DOF = 82). Same as in the brain, the radiation doses in the CON250mAs group were significantly higher than in the other 3 groups (P < .001 for all 3 compares). The radiation doses in the LD100mA s group were significantly lower than in the other 3 groups (P < .001 for all 3 compares). The radiation dose in the LD200 mA s group and LD150 mA s group were not significantly different (P = .099). The radiation doses of eye lenses were also decreased in the LD group (Figure 4B). One way ANOVA test indicated that the radiation doses were significantly different among all experiment groups (F = 189.479, P < .001, DOF = 82). The Tukey-Kramer post-hoc analysis indicated that the eye lenses radiation doses differed in 4 groups (P < .001 in all compares).

The bar graph compares 3 organs-specific radiation dose under standard-dose protocols (250mAs) and low-dose HC-based protocols (200, 150, 100mAs). (A) Brain, (B) eye lenses, and (C) salivary glands. CT, computed tomography.
Discussion
Non-enhanced head CT examinations account for more than 50% of the total pediatric CT examination. 21,22 The gene mutation and cancer risk related to X-radiation in pediatric patients is 10 times higher than in adults. 23 -25 Pediatric patients have a higher average risk of developing cancer than adults receiving the same doses. The longer life expectancy of children allows for more time for any harmful effect of radiation to manifest. Also, developing organs and tissues are more sensitive to the effects of radiation. 26,27 Therefore, it is mandatory to respect the radiation protection principles when performing radiological examinations on children. Especially, brain, eye lenses, and salivary glands are sensitive to radiation in head CT scan. Using the same standard-dose protocols between adults and pediatric patients results in higher radiation doses being used in non-enhanced head CT, which indicates that pediatric protocols are not regularly used. Standard-dose protocols when performing non-enhanced head CT examinations are unreasonable for pediatric patients of different ages. Southard et al reduced radiation doses by using low mAs for pediatric patients of different ages. 20 Weinman et al and Kim et al reduced radiation doses by using low kilovoltage for pediatric patients of different ages. 28,29 However, the patient’s height and weight may affect the absorbed dose: if all other factors remain the same, the patient of a smaller size scanned with the same CTDI will absorb higher doses than a larger patient. 17 Pediatric patients are in the stage of growth and development, even in the same age, such as 5 years old, HC can greatly vary. Therefore, we think that age is not a reasonable indicator for choosing different low-dose CT scan. Appropriateness of the head scan adjusted to the size of the pediatric patients is of great importance.
In the CON250mAs group, our results revealed that brain radiation dose varied among pediatric patients with different HC, thus indicating that pediatrics of smaller HC might have received excessive radiation doses in the brain, eye lenses, and salivary glands during head CT scan using 250mAs. One possible explanation for the converse relation between brain radiation doses and HC is that the skulls with larger circumference absorb more radiation than smaller ones. In the same tube current-time product, the same amount of radiation doses was delivered to the subject; the larger skulls absorbed higher radiation doses, resulting in lower radiation doses for the brain. If this premise is true, the organ protected by the skull or craniofacial bones should show a similar correlation with HC. The organ outside of the skull might not reveal a negative linear correlation with HC. To test this, we examined the radiation dose in salivary glands (protected by mandible) and eye lens (not protected by bone), respectively. Our data showed a negative correlation between brain radiation doses and head circumference in the conventional group. Similarly, the salivary glands were protected by the mandible, and their radiation absorption was negatively correlated with the HC, similar to that of the brain. However, there was no significant linear relationship between radiation dose received by eye lens without skull or craniofacial bones protection and head circumference. These results provide theoretical support for the application of different mAs based on different HC in LD group.
As it is impossible/difficult to accurately estimate the radiation doses of each organ, it is impossible to quantitatively evaluate the benefits of low-dose head CT scan. Various measures are used to describe the radiation dose delivered by CT scanning, the most relevant being CTDI. However, CTDI is not an accurate representation of the dose absorbed by individual patients. It does not provide radiation dose to the organ or allows a comparison of dose across different modalities that deliver ionizing radiation. For risk estimation, the organ dose is the preferred quantity. So, to estimate organs-specific radiation dose, which can be used to assess risk and compare alongside other sources of radiation exposure, Monte Carlo simulations are needed. 28 -30
We used Radimetrics Enterprise Platform to evaluate organ-specific radiation doses, after which we investigated how pediatric patients could benefit from the low-dose HC-based head CT protocol. In our study, LD groups were divided into 3 subgroups, according to HC. Tube current-time product was 200mAs, 150mAs, 100mAs, respectively. CON group carried out a standard-dose of 250 mAs not basing HC. We then tested if we can use a lower dose head CT scan in patients with small HC, while maintaining the image quality. Subjective image quality scores in LD group and CON group were greater than or equal to 3 scores to meet image diagnosis. There was no significant difference between the LD250mAs group, LD200mAs group, and LD150mAs group in subjective image quality score, while there was a significant difference in the quality image score between the LD250mAs group and LD100mAs group. In the LD100mAs group, one patient’s image score was 3.0, which was the lowest acceptable quality of the clinical diagnosis, and thus indicated that the quality of the image under tube current below the 100mAs was unacceptable. Although SNR and CNR of ROIs gradually decreased with reduced mAs, there were no significant differences between the CON and LD groups.
We found that personalized head CT scan in LD group could significantly reduce the organ-specific-radiation dose levels compared to CON group while maintaining high image quality. HC can be used as an indicator for selecting mAs in non-enhanced head CT examinations to prevent excess radiation for the pediatric population. A personalized non-enhanced head CT scans can efficiently reduce the radiation dose. Therefore, it is more objective and appropriate to select mAs using this method during head CT scans in pediatric patients.
There are some limitations in the present study: firstly, the limited number of recruited patients. The sample size for the reduced-dose HC-based was quite small, with only 68 cases. Future studies should include more of these cases to verify the effectiveness of these results further. Secondly, only normal brain areas were morphologically evaluated. The image quality of various low-contrast lesions of the central nervous system (ie, S.O.L space-occupying lesions, necrosis within the brain tumor, etc.) can be affected by low-dose protocols. Thirdly, no specific rules were found to further refine the relationship between HC and tube current and radiation dose. Further studies are needed for the HC, and the specific mAs values.
Conclusion
Selection of the tube current-time product according to different HC is more rational and personalized design. Accordingly, our research results indicated that low-dose protocols based on HC at non-enhanced head CT examinations could effectively reduce organ-specific radiation doses without compromising image quality. The HC for an individual practice provides an effective method that can be used to guide personalized non-enhanced head CT protocols and help manage pediatric patient radiation doses. Our results highlighted the potential of optimizing pediatric CT head examination usage.
Footnotes
Author Contributions
BBY performed result analysis and thesis writing; WG and SZQ performed image evaluation; ZBX performed scanning; LN and XSJ performed original data collection; LD performed scheme design and paper revision. All authors have read and approved the manuscript.
Declaration of Conflicting Interests
The author(s) declared no potential conflicts of interest with respect to the research, authorship, and/or publication of this article.
Funding
The author(s) disclosed receipt of the following financial support for the research, authorship, and/or publication of this article: This work was supported by the Jilin Province Science and Technology Development Plan Item (No. 20191102001YY) and the First Hospital of Jilin University (No. JDYYJC008).