
Abstract
Objectives:
For patients with intracranial hemorrhage (ICH), routine follow-up computed tomography (CT) scans are typically required to monitor the progression of intracranial pathology. Remarkable levels of radiation exposure are accumulated during repeated CT scan. However, the effects and associated risks have still remained elusive. This study presented an effective approach to quantify organ-specific radiation dose of repeated CT scans of head for patients with ICH. We also indicated whether a low-dose CT scan may reduce radiation exposure and keep the image quality highly acceptable for diagnosis.
Methods:
Herein, 72 patients with a history of ICH were recruited. The patients were divided into 4 groups and underwent CT scan of head with different tube current–time products (250, 200, 150, and 100 mAs). Two experienced radiologists visually rated scores of quality of images according to objective image noise, sharpness, diagnostic acceptability, and artifacts due to physiological noise on the same workstation. Organ-/tissue-specific radiation doses were analyzed using Radimetrics.
Results:
In conventional CT scan group, signal to noise ratio (SNR) and contrast to noise ratio (CNR) of ICH images were significantly higher than those in normal brain structures. Reducing the tube current–time product may decrease the image quality. However, the predilection sites for ICH could be clearly identified. The SNR and CNR in the predilection sites for ICH were notably higher than other areas. The brain, eye lenses, and salivary glands received the highest radiation dose. Reducing tube current–time product from 250 to 100 mA can significantly reduce the radiation dose.
Discussion:
We demonstrated that low-dose CT scan of head can still provide reasonable images for diagnosing ICH. The radiation dose can be reduced to ∼45% of the conventional CT scan group.
Introduction
Since invention of computed tomography (CT) in the 1970s, it has remarkably influenced medical researches. 1,2 There is a considerable literature questioning the use of CT, or the use of multiple CT scans, in a variety of contexts, including management of blunt trauma, seizures, and chronic headaches, and particularly questioning its use as a primary diagnostic tool for acute appendicitis in children. 3 Specially for intracerebral hemorrhage (ICH), CT scan can accurately display location of ICH and distinguish the type of hemorrhage. 4 However, increasing use of the brain CT scan has aroused public concerns about radiation exposure. 5,6 Although CT represents only 11% of radiologic procedures, it accounts for as much as 70% of the total effective dose from all diagnostic radiologic studies. 7,8 A previous study demonstrated that radiation dose via multiple CT scans in the same patient could be accumulated compared with a single CT scan. 9 Several studies reported a significant association between exposure to high-dose radiation and increased risk of cortical and posterior subcapsular cataract formation or other lenticular changes. 10,11
A CT scan protocol is typically designed to reliably achieve high-quality images for diagnosing all types of brain diseases. Hence, development of low-dose CT scans can reduce patient radiation exposure, which is particularly important for the diagnosis of ICH. To date, there is no specific guideline for diagnosing ICH using CTs. In the present study, we demonstrated that low-dose CT scan can offer images with acceptable quality for diagnosis and reduce the radiation exposure. We also quantified organ-specific radiation dose for repeated head CT scan. Our data may assist physicians to select a more effective CT scan protocol for follow-up CT scans.
Patients and Methods
Patients’ Selection
This study was approved by the ethics committee of the First Hospital of Jilin University (Changchun, China), and all patients signed the written informed consent form prior to start of the study. Inclusion criterion was verified ICH through initial CT scanning conducted by GE ADW4.6 CT Workstation (GE Healthcare, New York, New York). Patients who admitted to the emergency department were excluded. A total of 72 patients (41 males and 31 females) who underwent CT of head at our institution from January 2017 to December 2017 were included in this study.
Computed Tomography Protocol
Helical CT protocol: In group of CON250, CT scan of head was performed using a 64-slice multidetector computed tomography scanner (Brilliance 64; Philips Healthcare, Cleveland, Ohio), which contains single source, 64 detector rows. The details of CT protocol were as follows: tube voltage of 120 kVp, scanning during 9.6 seconds, slice thickness of 5 mm, gantry rotation time of 0.75 seconds, a collimation of 64 × 0.625 mm, and field of view of 250 mm, image matrix of 512 × 512 pixels, pixel spacing of 0.44 × 0.44 mm2, and tube current–time product of 250 mAs.
In 3 low-dose groups, the tube current–time products were set to 100, 150, and 200 mAs, respectively. All the other parameters remained unchanged.
Evaluation of Quality of Images
Radiologists who analyzed the images were blinded to the patients’ data and scan protocol. In order to evaluate the quality of images, the same image was taken from each patient. The window and level settings used for CT scan were as follows: window width = 80 and window level = 40.
Quality of image was evaluated via signal intensity (SI) measured in Hounsfield units (HU). Eight 4 to 6 mm2 circular regions of interest (ROIs) were selected as follows: basal ganglia (ROI1), frontal white matter (WM; ROI2), frontal cortical layer (ROI3), lateral ventricles (ROI4), internal capsule (ROI5), cortical layer of cerebellum (ROI6), WM of middle cerebellar peduncle (ROI7), and vermis (ROI8). The ROIs were placed in the normal brain parenchyma; if the bleeding foci was existed, the circle was put on the contralateral side. 12
The signal to noise ratio (SNR) was calculated according to Equation 1:

The contrast to noise ratio (CNR) was calculated according to Equation 2:
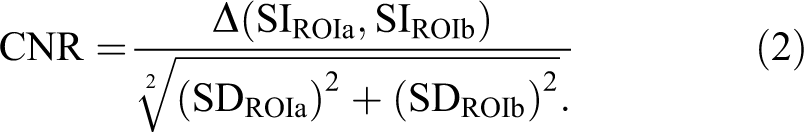
It is noteworthy that CNR was calculated in the supratentorial (ST) region between ROI3/ROI2 (ST-CNR C/WM) and between ROI1/ROI2 (ST-CNR NL/WM). For the infratentorial (IT) region, CNR was calculated between ROI6/ROI7 (IT-CNR C/WM) and ROI8/ROI7 (IT-CNRV/WM).
Evaluation of Quality of ICH Images
Since the aim of CT scan is to monitor the ICH, we quantified the predilection sites for ICH images. A 4 to 6 mm2 circular ROI was selected.
Similar to that mentioned earlier, SNR was calculated according to Equation 1.
The CNR was calculated using Equation 3 13 :

where SIROI9 denotes the mean HU value of the ROI in the center of the ICH image, SIROI3 represents the mean HU of frontal cortical layer, and a denominator in Equation 3 denotes the standard deviation of the distribution of HU values in ROI3.
Evaluation of Quality of Images by Physicians
Two independent radiologists, who were expert in diagnosis of head and neck diseases with >10 years of experience, were employed to assess the quality of images. The radiologists were blinded to the patient’s data. The radiologists evaluated image noise, artifacts due to physiological noise, and anatomical structures and lesions using the European Guidelines on Quality Criteria for Computed Tomography 14 (see Table 1). The final score of an image was the average score of the 3 parameters. An image quality score of ≥3 was considered as a qualified image.
Grating Scale of Subjective Images Quality.

To assess differences in diagnosis between 2 images, the Cohen κ coefficient was used. A Cohen κ coefficient equal to 0 demonstrates disagreement. A Cohen κ coefficient in the range of 0.1 to 0.4 indicates poor agreement. A strong correlation is achieved when Cohen κ coefficient is between 0.41 and 0.6. 15
Organ-/Tissue-Specific Radiation Doses
The effective radiation doses of specific organs/tissues were analyzed with Radimetrics Enterprise Platform (Radimetrics; Bayer Healthcare, Whippany, New Jersey). It merges and mobilizes patient dose histories and current examination details across all enterprise sites, bringing analysis and quality solutions to the point of care. This platform provides both radiation dose management and contrast dose analytics management and rapid access to patient dose history. In the present study, 10 different organs/tissues (brain, eye lenses, esophagus, muscles, red marrow, salivary glands, skeleton, skin, thymus, and thyroid) were analyzed and simulated using the mentioned platform.
Statistical Analysis
All statistical analyses were performed using SPSS 22.0 software (IBM Corp, Armonk, New York). Continuous variables were analyzed using unpaired t test, and categorical variables were analyzed by Mann-Whitney U test. 16 The Tukey-Kramer post hoc analysis was employed to evaluate the difference among different groups. 17 One-way analysis of variance (ANOVA) was employed to compare variables among more than 2 groups. Value of P ≤ .05 was considered statistically significant.
Results
Quality of Conventional CT i mages of Head
In this study, the tube current was set to 250 mA. Figure 1A shows an example of conventional CT image of head. The score of image quality graded by radiologists was 5 (the mean score of image quality, 4.68 ± 0.44). In this image, the cortical structure could be clearly distinguished. We further evaluated the quality of the image by measuring the SNR of 8 ROIs located at different structures (Figure 1B). In normal brain area, the greatest SNR was observed in ROI3 and ROI7, with average SNR of 9.76 ± 2.94 and 9.62 ± 3.64, respectively. However, the SNR in the hemorrhage spot was 21.90 ± 9.72. One-way ANOVA indicated that the SNR was significantly different (P < .001, F = 28.17, degrees of freedom [DOF] = 143). The Tukey-Kramer post hoc analysis revealed that the SNR in hemorrhage spot was remarkably higher than that in the other groups (P < .001).
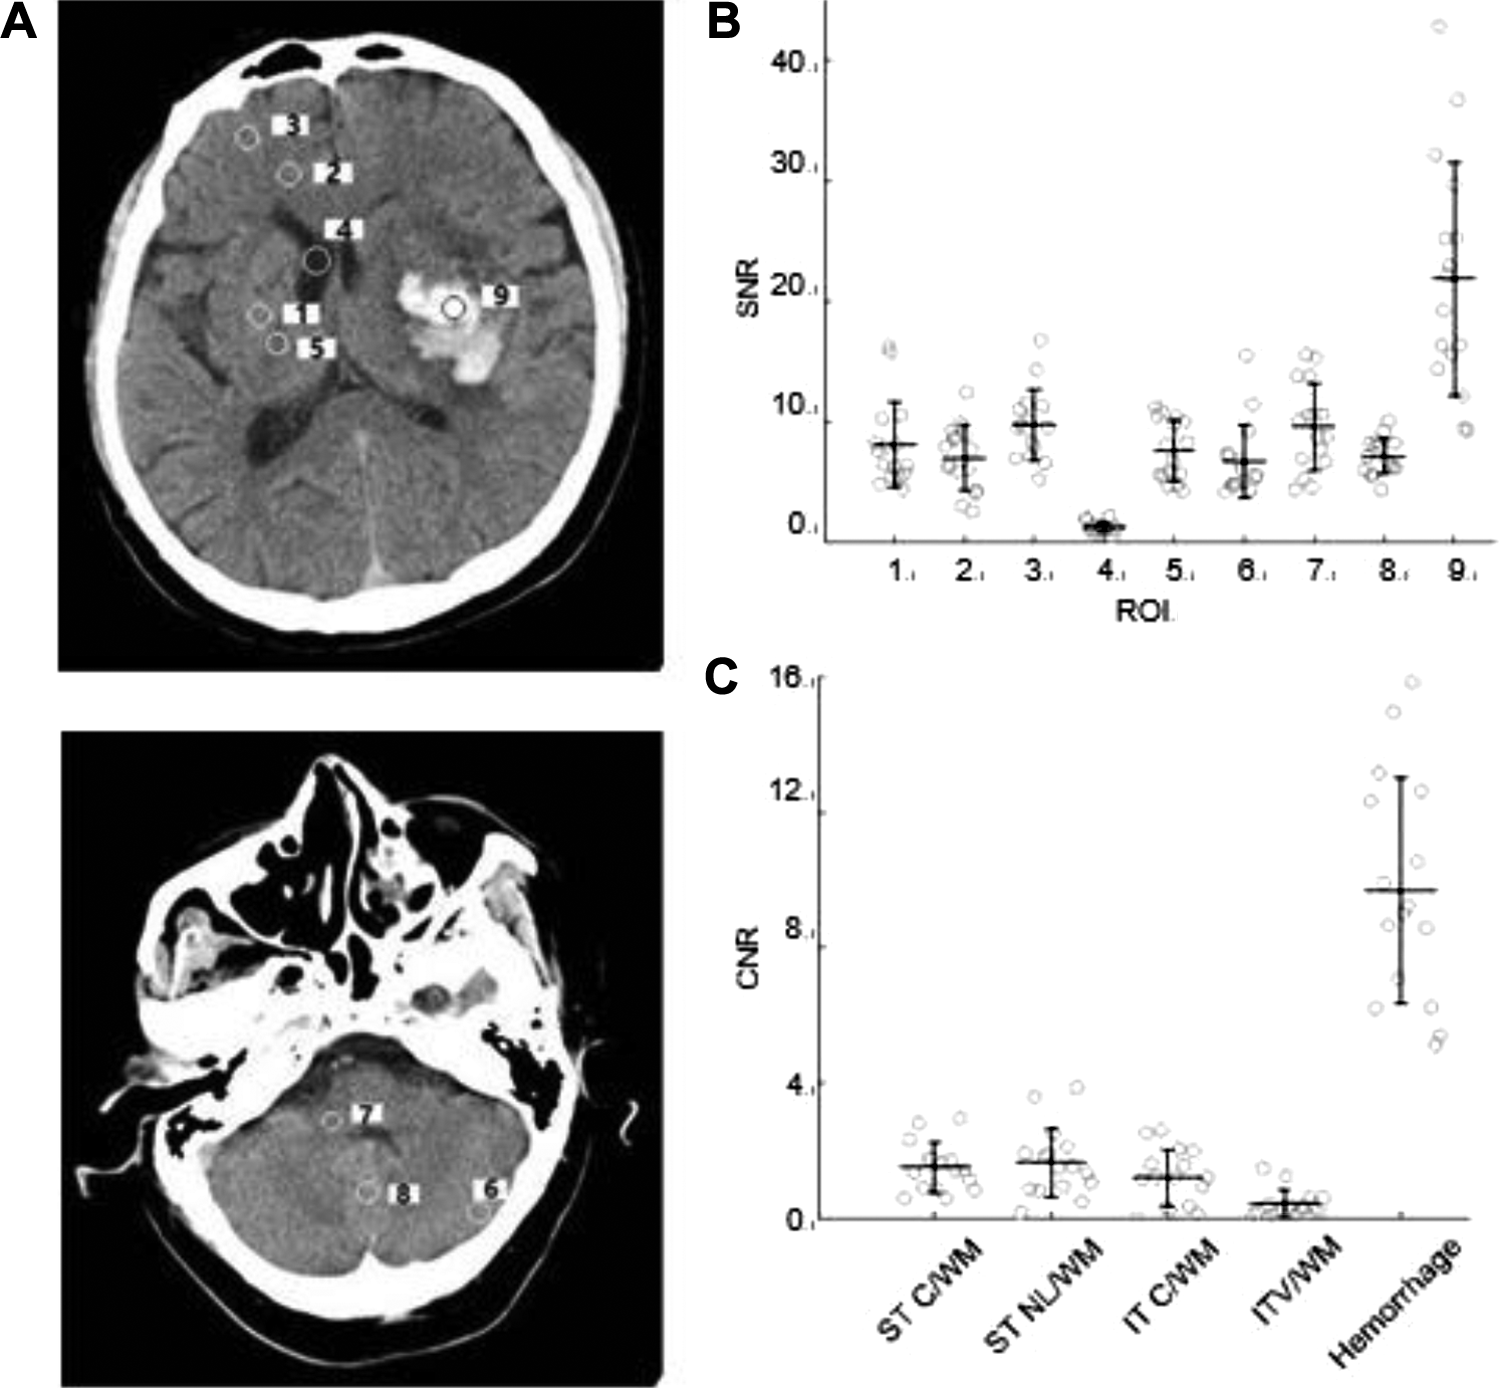
Sites of ROIs for analysis of image quality. A, An example of conventional CT image of head. Supratentorial ROIs included the lentiform nucleus (ROI1), frontal white matter (ROI2), temporal cortical layer (ROI3), ventricle (ROI4), and internal capsule (ROI5). Infratentorial ROIs included the cortical layer of the cerebellum (ROI6), WM of the middle cerebellar peduncle (ROI7), and the vermis (ROI8). ROI9 indicates the center of hemorrhage in supratentorial or infratentorial region. B, The mean SNR values of 9 ROIs were shown in conventional CT scan group. C, The mean CNR values of 4 ROIs in normal brain structures and center of hemorrhage were presented in conventional CT scan group. CNR, contrast to noise ratio; CT, computed tomography; IT-CNR C/WM, infratentorial CNR (cortex/white matter); IT-CNR V/WM, infratentorial CNR (vermis/white matter); ST-CNR C/WM, supratentorial CNR (cortex/white matter); ST-CNR NL/WM, supratentorial CNR (lentiform nucleus/white matter); ROI, region of interest; SNR, signal to noise ratio; WM, white matter.
We also investigated CNR in different areas (Figure 1C). It was noted that CNR in normal brain areas (ST C/WM, ST NL/WM, IT C/WM, and IT V/WM) was notably lower than that in the ICH. One-way ANOVA unveiled that SNR was significantly different (P < .001, F = 86.18, DOF = 79). The Tukey-Kramer post hoc analysis indicated that CNR in hemorrhage spot was markedly higher than that in normal brain areas (P < .001).
Since the purpose of follow-up CT scan was to monitor the ICH in the present study, the conventional CT of head was found overqualified. Computed tomography scan of head with a lower dose CT scan may still provide high-quality images for diagnosis.
Low-Dose CT Scan
We assessed whether low-dose CT scan could generate qualified images. In 3 groups of patients, the tube current–time products were reduced to 200, 150, and 100 mAs, respectively. The other parameters remained unchanged. First, we investigated the score of quality of image determined by independent radiologists (Figure 2B). Although the scores of quality of image were all ≥3, the scores decreased with reducing of tube current–time product. One-way ANOVA demonstrated that the SNRs were significantly different (P < .001, F = 25.34, DOF = 71). The Tukey-Kramer post hoc analysis indicated that the score of convention group (tube current–time product of 250 mA) was noticeably higher than that in other groups (P < .001 for 100 and 150 mA groups, P = .007 for 200 mA group). Similarly, the SNR in the majority of ROIs slightly reduced with attenuating the tube current–time product (Figure 2C), while no significant difference was detected. The CNRs also slightly decreased with decline of tube current–time product (Figure 2D). Our data indicated that the lower tube current–time product may decrease the image quality. The conventional CT scan parameters may guarantee an image with acceptable quality for detecting the normal brain structures, and reducing the tube current–time product may decrease the quality of images.

A, The representative images acquired from CT scans with different radiation doses: (i) 100 mAs dose; (ii) 150 mAs dose; (iii) 200 mAs dose. The red arrow indicates the predilection sites for ICH. B, The bar graph compares image quality under different tube current–time products. C, The bar graph shows the SNR of 9 ROIs in 4 groups. D, The bar graph shows the CNR in 4 groups. CNR indicates contrast to noise ratio; CT, computed tomography; ICH, intracranial hemorrhage; ROI, regions of interest; SNR, signal to noise ratio.
However, the aim of the follow-up CT scan is to diagnosis the predilection sites for ICH. Hence, we attempted to study whether the predilection sites for ICH can be clearly differentiated in different images. As shown in Figure 2A, the predilection sites for ICH can be clearly identified. The predilection sites for ICH is illustrated as an area with high brightness from the surrounding brain structure. We also compared the SNR of the predilection sites for ICH and other brain areas. The SNRs of predilection sites for IHC recorded in 4 different groups were remarkably higher than other ROIs (ROI9 in Figure 2C). One-way ANOVA indicated that the SNRs were significantly different (P < .001, F = 32.64, DOF = 647). The Tukey-Kramer post hoc analysis showed that the SNRs of predilection sites for IHC in 4 groups were all markedly higher than SNR recorded in each group individually (P < .001).
Similarly, the CNR was also higher in predilection sites for ICH than other areas. One-way ANOVA demonstrated that the CNRs were different among these groups (F = 70.38, P < .00, DOF = 356). The Tukey-Kramer post hoc analysis indicated that the CNRs of the ICH groups were significantly higher than other groups (P < .001).
Benefits of Radiation Absorption
We then investigated the organ-specific radiation dose of conventional CT scans. The organ-specific radiation dose of the 16 patients is presented in Figure 3A. Of all the 10 organs/tissues, brain, eye lenses, and salivary glands received higher radiation dose than other organs/tissues. Reducing the radiation dose may be remarkably advantageous for these organs.

A, The bar graph shows that effective dose of 9 specific organs/tissues for 4 different CT scans of head in (B-D). The bar graph compares 3 sensitive organs. CT, computed tomography.
We also assessed whether reducing the tube current–time product is highly beneficial for brain, eye lens, and salivary glands (Figure 3B). These organs received lower radiation dose with the decreasing tube current–time product. The radiation doses in group of 100 mA were only 45.65% (brain), 44.46% (eye lens), and 45.65% (salivary glands) in the conventional CT scan group. For CT scan of brain, 1-way ANOVA unveiled that the radiation doses were significantly different (F = 75.56, P < .001, DOF = 71). The Tukey-Kramer post hoc analysis indicated that the radiation doses were noticeably different (P < .001). For eye lenses, 1-way ANOVA revealed that the radiation doses were remarkably different (F = 98.44, P < .001, DOF = 71). The Tukey-Kramer post hoc analysis indicated that the radiation doses were significantly different (P < .001). For salivary glands, 1-way ANOVA showed that the radiation doses were significantly different (F = 29.16, P < .001, DOF = 71). The Tukey-Kramer post hoc analysis demonstrated that the radiation dose in group of 100 mA was significantly different compared with other groups (P < .001), and the radiation dose in group of 200 mA group was considerably lower than that in the conventional CT scan (250 mA) group (P = .0249). Our findings expressed that less tube current–time product can greatly advantageous for patients in the follow-up CT scan of brain.
Discussion
The ultimate goal of CT development is to reduce the radiation dose and maintain the quality of CT images. In the present study, for the first time, we used Radimetrics to quantify the radiation dose in different organ/tissues with a systemic reduction of tube current–time product. We found that decreasing the tube current–time product to 100 mAs may attenuate the radiation dose by more than 50% and the quality of image is satisfactory enough for the diagnosis of ICH. We, in the present study, for the first time, assessed both image quality and radiation dose. Our findings may assist physicians to better interpret the quality of CT images for different cases.
Image Quality
The ultimate goal of CT scan is to provide a more clear brain structure for diagnosis. In the majority of the brain diseases, such as vertigo, skull fracture, and cerebral infarction, CT images aim to distinguish abnormalities in the structure. In the majority of brain regions, SNR and CNR remain acceptable (Figure 2). In our ICH case, there is a high contrast between the normal brain area and the hemorrhagic area, and a conventional CT protocol is overqualified as well. In the present research, the SNR and CNR in predilection sites for ICH were significantly higher than other brain regions (Figure 1B, C).
Low-Dose CT Scan
A limited number of scholars attempted to study the quality of images in low-dose CT scan of head. 18 However, in those studies, organ-/tissue-specific radiation doses were not estimated.
Previous researches reported the application of low-dose CT scan of chest, 19,20 in addition to study of low-dose CT scan of head and abdomen. 21,22 The study of low-dose CT scan of brain is limited, mainly due to the thicker skull and absorption. Dose reduction is not conducive to observe intracranial structures, and in the present study, we assessed the balance relationship between radiation dose and quality of image in ICH. Other studies used iterative reconstruction techniques to reduce the tube voltage or tube current–time product, and so on, to attenuate the radiation dose. 23 The current research did not use iterative reconstruction techniques, and only the tube current–time product was adjusted to reduce the radiation dose. A number of scholars suggested that low levels of ionizing radiation are beneficial 24 ; a recently conducted study by Calabrese et al reported over 37 000 patients who were treated with low levels of ionizing radiation. 25
In the present study, the tube current–time product was reduced by 60% (from 250 to 100 mAs), and the SNR and CNR of ICH were remarkably higher than those of normal brain area in conventional CT scan. However, we couldn’t further reduce the tube current–time product. A clear image of other brain regions was also found to be valuable to identify other complications. A number of images in the low-dose CT scan group reached a score of 3, and further deduction of tube current–time product might result in unqualified images.
Benefits of Low-Dose CT Scan for Patients With ICH
Our data showed that less tube current–time product (mAs) may significantly reduce the radiation dose in brain, eye lenses, and salivary glands by 100, 150, and 200 mAs, respectively (Figure 3B). The quality of image of hemorrhagic area was higher than the normal brain area (ROI9 in Figure 1A). In general, radiation exposure may increase the risk of salivary gland cancers. 26 The present research showed that the radiation exposure can be markedly reduced for patients with ICH, decreasing the risk of salivary gland cancers.
Application of Low-Dose CT Scan
Although low-dose CT scan may be beneficial for patients with IHC, the application of affiliated protocol should be highly taken into consideration. For patients with IHC, the purpose of the initial CT scan is to identify the hemorrhage focus, in addition to potential damage to other areas. Thus, convention CT protocol is required to detect any potential damage in the whole brain. During the follow-up CT scans, the major target is to detect the progression of hematoma in the brain. The anatomical structure of other brain areas is less important unless some new clinical symptoms occur. Thus, reducing the tube current–time product may significantly decrease the accumulated radiation dose and attenuate the carcinogenic risk, especially for young patients. 27
In summary, we presented a quantified method to estimate the benefits of undergoing follow-up CT scans for patients with ICH. We have evaluated the image quality at different tube current–time products. Our data may assist physicians to effectively design a CT scan protocol for patients with ICH.
Footnotes
Declaration of Conflicting Interests
The author(s) declared no potential conflicts of interest with respect to the research, authorship, and/or publication of this article.
Funding
The author(s) disclosed receipt of the following financial support for the research, authorship, and/or publication of this article: This work was supported by the Jilin Province Science and Technology Development Plan Item (No. 20191102001YY) and the First Hospital of Jilin University (No. JDYYJC008).