
Abstract
Objective:
To establish a HPLC fingerprints evaluation method for Angelica Sinensis Radix (ASR) based on traditional decoction process of Ancient Classical Prescriptions of Traditional Chinese Medicine (ACPTCM).
Methods:
The fingerprints of 10 batches of ASR were further evaluated by chemometrics methods. The similarity analyzed with “Similarity Evaluation System for Chromatographic Fingerprint of Traditional Chinese Medicine 2004A,” and hierarchical clustering analysis (HCA) and principal component analysis (PCA) were performed by SPSS (version 22.0, SPSS Inc., Chicago, IL, USA).
Results:
There were 12 common peaks, and the similarity degrees of 10 batches of samples were more than 0.923 and showed that all the samples from different origins were of good consistency. The samples were divided into 4 clusters by HCA. The results of PCA showed that the 3 factors were chosen, the quality of samples could be evaluated basically. The comprehensive score results show that the ASR with Lot.Nos.DG-18007, DG-18008 in Weiyuan County, Gansu and DG-18009 produced in Minle County, Gansu Province rank among the top 3 in all samples.
Conclusions:
These results demonstrated that the combination of HPLC chromatographic fingerprint and chemometrics offers an efficient and reliable approach for quality evaluation of ASR from different sources as Ancient Classical Prescriptions ingredients.
Introduction
Ancient Classical Prescriptions of Traditional Chinese Medicine (ACPTCM) 1 mean the ancient formulas, which had been widely used before the Qing dynasties and have definite curative effects, obvious characteristics and advantages. 2 -5 After extensive clinical practice by many famous doctors, the ancient formulas, as a treasure of Traditional Chinese Medicine (TCM), had been preserved to now and becoming more and more popular not only in China but also around other countries. Several research on classical prescriptions have been developed. 6 -15 For instance, Danggui Buxue Tang (DBT), an ancient formula composed of Angelica Sinensis Radix (ASR) and Astragali Radix (AR), first recorded in “Neiwaishang Bianhuo Lun” 16 by Li, Dongyuan in China in AD 1247. In TCM clinics, DBT is prescribed for women to improve their health by raising the “Qi” (vital energy) and nourishing the “Blood” (body circulation), 17,18 and thus DBT today is a remedy for menopausal women to promote hematopoiesis, stimulate cardiovascular circulation, prevent osteoporosis, and trigger estrogenic activity. 19 -23 In January 2008, National Food and Drug Administration of People’s Republic of China issued the notice on Implementation of the Supplementary Regulations on the Registration of TCM. 24 It stated that “The production of preparations from classical prescriptions that meet the conditions prescribed by the state, can do not need to provide clinical safety research materials when applying for a drug approval number.” In August 2015, National Council issued the “Opinions on Reforming the Review and Approval System for Drugs and Medical Devices,” 25 proposing to simplify the approval of compound preparations derived from. In December 2016, the “Law of the people’s Republic of China on TCM” (Chinese Medicine Law) 1 was officially promulgated, clearly defined the legal status of TCM compound preparations derived from ACPTCM. In the following year, the Office of National Administration of Food and Drug Administration publicly solicited opinions on the “Regulations on Simplified Registration Examination and Approval of ACPTCM (Draft for Comment)” and the requirements for declaration materials (Draft for Comment). 26 And in April 2018, “The Catalogue of ACPTCM (first batch)” was launched by National Administration of TCM of People’s Republic of China, which containing 100 formulas in total. 27 These documents exemplify the research significance of ancient formulas. They might be the milestones in the development and approval of compound preparations derived from ACPTCM, and will make an effort to promote the steady development of TCM.
At present, there is no conclusion about the quality control of classical prescriptions. To ensure the safety, effectiveness and quality consistency of the final preparation from the entire process, it is particularly important to research and quality control of TCM raw materials. Up to now, several researches about the study about quality control of TCM 28 -30 have been reported. The HPLC fingerprint technology 31 -36 has been widely recognized as a comprehensive and effective approach for quality assessment of TCM. For example, to evaluate the quality of Nelumbinis Receptaculum (dried receptacle of Nelumbo nucifera), Wu Y B et al. 37 established a method of chromatographic fingerprint through extracting the samples by 50% ethanol. Polygoni Orientalis Fructus (POF) is a clinically effective Chinese medicine, derived from the fruit of Polygonum orientale L. 38 Raw POF (RPOF, prepared by collecting, cleaning, and sun-drying the fruits of Polygonum orientale.) and POF Tostus (POFT, produced by further processing in which RPOT is stir-fried until it bursts.) are used separately in clinics. 39,40 To discriminate and assess the quality of these 2 varieties, Ba Y et al. 41 developed a method of High-performance liquid chromatography combined with the diode array detector (HPLC-DAD) for fingerprinting and quantitative analysis of 7 major compounds in RPOF and POFT by refluxing the samples with methanol. However, almost the samples were prepared by pure or different ratios of organic solvents like methanol and ethanol and so on. 42 -44 Unlike chemical drugs with some certain single ingredient, the composition of TCM may be so complex, in which some water-soluble ingredients that already had been proven with pharmacological activity such as nucleosides, 45 organic acids, 46 polysaccharides, 47 etc. are difficult to be proposed when extracted with organic solvents. We believe that a more effective and reliable quality control method for TCM should include the assay of water-soluble constituents rather than only organic-soluble constituents. The traditional usage of TCM in clinic is decoction, a form of dosage prepared by the traditional process taking water as the only solvent. 48 -50 The decoction played an important role in clinic treatment so as to accounting for nearly 80% among the Catalogue of ACPTCM (first batch) of all ancient classical prescriptions. Therefore, to ensure the stability and effectiveness of TCM preparation from ACPTCM, it is of great significance to research deeply on the decoction of TCM, especially investigate and control the quality of medicinal materials such as ASR.
Angelica Sinensis Radix (ASR) is the dried root of Angelica Sinensis (Oliv.) Diels, belonging to the family of Apiaceae. 51 From the perspective of TCM, ASR is considered sweet, acrid, and warm in properties. It covers 3 meridians, including liver, heart, and spleen. Of course, ASR has been extensively investigated in phytochemistry, 52 -58 and the results indicated that organic acid (such as ferulic acid), volatile oil (such as senkyunolide I and ligustilide), and polysaccharide are the main components in this plant, which have been proved to be the bioactive compounds of ASR. 59 -64 Pharmacological studies demonstrated that those components have hematopoietic activity, anti-platelet aggregation, anti-arrhythmic, anti-radiation, anti-tumor, analgesic, regulating smooth muscle and protective effects on organs. 65 -70 Since ancient times, ASR has been clinically used for the treatment of various diseases, including enrich the blood and invigorate the circulation of blood, regulate the menstrual function to ease pain, and loose the bowel to relieve constipation in China, 71 which enjoys the reputation of “King of Medicine.” In clinic, ASR was prepared as decoctions for treatment by a unique methodology with a specific combination of different herbs as a formula. 72 -74 Among thousands of different TCM formulas, ASR appeared frequently and there is an old saying that goes “9 out of 10 prescriptions containing ASR.” From the Catalogue of ACPTCM (first batch), the prescriptions which contained ASR accounts for almost a quarter (Table 1), which showed that ASR has an important position in TCM prescriptions. Therefore, in order to make those prescriptions play a better role in treatment, it was necessary to take suitable methods for researching and controlling the quality of ASR.
Statistics of 24 Prescriptions With ASR in the Catalogue of ACPTCM (First Batch).

In this study, we attempted to adopt the traditional decoction process, all sample solutions were extracted by water. A HPLC-PAD method was developed for the quality evaluation of ASR. In consideration of the complexity of TCM, similarity analysis (SA), hierarchical clustering analysis (HCA) and principal component analysis (PCA) which were usually performed in analysis, 37,44,75 -78 were used to reasonably define the class of ASR and to efficiently evaluate the quality of ASR. We expected that the method would be helpful for the quality control of ASR and it can provide a reference for the quality evaluation of products prepared by traditional decoction technology, such as classical preparations.
Materials and Methods
Instruments, Reagents and Materials
The chromatographic separation was performed on a Waters e2595 HPLC system (Waters Co., Ltd. USA), equipped with a quaternary pump, an autosampler, an automatic thermostatic column compartment, a PAD detector and a computer with a software program for analysis of the HPLC data.
Ligustilide (Lot No: 111731) was purchased from the National Institute for Food and Drug Control (Beijing, China). Ferulic acid (Lot No: H27J7L16718) was purchased from Shanghai Yuanye Bio-Technology Co., Ltd. (ShangHai, China). Senkyunolide I (Lot No: 201902) was purchased from Nanjing Jin Yibai Biological Technology Co., Ltd. (Nanjing, China). HPLC-grade acetonitrile was purchased from Merck (Merck, Germany). Acetic acid (Lot No: D1918059) was purchased from Shanghai Aladdin Biochemical Technology Co., Ltd. (ShangHai, China). Distilled water was used in the experiment. Other reagent solutions were of analytical grade. Ten batches of ASR (S1-S10) acquired from different regions of China were listed in Table 2.
Sources of 10 Batches of ASR.

Preparation of Standard and Sample Solutions
Standard solution preparation
Three reference standards (ferulic acid, senkyunolide I and ligustilide) were accurately weighed and dissolved in methanol to form stock solutions at a certain concentration. A mixed standard solution was obtained by diluting stock solutions for quantification, with concentration of 0.0081, 0.0089 and 0.0231 mg • mL−1, respectively. All stock and working standard solutions were stored at 4°C until used for analysis.
Sample solution preparation
The dried samples were powdered and passed through a 65-mesh (250-μm) sieve. Accurately weighed portions of these powders (6 g) were first socked with 50 mL water for 0.5 h at 25°C, then refluxed for 0.5 h at 80°C. Collecting the extraction and after filtrating through a 0.45-µm membrane, 20 µL of the obtained solution was injected into the HPLC for analysis.
Chromatographic Conditions of HPLC-PAD Analysis
Analysis was performed using an HPLC system. Separation was carried out on a Hedera ODS-2 column (200 mm×4.6 mm i.d., 5 µm Hanbon. Sci. & Tech.). The column was eluted with a gradient mobile phase of acetonitrile (solvent system A) and 0.2% acetic acid in ultra-pure water (solvent system B). Gradient elution was performed as follows: 0∼16 min, 15%∼23%A; 16∼20 min, 23%∼28%A; 20∼25 min, 28%∼30%A; 25∼30 min, 30%A; 30∼35 min, 30%∼32%A; 35∼45 min, 32%A; 45∼50 min, 32%∼40%A; 50∼55 min, 40%∼45%A; 55∼60 min, 45%∼65%A; 60∼65 min, 65%∼95%A. Acetonitrile-water with a flow rate of 1 mL/min provided a much better resolution, and the injection volume was 20 μL. The column temperature was maintained at 30°C. The effluent from the column was detected by a photodiode array detector (PAD) and the detection wavelength was set at 282 nm.
Validation of the Method
A sample of the ASR was prepared as described above and was subjected to HPLC analysis 6 times in the same day to evaluate the precision. The repeatability was examined by the injection of 6 different samples, which were prepared with the same sample preparation procedure. The stability of the sample solution was evaluated by analyzing the same sample solutions stored at room temperature for 0, 2, 4, 6, 8, 12 and 24 h.
Fingerprint Analysis
The fingerprint analysis of all samples was performed by HPLC-PAD method. Equal amount of ASR (6.0 g) from each origin was used as the sample for fingerprint analysis. Gradient elution system was the same as described in Section 2.2. The HPLC condition was the same as described above.
Statistical Analysis
HPLC fingerprints and the reference chromatogram fingerprints of 7 varieties of ASR were generated by Chinese Medicine Chromatographic Fingerprint Evaluation System (2004 A), and the characteristic peaks and similarities of the fingerprint data were identified based on retention time and peak area. SPSS (version 22.0, SPSS Inc., Chicago, IL, USA) statistical program was used for HCA and PCA.
Results and Discussion
Optimization of HPLC-PAD Method
In order to obtain the chromatograms with better separation of adjacent peaks within a short time, the mobile phase, detection wavelength and column temperature were investigated. In this work, acetonitrile-water system was used as the mobile phase. Considering the complex of the sample, a little amount of acid was added to the mobile phase to reduce the ionization and lower the polarity of these compounds. The mobile phases (acetonitrile-water) with different modifiers (0.1%acetic, 0.2%acetic, phosphoric and formic acids) were investigated under different gradient elution modes. The results showed that 0.2% acetic acid was added to the acetonitrile-water system to further improve the peak shape and baseline resolution. Due to a full-scan experiment of the 5 active components from 200 to 400 nm, 282 nm was selected as the detection wavelength, so that more characteristic peaks could be obtained, and the baseline was well improved on the chromatographic profiles. The effect of column temperatures 25, 30 and 35°C, on the separation process was also tested. Most of the peaks in the HPLC chromatograms were well resolved at 30°C. Thus, this temperature was chosen as the column temperature for the fingerprint analysis.
Method Validation of Quantitative Analysis
A sample of the ASR was prepared as described above and was subjected to HPLC analysis 6 times in the same day to evaluate the precision. The repeatability was examined by the injection of 6 different samples, which were prepared with the same sample preparation procedure. The stability was analyzed in 0, 2, 4, 6, 8, 12 and 24 h within 1 day. Using ferulic acid as a reference peak, the consistency of the similarity of the common peaks was examined. Variations were expressed as relative standard deviations (RSD). Table 3 showed the results of the tests of precision, repeatability and stability.
The Relative Standard Deviation (RSD) Results of Methodology Validation (n = 6).

In the results of the precision experiment, the values of RSD for the relative retention time and peak area were below than 0.12% and 3.76%, respectively. The RSD of the relative retention time and peak area in the repetitive results was less than 0.17% and 1.46%, respectively. The stability results showed that the RSD of the sample relative retention time and peak area within 24 h were less than 0.33% and 2.27%, respectively.
Chemometrics Analysis of HPLC Fingerprint
Establishment of chromatographic fingerprint of ASR and similarity analysis (SA)
To standardize the HPLC profile, the samples of ASR were analyzed, and all chromatograms were introduced into the “Similarity Evaluation System for Chromatographic Fingerprint of Traditional Chinese Medicine” (Version 2004A, Chinese Pharmacopoeia Commission, Beijing, China). Peaks that existed in all chromatograms of samples with reasonable heights and good resolutions were assigned as “common peak” for ASR. The time window was set to 0.2 s and the calibration method was multi-point calibration. Through matching the common peaks of the markers, the reference chromatogram fingerprint was generated by using the average method. As shown in Figures 1 and 2, there are 12 distinct common peaks (from peak 1 to peak 12) in the HPLC fingerprint common patterns from the 10 samples of ASR. Three common peaks (peak 6, 10 and 12) were identified as ferulic acid, senkyunolide I, ligustilide, respectively by comparing their retention time with the standard compounds.

HPLC fingerprints of 10 batches of ASR.

HPLC fingerprint of ASR.
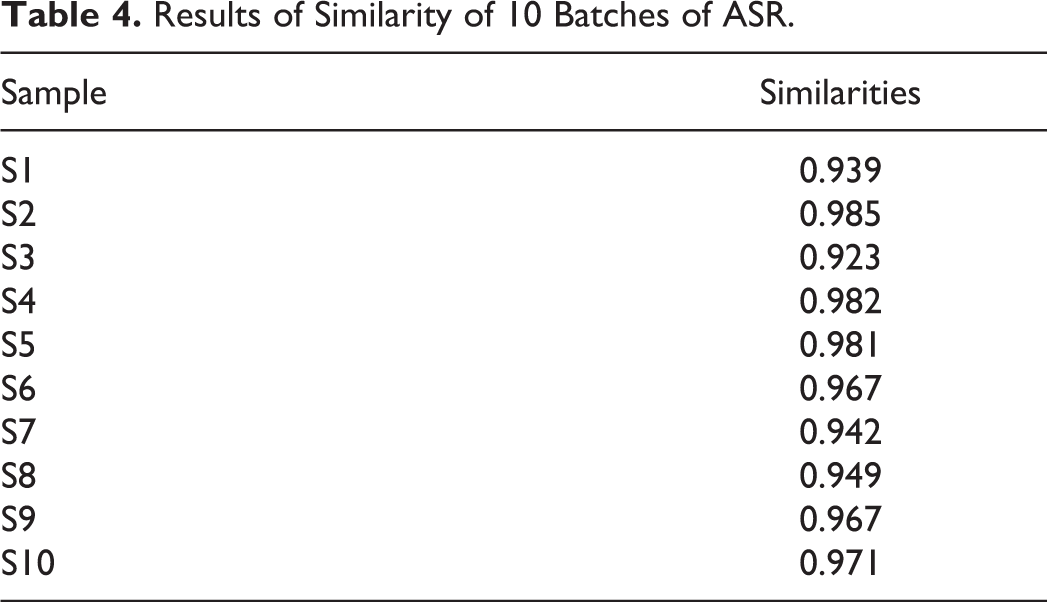
The similarity of chromatographic fingerprint data is indicated by the correlation coefficient (similarity). The closer the correlation coefficient is to1, the higher the similarity between the samples. As shown in Table 4, the similarity degrees of 10 batches of samples were more than 0.923. These results showed that all the samples from different origins were of good consistency, which can be used to comprehensively evaluate the overall quality of ASR.
Results of Similarity of 10 Batches of ASR.
Hierarchical cluster analysis (HCA)
HCA is a multivariate analysis method that displays complex raw data in a visual form and provides classification information for test samples. In this study, the samples of ASR were grouped by SPSS (version 22.0, SPSS Inc., Chicago, IL, USA), based on the clustering method of inter-group connections and the Squared Euclidean Distance interval.
In order to assess the resemblance and differences of these samples, a hierarchical agglomerative clustering analysis of ASR samples was performed based on the relative peak areas of all the 12 characteristics chromatographic peaks. The peak areas of characteristics constituents in 10 batches of ASR samples from various sources formed a matrix of 10 × 12. The results of HCA were shown in Figure 3, from which the quality characteristics were revealed more clearly.

HCA for 10 batches of ASR.
The results of the HCA showed that the 10 batches of ASR samples could be divided into 4 quality clusters. Among them, cluster I included the samples S4, S5, S2, S10, S1, S3 (Lot Nos. DG-18004, DG-18005, DG-18002, DG-18010, DG-18001, DG-18003).Cluster II obtained S6 (Lot No. DG-18006) and S9 (Lot No. DG-18009) was separately divided into Cluster III. S7 and S8 (Lot Nos. DG-18007and DG-18008) consisted of Cluster IV. From the results of cluster analysis, the fingerprints of ASR had certain relativity with geographic location and germplasm resources, but it is not absolutely related.
Principal component analysis (PCA)
As a statistical method of dimension reduction, PCA decomposes the covariance matrix to obtain the principal components (i.e., eigenvectors) of the data and their weights (i.e., eigenvalues), thereby recombining the original variables into a new set of independent comprehensive variables. According to the actual situation, extracting several eigenvectors that are in front of the eigenvalues reflect the main information of the original variables, which can simplify the complex problems. In this work, PCA was performed while using SPSS (version 22.0, SPSS Inc., Chicago, IL, USA).
As shown in Table 5, chromatographic peaks 1 and 2 had a larger positive correlation, the same as peaks 3, 4 and 5. The correlation of chromatographic peaks 6 (ferulic acid) and 7 were also positive with each other. Chromatographic peaks 8, 9 and 10 (senkyunolide I) have a larger positive correlation, as well as peaks 11and 12 (ligustilide).
Matrix of Correlation Coefficients.

The eigenvalue and variance contribution rate of the correlation coefficient were shown in Table 6 and Figure 4. Based on the eigenvalue > 1, the variance contribution rates of the first 3 principal components (PC1, PC2, PC3) were 59.156%, 21.332% and 9.087%, respectively, and the cumulative variance contribution rate was 89.575%.This showed that the 3 principal components contain most information of all the variables, and the original data were fully reflected.
Eigenvalue and Variance Contribution Rate.


Macadam figure of common factor.
According to the factor load matrix, it was inferred that the difference in quality of ASR was not a single component, but the result of the synergistic effect of multiple components. As shown in the loadings plot (Figure 5) and factor load matrix (Table 7), peaks 1, 4, 5, 6 (ferulic acid), 7 and 9 showed a higher contribution on PC 1. Peaks 2, 3and 8 represented the variables of PC 2, and the contribution of peaks 10 (senkyunolide I), 11, 12 (ligustilide) on PC 3 were obvious. These 12 peaks, especially for peaks 6 and 10 that showed further distance with other loadings, surmised to be the mainly chemical characteristic peaks used to distinguish the quality of different varieties of ASR.
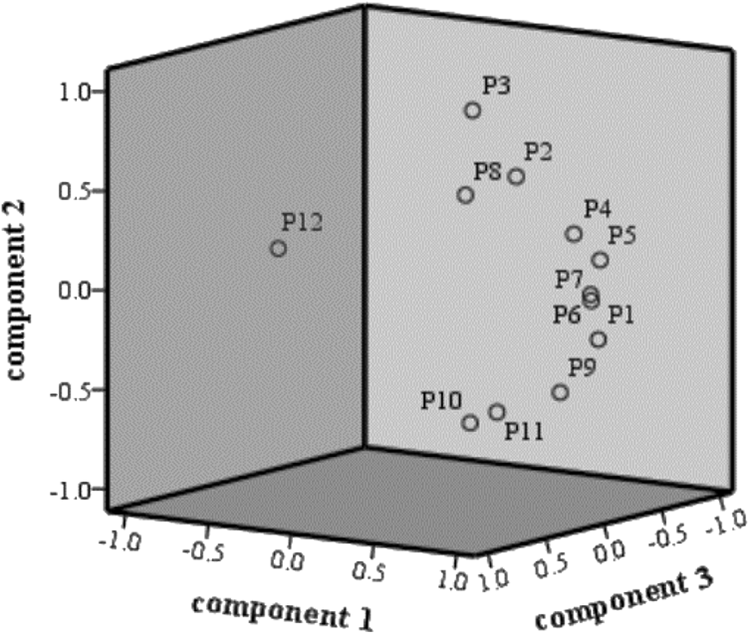
Loading plot of PCA, P means peak.
Factor Load Matrix.

Comprehensive evaluation of ASR from different regions
To make a comprehensive evaluation of ASR, 3 principal components were performed by building model. Based on the model, the principal component scores and comprehensive score values of 10 batches of ASR were calculated, as shown in Table 8. The higher the score, the better the quality. The result showed that S7, S8 and S9 (Lot Nos. DG-18007, DG-18008 and DG-18009) ranked among top 3 in all samples, which indicated that the quality of the 3 batches of ASR was better than others. Corresponding with the fingerprint information, the peak areas of the main components 1, 2, 5, 6, 7, 9, 10 and 11 were all larger in the fingerprints of the 3 batches of ASR. It can also prove that the 3 principal components extracted during principal component analysis can basically reflect all the information of the fingerprint. Combined with the analysis of cluster analysis results, the quality of S1 (Lot No. DG-18003) was poor and the others of ASR were better. The quality of S7 (Lot No. DG-18007) produced in Weiyuan County, Gansu was stood up from other samples. The results of comprehensive principal component analysis and cluster analysis were mutually consistent.
Rank of Principal Component Scores and Comprehensive Scores.

The differences in the quality of ASR from different sources may be due to the fact that different ecological environments (including soil, climate, moisture, and mineral distribution), which had certain effects on the quality of Chinese herbs. The natural ecological environment was closely related to the quality (formation and accumulation of effective ingredients) and quantity of traditional Chinese medicine resources. It was the objective basis for its ecological suitability evaluation and the key to the division of medicinal material production areas. Different batches of ASR were clustered according to the comprehensive principal component score. The clustering results were shown in Figure 6. As shown in Figure 6, the 10 batches of ASR samples could be divided into 4 quality clusters. Among them, cluster I included the samples S2, S6, S4, S5, S10 (Lot Nos. DG-18002, DG-18006, DG-18004, DG-1805, DG-18010). Cluster II obtained S2 (Lot No. DG-18002) and S3 (Lot No. DG-18003), in which comprehensive scores were ranked second and third among all samples. S1 and S3 (Lot Nos. DG-18001 and DG-18003) were divided into Cluster III. S7 (Lot No.DG-18007) produced in Weiyuan County, Gansu ranked first in the comprehensive scores, which was classified into Cluster IV. The results were almost consistent with HCA above with little different.

HCA of principal component for 10 batches of ASR.
Conclusions and Discussions
As the carrier of TCM theory as well as the main tool for clinical treatment, ACPTCM, is one of the breakthroughs in the development of TCM. For better application in treatment, it is important to ensure the stability of quality and effectiveness of preparations from ACPTCM, which means it must be of great significance to research deeply on investigating and controlling the quality of the medicinal materials, such as ASR, according to the traditional decoction process of ACPTCM. In this paper, our study offered an efficient and reliable approach for quality evaluation of ASR from different sources, by establishing a method combined with HPLC chromatographic fingerprint and chemometrics for Angelica Sinensis Radix (ASR) based on traditional decoction process of ACPTCM.
Compared with conventional analytical approaches, our research in the paper followed the traditional decoction process by taking water as the only solvent to prepare all the samples, and then made an analysis of ASR with chromatographic fingerprint and chemometrics. It demonstrated the approach can not only offered a powerful way to quality evaluation of ASR, but also might be a valuable reference for quality evaluation of ACPTCM preparations prepared by traditional decoction technology.
Footnotes
Acknowledgments
The authors gratefully acknowledge to all those who have offered me tremendous assistance in Nanjing University of Chinese Medicine.
Declaration of Conflicting Interests
The author(s) declared no potential conflicts of interest with respect to the research, authorship, and/or publication of this article.
Funding
The author(s) disclosed receipt of the following financial support for the research, authorship, and/or publication of this article: This work was supported by the National Natural Science Foundation of China (81773910, 81202922) and National Key R&D Program of China (2019YFC1710603).