
Abstract
Spherical nanoparticles (NPs) of cadmium and lead sulfides (diameter 37 ± 5 and 24 ± 4 nm, respectively) have been found to be cytotoxic for HL-1 cardiomyocytes as evidenced by decrease in adenosine triphosphate–dependent luminescence. Cadmium sulfide (CdS)-NPs were discovered to produce a much greater cytotoxic impact than lead sulphide (PbS)-NP. Given the same dose range, CdS-NP reduced the number of calcium spikes. A similar effect was observed for small doses of PbS-NP. In addition to cell hypertrophy under the impact of certain doses of CdS-NP and PbS-NP, doses causing cardiomyocyte size reduction were identified. For these 3 outcomes, we obtained both monotonic “dose–response” functions (well approximated by the hyperbolic function) and different variants of non-monotonic ones for which we found adequate mathematical expressions by modifying certain models of hormesis available in the literature. Data analysis using a response surface linear model with a cross-term provided new support to the previously established postulate that a diversity of types of joint action characteristic of one and the same pair of damaging agents is one of the important assertions of the general theory of combined toxicity.
Introduction
Experimental modeling of the cytotoxicity of element and element-oxide nanoparticles (NPs) on cell cultures (most often cultures of established cell lines) has been widely used over many years in nanotoxicological studies 1 -7 and a great number of others. The absolute majority of these studies consider one particular NP species. Only some of them assess comparatively the effects of 2 or more chemically different NP species. 6,7
However, to the best of our knowledge, we were the first 8 to publish the results of modeling (both in vitro and in silico) not only the comparative but also the combined cytotoxicity of a pair of NPs (specifically, NiO-NP and Mn3O4-NP). Moreover, we performed our study on several human cell lines and assessed the cytotoxic action in relation to both nonspecific effects and effects that are specific to one of the lines only. The second such study was conducted on human fibroblast-like cells under the impact of lead-oxide-NP and copper oxide-NP, each alone or both in a combination. 9
One of the principal conclusions following from both these studies states that the types of binary combined cytotoxicity are not uniquely defined (depending on the type of cell, its functional condition, and index assessed) as is the case with organ and system toxicity characterized in animal experiments 10 and others.
Metal nanotoxicology has drawn growing attention recently not only because engineered NPs are manufactured for various applications but also because condensation aerosols generated by arc welding, metallurgy, laser, and other technologies usually contain a substantial fraction of nanoscale (ultrafine) particles in the overall particle size distribution. In all such instances, workers are usually exposed to different combinations of metal-containing NPs rather than to single NP species. 11 Therefore, while continuing to use cellular models, experimental nanotoxicology cannot but expand research into the issue of combined effects of particles not only in vivo but also using such models.
By way of pursuing further research along this line, we decided to choose as our next object of study the combination of lead and cadmium NPs as typical of harmful exposures in copper smelting industry. The test system of choice for exposure was NP incubation with cells pertaining to the cardiovascular system, in particular with various cardiomyocyte lines. The rationale for this choice is the fact that the relationship between occupational or environmental exposures to lead and cadmium (irrespective of their chemical or physical form) and different cardiovascular diseases or conditions has been a topical issue over decades, still widely discussed but still far from a unanimous resolution. We would not like to overload this Introduction section with a relevant literature overview, even a brief one. The reader is referred to a recent paper that contains such an overview as well as the authors’ new experimental (in vivo) data on the issue under study. 12
There are few published studies demonstrating effects of any NPs on cardiomyocytes. In addition to cytotoxicity, reduced contraction amplitudes (with TiO2-NPs 13 ), enhanced beating properties (with mesoporous SiO2-NPs 14 ), interference with ion channels (with Pt-NPs 15 ), and increased Ca2+ spikes and local Ca2+ flux (chitosan NPs 16 ) have been reported. The 2016 overview devoted specially to NPs that cardiotoxicity considers such NP species as zinc, titanium, silver, carbon, silica, and iron oxide but does not mention lead or cadmium in any chemical form. 17
Study of adult cardiomyocytes physiology presents difficult because isolated cardiomyocytes do not divide in culture. Furthermore, yields are usually low, which is due to the high sensitivity to hypoxia and to enzymatic digestion of the cells and testing of many samples is difficult. 18 Although embryonic stem cells and induced pluripotent stem cells are able to differentiate into cardiomyocytes in vitro, the efficiency of this process is low. Primary explant cultures are heterogeneous and often show poor reproducibility in toxicity testing. 19 Embryonic and neonatal rat cardiomyocytes lack many features of adult cardiomyocytes. Moreover, within a few days, embryonic cardiomyocytes cease to divide after the neonatal period. The use of murine embryonic stem cells, as alternative model, presents the problem that no highly enriched populations can be obtained. Cessation of cell division is another problem. 20 Repolarization mechanism differs enormously between species, particularly between small laboratory rodents and humans. Therefore, the use of human-induced embryonic or pluripotent stem cells is the most recommended model for identification of cardiotoxicity in humans in vitro. The limitation is that the low yields of cells do not enable high-throughput testing.
Keeping in mind all these difficulties, we have chosen for our experiment a cardiac muscle cell line HL-1 cells which, even though not reflecting adequately the physiology of human adult cardiomyocytes, still are established as a usable example for the testing of cardiotoxicity.
The present article describes the first experimental study into the in vitro comparative and combined cardiotoxicity of lead- and cadmium-containing inorganic NPs and mathematical treatment of its results.
Materials and Methods
Preparation and Characterization of NPs
Suspensions of NPs were prepared by laser ablation of 99.9% pure cadmium sulfide (CdS)-NP and lead sulphide (PbS)-NP targets in deionized water with concentration 0.05 mg/mL. The scanning electron microscope (SEM) Merlin (Carl Zeiss, Germany) was used for direct visualization of NPs. Nanoparticles of both types were mostly of irregular but close to spherical shape (Figure 1). The size distribution functions were obtained by a statistical analysis of SEM images of 250 CdS NPs and 450 PbS NPs. The mean diameters were determined to be 37 ± 5 nm for CdS-NP and 24 ± 4 nm for PbS-NP (Figure 2). Energy-dispersive X-ray spectroscopy performed in conjunction with SEM showed the chemical composition of the NPs to be exactly CdS-NP and PbS-NP.

Scanning electron microscope visualization of (A) CdS-NPs and (B) PbS-NPs. CdS-NPs indicates cadmium sulfide nanoparticles; PbS-NPs, lead sulphide nanoparticles.

NP size distribution functions for (A) CdS-NPs and (B) PbS-NPs. CdS-NP indicates cadmium sulfide nanoparticles; PbS-NPs, lead sulphide nanoparticles.
The absence of any noticeable changes in the zeta potential as well as in the shape and position of the plasmon resonance peak 2 weeks after suspension preparation confirmed the satisfactory stability of the suspensions.
Nanoparticle solubility in a liquid medium was estimated by the kinetics of concentration reduction measured by the method of optical photometry with the help of a double-beam high-performance spectrophotometer Cary 5000 (Agilent Technologies, Santa Clara, California, United States). The NP suspension was mixed with a liquid (water or Claycomb medium) in 1:1 ratio. The differences between the transmission spectra of this mixture and the liquid without particles were measured in a spectral wavelength range of 200 to 800 nm in certain intervals. Characteristic changes in the spectra were observed in a spectral range of 230 to 280 nm. Numerical integration of the spectra was carried out in this range. The integral intensity of the signal was proportional to the concentration of NPs in the solution.
Cell Line Characterization, In Vitro Exposure Technique and Parameters, and Cytotoxicity Estimates
Experiments were implemented on HL-1 cells derived from the AT-1 mouse atrial cardiomyocyte tumor lineage characterized in. 21 This established line had been described as mitotically active cardiac muscle cells showing highly ordered myofibrils and cardiac-specific junctions in the form of intercalated discs. They are able to undergo spontaneous contractions and express atrial natriuretic factor, α-myosin heavy chain, α-cardiac actin, desmin, and connexin 43. Furthermore, they present several voltage-dependent currents that are characteristic of the cardiac myocyte phenotype.
HL-1 cells have been used for studying the normal cardiomyocyte function with regard to signaling, electrical, metabolic, and transcriptional regulation and the reaction of cardiomyocytes to hypoxia, hyperglycemia–hyperinsulinemia, apoptosis, and ischemia–reperfusion. 20 They have also been used in in vitro models to study cardiac hypertrophy induced by aldosterone 22 and by endothelin-1 or norepinephrine, 23 with the upregulation of cardiotrophin-1 identified as its mechanism. 22 To study cardiac hypertrophy, HL-1 cells have to be precultured in a depleted medium because the routine medium for enabling spontaneous beating contains norepinephrine, which is a hypertrophic stimulus. 24
For our experiments, HL-1 cells were obtained from Sigma Aldrich and cultured in Claycomb medium (Sigma), 10% fetal bovine serum, 2 mM
Choosing cytotoxicity indicators
As well as in our previous studies mentioned above, 8,9 we were primarily interested in estimating quantitatively the nonspecific cytotoxicity of the NP species under study for the cells of the line used. Of the various assays that were available for this assessment and, in particular, used by us previously, we opted for the measurement of adenosine triphosphate (ATP)–dependent luminescence in cell culture. Like any other indicator used for a similar purpose, this assay provides reference points for selecting an appropriate dose range in which to identify the functional effects of exposure that are specific to the cardiomyocyte. At the same time, it is particularly relevant to the study of cardiotoxicity mechanisms because it has been shown that under subchronic lead intoxication, the in vitro contractile activity of muscle preparations extracted from rat myocardium undergoes a number of essential changes. 25 Meantime, one of the possible hypotheses concerning the mechanisms of decreased cardiomyocyte contractility under different NP impacts might be decreased ATP levels due to mitochondrial damage and dysfunction. 26
As concerns the effects of NP exposure which might be considered really specific to cardiomyocytes, we sought to identify possible changes in 2 indices: mean cell size and frequency of Ca2+ spikes.
Although cardiac hypertrophy in vivo may occur as an adaption to changes in vascular resistance (including those induced by lead intoxication 12 ), it is highly interesting to see whether it can also be due to damage in the cardiomyocyte caused by toxic metals in the form of NPs. Meantime, as far as we know, the effects of any NPs on cardiomyocyte hypertrophy in vitro have not yet been studied.
The so-called calcium spikes occur in response to each electric stimulus applied to the cardiomyocyte. They reflect the Ca2+ transient, that is, the balance of various Ca2+ ion flows into and out of the cytosol and their binding by intracellular ligands. The main flow into the cytosol comes from the intracellular calcium depot in the sarcoplasmic reticulum (SR). Calcium is transferred back into the SR against the concentration gradient at the expense of the energy derived from ATP hydrolysis by the Ca2+-ATPase located in the SR membrane. The main intracellular calcium-binding ligand is troponin C, protein distributed along the actin filaments of the sarcomere. When calcium–troponin complexes form, centers for the attachment of force-generating myosin cross-bridges are opened on the actin. Thus, free calcium in the cytosol represented by the Ca2+ transient is the principal dynamic regulator of cardiomyocytes contractile activity. 27,28
Experimental techniques
Adenosine triphosphate assay
4 × 10⁴ HL-1 cells per a well of 96-well plates were seeded 24 hours prior to their exposure to NPs either in complete Claycomb medium or in a depleted medium as used for hypertrophy measurements (see below). Particle suspensions were acting on the cells for 24 hours. As positive control, 1% triton X100 was used. In addition, interference controls (particles without cells) and solvent controls (water) were included. Adenosine triphosphate content was determined using CellTiter-Glo Luminescent Cell Viability Assay (Promega, Madison, Wisconsin, USA) according to the manufacturer’s instruction. The plates were equilibrated to room temperature for approximately 30 minutes, and reconstituted CellTiter-Glo Reagent was added 1:1 to the amount of cell culture medium present in each well. The plates were shaken for 2 minutes and incubated for additional 10 minutes at room temperature before transferring the well contents to a luminescence compatible 96-well plate, and luminescence expressed in arbitrary fluorescence units (AFU) was read on a Lumistar (BMG LabTech, Germany). Testing was performed in triplicates.
Hypertrophy measurements
HL-1 cells were grown in Claycomb medium without norepinephrine for 14 days to induce their responsibility to hypertrophic agents according to. 23 3 × 10⁴ HL-1 cells were seeded in 24-well plates 24 hours prior to the experiments and exposed to samples and positive controls (100 nM endothelin 1 and 10 µM norepinephrine, Sigma Aldrich) for 18 hours. Medium-exposed cells served as negative control. CellMask deep red plasma membrane stain (Life Techologies, Poggersdorf, Austria) and Hoechst 33342 were added for 10 minutes at 37°C, and cells subsequently fixed with 4% paraformaldehyde for 10 minutes. Staining was performed according to the manual of the manufacturer. Analysis was performed with Nikon NIS Elements software. 29
Cells were viewed at confocal high content screening system (Nikon CEE GmbH, Austria) with 395 nm/414 to 450 nm for Hoechst 33342 and 640 nm/660 to 850 nm for CellMask. Images were analyzed using NIS Elements software with JOBS module. Experiments were performed in triplicates, and 4 fields of view (= 1 827 038 µm2) were analyzed per sample. Cellular area/cell was measured.
Detection of calcium spikes
In this technique, intracellular calcium fluxes are visualized by fluorescent reporter dyes, ratiometric calcium indicators like the Fura dyes or nonratiometric dyes such as the fluorescent dyes. All these indicators have slight adverse effects on cell physiology, but we chose the EarlyTox Cardiotoxicity Kit from Molecular Devices (San-Jose, California, USA), which was reported to be less toxic than the conventional dyes.
1 × 10⁵ HL-1 cells were seeded per well of 96-well plate 24 hours prior to the exposure. Samples in different dilutions and positive control (40-µM propranolol hydrochloride, VWR, Radnor, Pennsylvania, USA) and EarlyTox Cardiotoxicity Kit (Molecular Devices, San-Jose, California, USA) were added for 2 hours at 37°C according to the manufacturer’s protocol. 30 Spontaneous calcium transients were captured in single cells at Ex 470 nm/Em 500-530 nm for 30 seconds using a Nikon high content screening system (Nikon CEE GmbH) prior and after the addition of samples and positive control. After subtraction of the background, the number of spikes (only those with amplitudes >30 AFU) per 30 seconds was manually counted before and after the treatment. 31 Testing was performed in triplicates.
Mathematical Description of the Experimental Results
The first step in the formal analysis of the above-described experiments was a search for analytical dependence of the effect on dose. Such mathematical modeling is often used not only as one of the preconditions to discussion of toxicodynamic mechanisms but also for tentative prediction of the effects a poison could produce in dose ranges that were not used in the actual experiment.
However, the experimental data were obtained in 2 experiments of different design, so they need to be considered separately. On the one hand, these are data on the exposure of the cell culture to CdS-NP and PbS-NP separately, recorded by 3 different indices considered in section “Cell Line Characterization, In Vitro Exposure Technique and Parameters, and Cytotoxicity Estimates.” On the other hand, these substances were studied for their combined action as well, which requires special methods for their mathematical description.
Mathematical description of an impact produced by a single agent means approximating the dose–response relationship for a certain specific end point of this impact by a function of one variable, that is, dose of the agent. A combined action should be described by a similar function depending on the doses of both substances involved.
For both isolated and combined impacts, the choice of an appropriate approximation presents a difficult nonformalizable problem; however, for demonstrating how successfully it has been resolved, one can estimate the quality of the approximation, for example, the correlation coefficient R between observed and expected response values. For dose–response models, this may also be visually shown as charts comparing the positions of the group-mean values of the response to all experimental doses relative to the approximating curve.
Modeling the dose–response dependence with special attention to possible hormesis
The dose–response dependence is often of a monotonic character and is described by an S-shaped curve 32 (sigmoid function). The analytical expression of this dependence may be represented, for example, by the Hill model, as well as by many other models, for instance, those associated with cumulative probability distribution functions (eg, logistic, error, and probit functions). The Hill model is also connected with probability distribution since the right-hand part of equation (1) is proportional to the cumulative function of the log-logistic distribution 33 -35 :

Furthermore, for describing a monotonic case, often a sufficiently good approximation is ensured by a simple hyperbolic function of the form:

An interesting feature of this model is that it presents a more general expression of the Michaelis–Menten equation, which describes the rate of enzymatic reactions. 36 Equation (2) is different from the Michaelis–Menten equation in that it contains a term b 0, which is determined by the presence of a nonzero value of the response in the untreated group (control). Clearly, the hyperbolic model (2) may be represented as a Michaelis–Menten equation by just shift of the response by the amount of the control group’s value and, possibly, by reversing the sign.
Note also that the hyperbolic model (2) itself has a number of applications in constructing the dependence of biological indicators on various parameters. 37 It is well known, however, that the response of a biological system to a relatively low and high level of impact could be directed oppositely. 38 With reference to dose-dependent pharmacological and toxicological effects, this paradox was formulated as the so-called Arndt-Schulz rule, which states that “for every substance, small doses stimulate, moderate doses inhibit, large doses kill.” As is known, this statement served as a theoretical foundation for homeopathy, although it aroused powerful and unrelenting criticisms among scientists. 39 -42
The further development of these ideas was associated with the work, 43 in which the term hormesis was proposed for the first time. Since then, it has been widely known as one of the conceptual models for the response of the organism to external impacts. It should be noted, however, that the real effects of hormesis are less sustainable and reproducible than typical unambiguous dose-dependent effects of an impact. Moreover, mechanisms underlying such paradoxical effects cannot always be explained rationally.
The most popular conception of hormesis is its abovementioned interpretation as a stimulating effect of small doses in contrast to the inhibiting effect of high ones. However, it is not always clear which effect is favorable and which one is adverse. This question was effectively circumvented by the following generalized definition: “Hormesis is a dose-response relationship for a single end point that is characterized by reversal of response between low and high doses of chemicals, biological molecules, physical stressors, or any other initiators of a response.” 42(p238)
Different forms of analytical representation of hormetic dose–response relationships have been presented in an extensive body of literature. 44 -51 The expressions used in these studies for approximating experimental data adequately are sometimes rather complicated depending on the results of a specific study. An impression arises that there is, in principle, no mathematical model such that would be applicable in all or, at least, in the majority of cases where hormesis is discovered in particular experiments.
The simplest model for describing hormesis seems to be the one by Brain and Cousens, 49 which is obtained by adding a dose-linear term into equation (1), giving:

This model is known to have numerous modifications, overviewed, for example. 47 Thus, in particular, the study 50 presents a more complex model based on equation (3), which can overcome some of the limitations of model (3). The equation of this model is given by:

Nevertheless, there are cases for which none of these models provides an acceptable result. We came across such a case when analyzing some of our own experimental results and so had to search for modified models that would enable us to solve the problem.
First of all, we present here as an interim variant the following model, which is a generalization of model (3) while remaining, unlike equation (4), within the power law dependence:

Depending on the parameters of model (5), it describes various models of both monotonic and hormetic dependencies. The modification (6) is also derived from the power law only, being given by:

In some cases, equation (6) was found to be more convenient than the hormesis models available in the literature. However, a more detailed analysis showed that, along with model (6), we had to consider the following one:

which may prove more adequate for the case where small doses are associated with a decrease in the response rather than its increase.
Algebraically, equations (6) and (7) have a simpler structure than some other equations of hormesis, such as ones employing Gompertz or Weibull distribution. 46,47 The number of parameters to be adjusted in equations (6) and (7) is fairly large (8!), which increases the flexibility of these models though makes the interpretation of individual parameters more difficult. For instance, for model (3), the statistical test for the presence of hormesis consists in checking the hypothesis H0: b 2 = 0. If this hypothesis is true, there are no grounds to claim that there is hormesis in the dose–response relationship. On the contrary, for equations (6) and (7), the parameters that ensure hormesis enter the equations in such a way that it is rather difficult to unambiguously formulate conditions for coefficients that would guarantee the occurrence of a characteristic hormetic curve. For instance, even if all coefficients b 1, b 2, and b 6 were positive and significantly different from 0, function (6) could be monotonic, although with inflection points.
Models (6) and (7) are complex, and it is impossible to obtain explicit expressions in general form for the effective dosage reducing the response by 50% or any other percentage. It is clear, though, that the magnitude of b 0 + b 1 for both models (6) and (7) is equal to the magnitude of the control value of the response. Nevertheless, in each specific case where equation (6) or (7) describes adequately the experimental data, all essential values may be found numerically.
As a general case, of interest are the statistical properties of estimates for the parameters b 0,…, b 7 in models (6) and (7), for instance, joint confidence regions. Models (6) and (7) describe a nonlinear regression whose parameters could be estimated by standard tools. 52 The need to perform calculations using explicit formulas 52 does not arise often because these methods are implemented in standard statistical or general mathematical packages (computer algebra systems). However, where the conditions of applicability for these formulas are violated, there may be a need to use alternative ways of assessing the uncertainty of the resulting estimates. Among these methods, we could mention bootstrap confidence intervals, 53 prediction intervals with neural networks, 54,55 and Bayesian framework. 56 All these methods also have realizations in some computation systems, for instance, in the R statistical system. 57
Modeling binary combined action
In our first study of combined toxicity, 58 we analyzed experimental results using different mathematical models based on (1) analysis of variance and (2) Mathematical Theory of Experimental Design, which correspond to the well-known paradigms of effect additivity and dose additivity (Loewe additivity), respectively. Having proved that assignment of experimental results to this of that type of combined toxicity is model-insensitive, in our further studies beginning from the study by Panov et al, 59 we used mostly the Response Surface Methodology (RSM), which generalizes those traditional paradigms. 60,61 In this methodology, an equation (8) describing the response surface Y = Y(x 1, x 2) can be constructed by fitting its coefficients to experimental data.

where Y is a quantitative end point of a toxic exposure; x 1 and x 2 are doses of the toxicants participating in the combination; and f(x 1, x 2) is a regression function with some numeric parameters. In the case of 2-level exposures (even if one of the levels is equal to 0), the nonlinear response surface may have only one possible shape, namely, hyperbolic paraboloid. 62 It is inferred that 2 agents produce a unidirectional effect on end point Y if both 1-way response functions Y(x 1, 0) and Y(0, x 2) either increase or decrease with an increase in x 1 or x 2. On the contrary, 2 agents are assumed to be acting contradirectionally (oppositely) if one function increases while the other decreases. This mathematical model enables one to predict the magnitude of response Y for any combination of toxicant doses within the experimental range for each of them (rather than at 2 factual points only). The sectioning of the response surface on different levels corresponding to different meanings of the outcome Y or of the doses x provides a family of Loewe isoboles that may have one and the same or different forms and/or different slopes and thus render the interpretation of binary combined toxicity types both easy and illustrative. We, therefore, discuss the results of analysis presented just in this form.
Results and Discussion
Cardiotoxicity is an important dose-limiting side effect of various anticancer agents and one of the leading causes of drug withdrawals. The best-known examples for cardiotoxic drugs include anthracyclines (eg, doxorubicin), 5-fluorouracil, taxanes (eg, paclitaxel), monoclonal antibodies (eg, trastuzumab), and tyrosine kinase inhibitors 63 (eg, sunitinib). The current recommended procedure by the US Food and Drug Administration is to identify potential cardiotoxic drugs in vitro using the human ether-a-go-go–related gene (hERG) assay, which is performed with nonmyocyte HEK293 cells. The cells are transfected with the gene that encodes the pore-forming subunit of the rapidly activating delayed rectifier K+ channel (I Kr), which plays an important role in the repolarization of cardiac action potentials. 64 The assays used in this study may also be useful as alternative testing methods in preclinical drug development.
Dose–Response Relationships for Single-Factor Exposures
Decrease in ATP-dependent luminescence
The experimental data on the relationship between ATP-dependent luminescence decrease in a culture of cardiomyocytes and CdS-NP dose are of a usual monotonic character, which can be approximated by many functional expressions. As well as in our previous studies, 8,9 in this case, too, we found the most suitable approximation to be a hyperbolic function of the form (2), the parameters of which are fitted by the least squares method. For this end point, expressed as a percentage relative to the control value rather than in absolute AFU, model (2) predicts the kinetics of its decrease shown by the curve in Figure 3.

Approximation, by model (2), of the reduction in adenosine triphosphate–dependent luminescence in the HL-1 cell culture under exposure to various doses of CdS-NP. The abscissa plots the acting concentrations of nanoparticles in the incubation medium, milligram per milliliter; the ordinate plots the values of the arbitrary fluorescence units index in the exposed group as a percentage of the control value. The dots indicate the mean values with the standard error of the mean. CdS-NPs indicates cadmium sulfide nanoparticles.
As follows from the chart, the approximating curve describes the change in the AFU index quite well, demonstrating a sharp drop in it toward the maximal dose of the range tested at 3.75 mg/mL.
For the second agent PbS-NP, however, the behavior of the relative value of AFU looks quite different (Figure 4). The sharp drop in the magnitude of the response at a dose of 0.9 mg/mL goes far beyond the level of a possible error in contrast to the 3 next doses, for which the standard error ranges overlap.
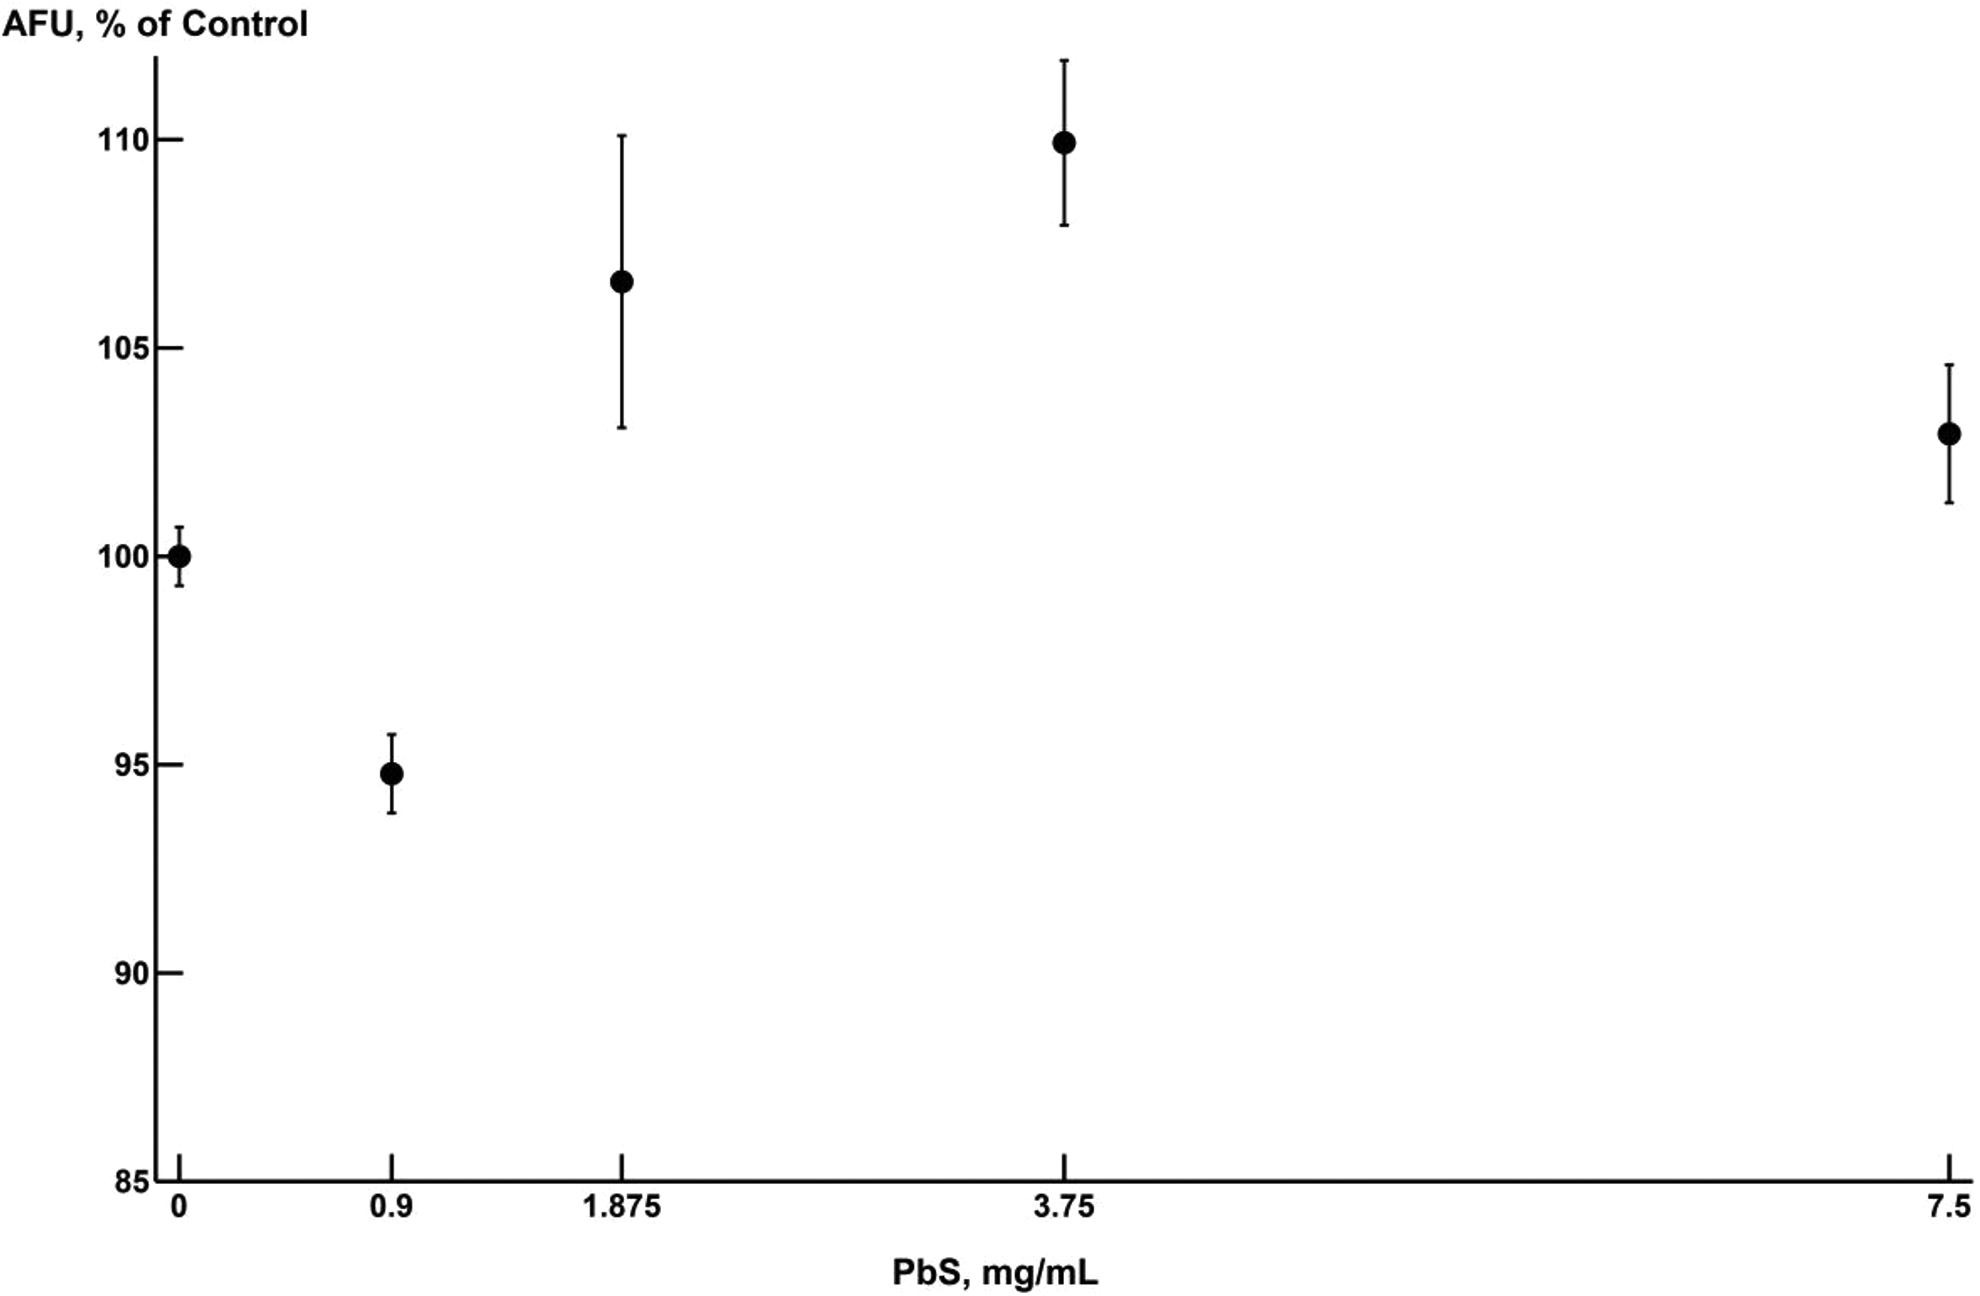
Group-mean values of adenosine triphosphate–dependent luminescence in the HL-1 cell culture under exposure to various doses of PbS-NP. The abscissa plots the concentrations of nanoparticles in the incubation medium, milligram per milliliter; the ordinate plots the values of arbitrary fluorescence units in the exposed group as a percentage of the control group value. The dots indicate the mean values with the standard errors of the mean. PbS-NPs indicates lead sulphide nanoparticles.
Note, however, that even if we did not consider the value of Y at x = 0.9 mg/mL, the fact that the response level exceeds the control group value at subsequent doses excludes the possibility of describing the dependence of AFU on PbS-NP dose monotonically. It may be expected that as the dose of PbS-NP is increased, the response would decrease and then stabilize at a certain value. In other words, for PbS-NP = 0.9 mg/mL, the behavior of the response is opposite to its behavior at higher doses, manifesting signs of hormesis.
Thus, for describing the dose–response dependence of the relative value of AFU on exposure to PbS-NP, it is necessary to use one of the models of nonmonotonic dependence. As computations showed, none of the models that we found in the literature 41 -50 provided a satisfactory description of the assumed dependence. At the same time, model (7) proves to be quite suitable (see Figure 5).

Approximation, by model (7), of the reduction in adenosine triphosphate–dependent luminescence in the HL-1 cell culture under exposure to various doses of PbS-NP. The abscissa plots the concentrations of nanoparticles in the incubation medium, milligram per milliliter; the ordinate plots the values of arbitrary fluorescence units in the exposed group as a percentage of the control group value. The dots indicate the mean values with the standard error of the mean. PbS-NPs indicates lead sulphide nanoparticles.
For comparing different hermetic curves, we can use quantitative indicators proposed in 65 (see also the study by Belz and Piepho 45 ). Knowledge of such general characteristics makes it possible to compare various cases of hormesis, as was done in the stusy by Calabrese and Blain. 66 In our case, these characteristics are as follows:
Zones of hormesis: 0.12 to 0.65 mg/mL and 2.90 to 3.66 mg/mL. (For computation, we used the value of 90% of the control for the region before 0.9 mg/mL and 110% of the control for the region after 0.9 mg/mL.)


It should be emphasized that in the case under consideration, the order of alternation of the first 2 phases in the dose–response relationship (first toward reduction in luminescence and then, at medium range doses, toward its stimulation) contradicts the Arndt-Schulz rule and thus the most popular understanding of hormesis; however, it is in agreement with its more generalized definition 42 cited in the Introduction section.
At the same time, model (7) predicts a secondary drop in the response not only in the actual range of doses from 3.75 to 7.5 mg/mL, for which it was really shown in our experiment, but also for their subsequent increasing. The latter requires an experimental verification and, particularly, an attempt to comprehend the toxicological meaning and possible mechanisms of such a paradoxical dose–response relationship.
We are aware of only 2 experimental studies 67,68 which report a similar 3-phase dependence (enhancement, attenuation, secondary enhancement) of apoptosis in zebrafish embryos on the dose of proton irradiation. Thus, such dependence really exists, although it does not seem to be encountered that often. It is probably therefore that we have not found any theoretical discussions of it in the publications on hormesis in general that are known to us. Note, in particular, that the possibility of alternating changes of direction in the response with an increase in dose is not even mentioned in the definitions of hormesis referred to in the Introduction section.
We may assume that the development of even one and the same end point of intoxication may have different underlying mechanisms, one or another of them prevailing at different exposure levels (doses). For instance, the impact of metallic NPs on the ATP content of a cell culture may be associated both with a 2-phase impact on the level of oxidative phosphorylation controlled by mitochondria (note 1) and with the reducing number of viable cells. The latter prevails at high doses of PbS-NP and even at much lower doses of more cytotoxic CdS-NP. Indeed, based on the equations used for describing the dependence of the cytotoxic effect on the concentration of NPs in the incubation medium, we estimated the moderately effective exposure as one for which 50% inhibition of ATP-dependent luminescence should be expected. It proved to be equal to 3.6 mg/mL for CdS-NP (note 2) and 153.97 mg/mL for PbS-NP. Possibly, the higher cytotoxicity of CdS-NP is partly associated with their markedly higher dissolution in the incubation medium, which is shown in a special experiment (Figure 6).
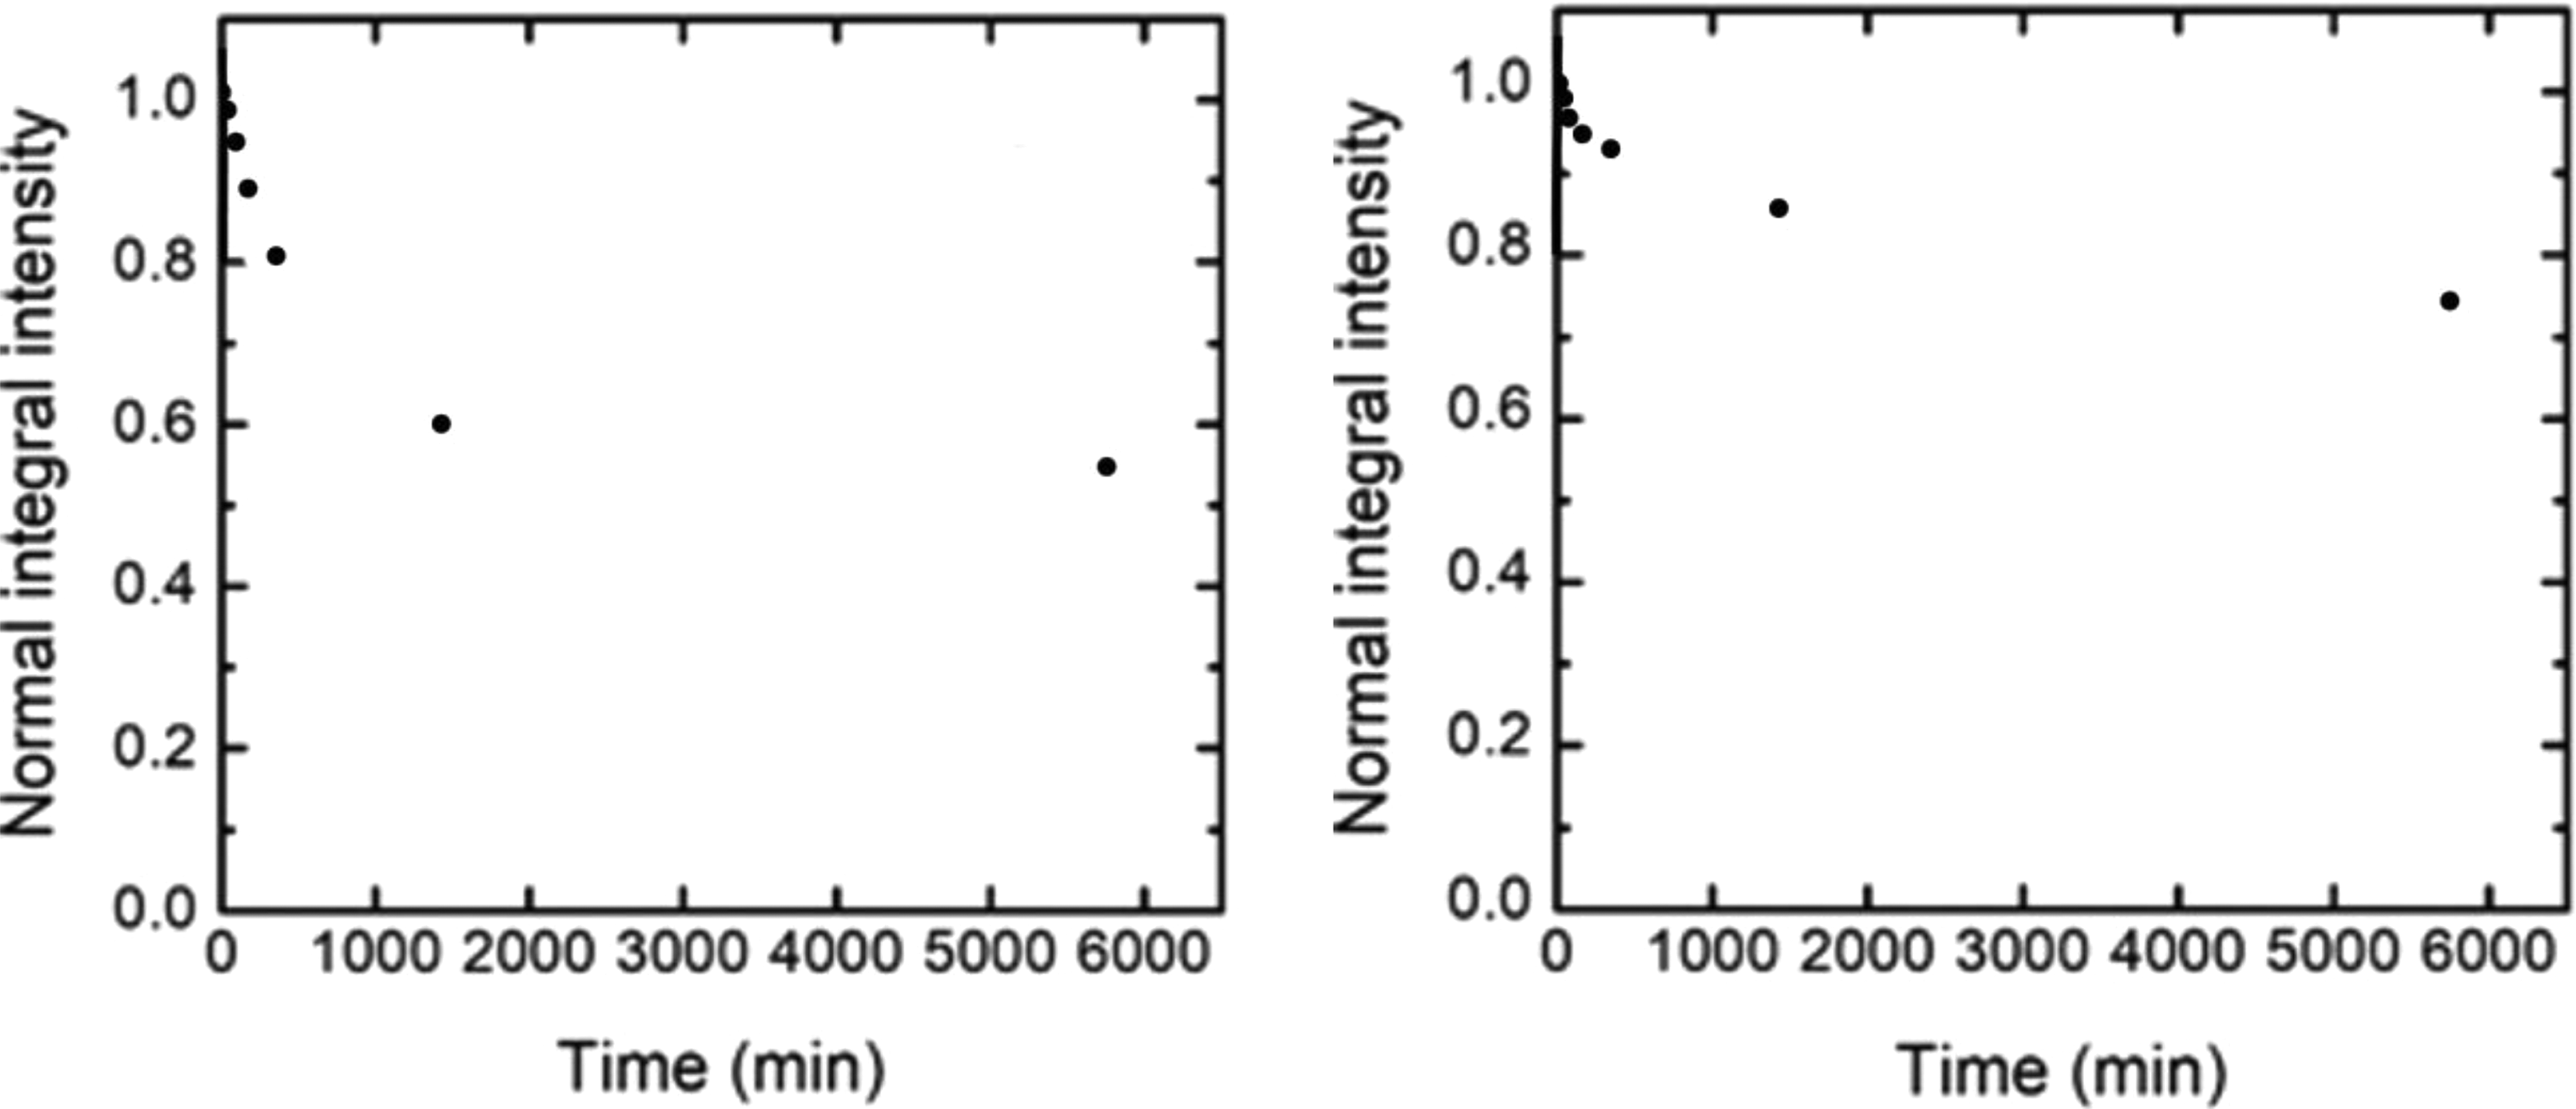
The kinetics of nanoparticle concentration reduction (CdS-NP on the left; PbS-NP on the right) in the suspension after adding an equal volume of complete Claycomb medium to it. For the measurement procedure, see section “Preparation and Characterization of NPs.” CdS-NPs indicates cadmium sulfide nanoparticles; PbS-NPs, lead sulphide nanoparticles.
Note, however, that comparative animal experiments with preformed solutions of cadmium and lead salts also revealed a considerably higher subchronic systemic toxicity and cardiotoxicity of cadmium. 12
Inhibition of calcium spikes
For the index “number of calcium spikes,” the behavior of the dose–response relationship under exposure to CdS-NP (see Figure 7) is about the same as in the above-considered relative value of AFU. In this case, there is also a monotonically decreasing dependence, which is well described by a simple hyperbolic function (2).

Approximation, by model (2), of the decrease in the frequency of calcium spikes in the HL-1 cell culture under exposure to various doses of CdS-NP. The abscissa plots the acting concentrations of nanoparticles in the incubation medium, milligram per milliliter; the ordinate plots the values of the index “number of Ca2+ spikes with amplitudes >30 arbitrary fluorescence units per 30 seconds”). The dots indicate the mean values with the standard error of the mean. CdS-NPs indicates cadmium sulfide nanoparticles.
Regrettably, for the PbS-NP exposure, there are only 3 doses available (including the control group), which does not allow the dose–response relationship to be correctly represented in the range of experimental doses. However, there are grounds to assume that there is hormesis in this case (as well as in the case of culture luminescence reduction); since in the dose range of 3 to 3.5 mg/mL, the response increases sharply while being somewhat reduced under the action of smaller doses (see Figure 8).

The frequency of calcium spikes in the HL-1 cell culture under exposure to various doses of PbS-NP. The abscissa plots the acting concentrations of nanoparticles in the incubation medium, milligram per milliliter; the ordinate plots the values of the index “number of Ca2+ spikes with amplitudes >30 arbitrary fluorescence units per 30 seconds”). The dots show the mean values with the standard error of the mean. PbS-NPs indicates lead sulphide nanoparticles.
Effect on cardiomyocyte size
As well as in the case of the above-considered indices, the effect of CdS-NP on the average area of the cell in the range of 0 to 3.5 mg/mL is rather pronounced, while for PbS-NP in the range of 0 to 7.5 mg/mL, it is markedly weaker (Figures 9 to 11). For both agents, the sign of the response is different for different dose ranges. Meanwhile, in experiments in vivo 12 involving moderate subchronic intoxications with the same metals in ionic form, lead caused a significant increase in the average thickness of the cardiomyocyte, whereas cadmium caused a significant decrease in it with histological signs of apoptosis.
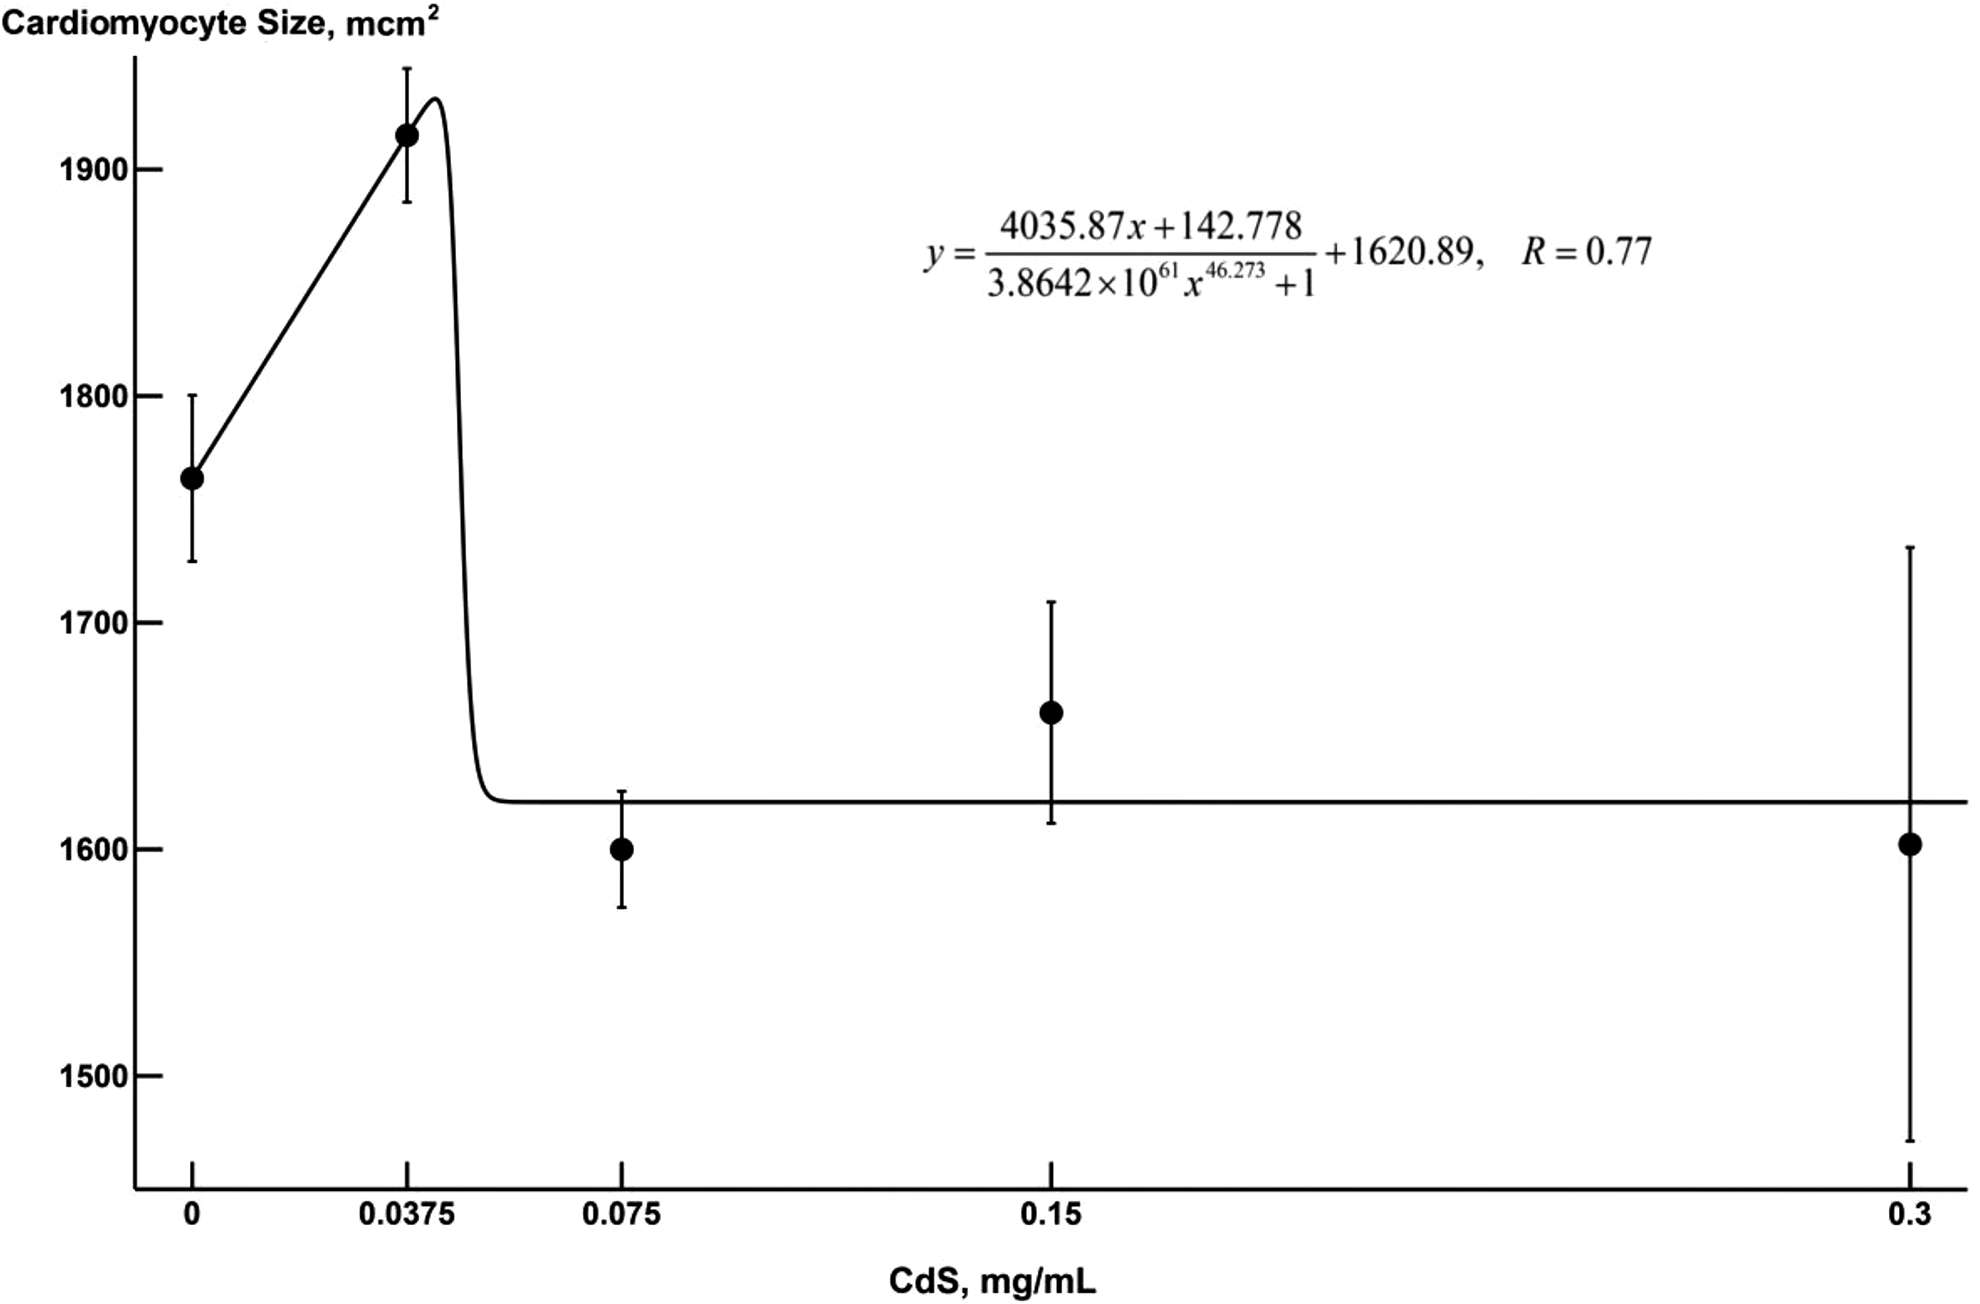
Approximation, by model (3), of the dependence of the mean cell size in the HL-1 cell culture under exposure to various doses of CdS-NP. The abscissa plots the acting concentrations of nanoparticles in the incubation medium, milligram per milliliter; the ordinate plots the mean area in square micrometer. The dots indicate the mean values with the standard errors of the mean. CdS-NPs indicates cadmium sulfide nanoparticles.
In the in vitro experiment under consideration, the response of the cardiomyocyte culture to the impact of CdS-NP was characterized by explicit hormesis, which manifested itself in an increase in the mean size of the cell in response to small doses of NPs and a decrease in its size in the medium range of doses and a rather rapid stabilization of this index (Figure 9). This behavior is sufficiently well approximated by model (3), as well as by model (6), whose charts are about similar. (Figure 9 shows the approximation to the dose–response relationship by model 3)
The characteristics of this hormesis curve are as follows:


Under exposure to PbS-NP (see Figure 10), the index rises sharply at low doses and then decreases in the range of medium doses. At the same time, we again (as well as for the ATP-dependent luminescence) see that subsequent increasing of the dose causes the response to rise again rather than reaching an equilibrium value.

The values of cardiomyocyte area for experimental doses under exposure to PbS-NP. The chart shows the mean values with the standard error of the mean. The abscissa plots the nanoparticle concentrations in milligram per milliliter, and the ordinate plots the mean value of the cell area in square micrometer. PbS-NPs indicates lead sulphide nanoparticles.

Approximation, by model (6), of the dependence of the mean cell size in the HL-1 culture under exposure to various doses of PbS-NP. The abscissa plots the acting concentrations of nanoparticles in the incubation medium, milligram per milliliter; the ordinate plots mean cardiomyocyte area in square micrometer. The dots indicate the mean values with the standard error of the mean. PbS-NPs indicates lead sulphide nanoparticles.
None of the mathematical models of hormesis that we found in the literature provided a satisfactory approximation of the data shown in Figure 10. At the same time, equation (6), which we derived by modifying one of these models (see section “Modeling the dose–response dependence with special attention to possible hormesis”), fits the experimental data perfectly (Figure 11). A good data approximation was also provided by equation (7):

The fact that we found the 3-phase dose–response dependence of this kind by 2 formal independent indices, in both cases just for PbS-NP, is an argument for considering this seemingly paradoxical variant of hormesis as nonaccidental. Its hypothetical toxicological interpretation was given in section “Decrease in ATP-dependent luminescence.”
To conclude this section, we should mention that mean diameters of NPs used in our experiment are rather close, and therefore, the small difference between these sizes hardly can be a cause of different toxicity outcomes. We believe that the different types of dose–response relationship are due to different chemical nature of these NPs.
Estimating the Type of Combined Action of CdS-NP and PbS-NP on Cardiomyocyte Culture
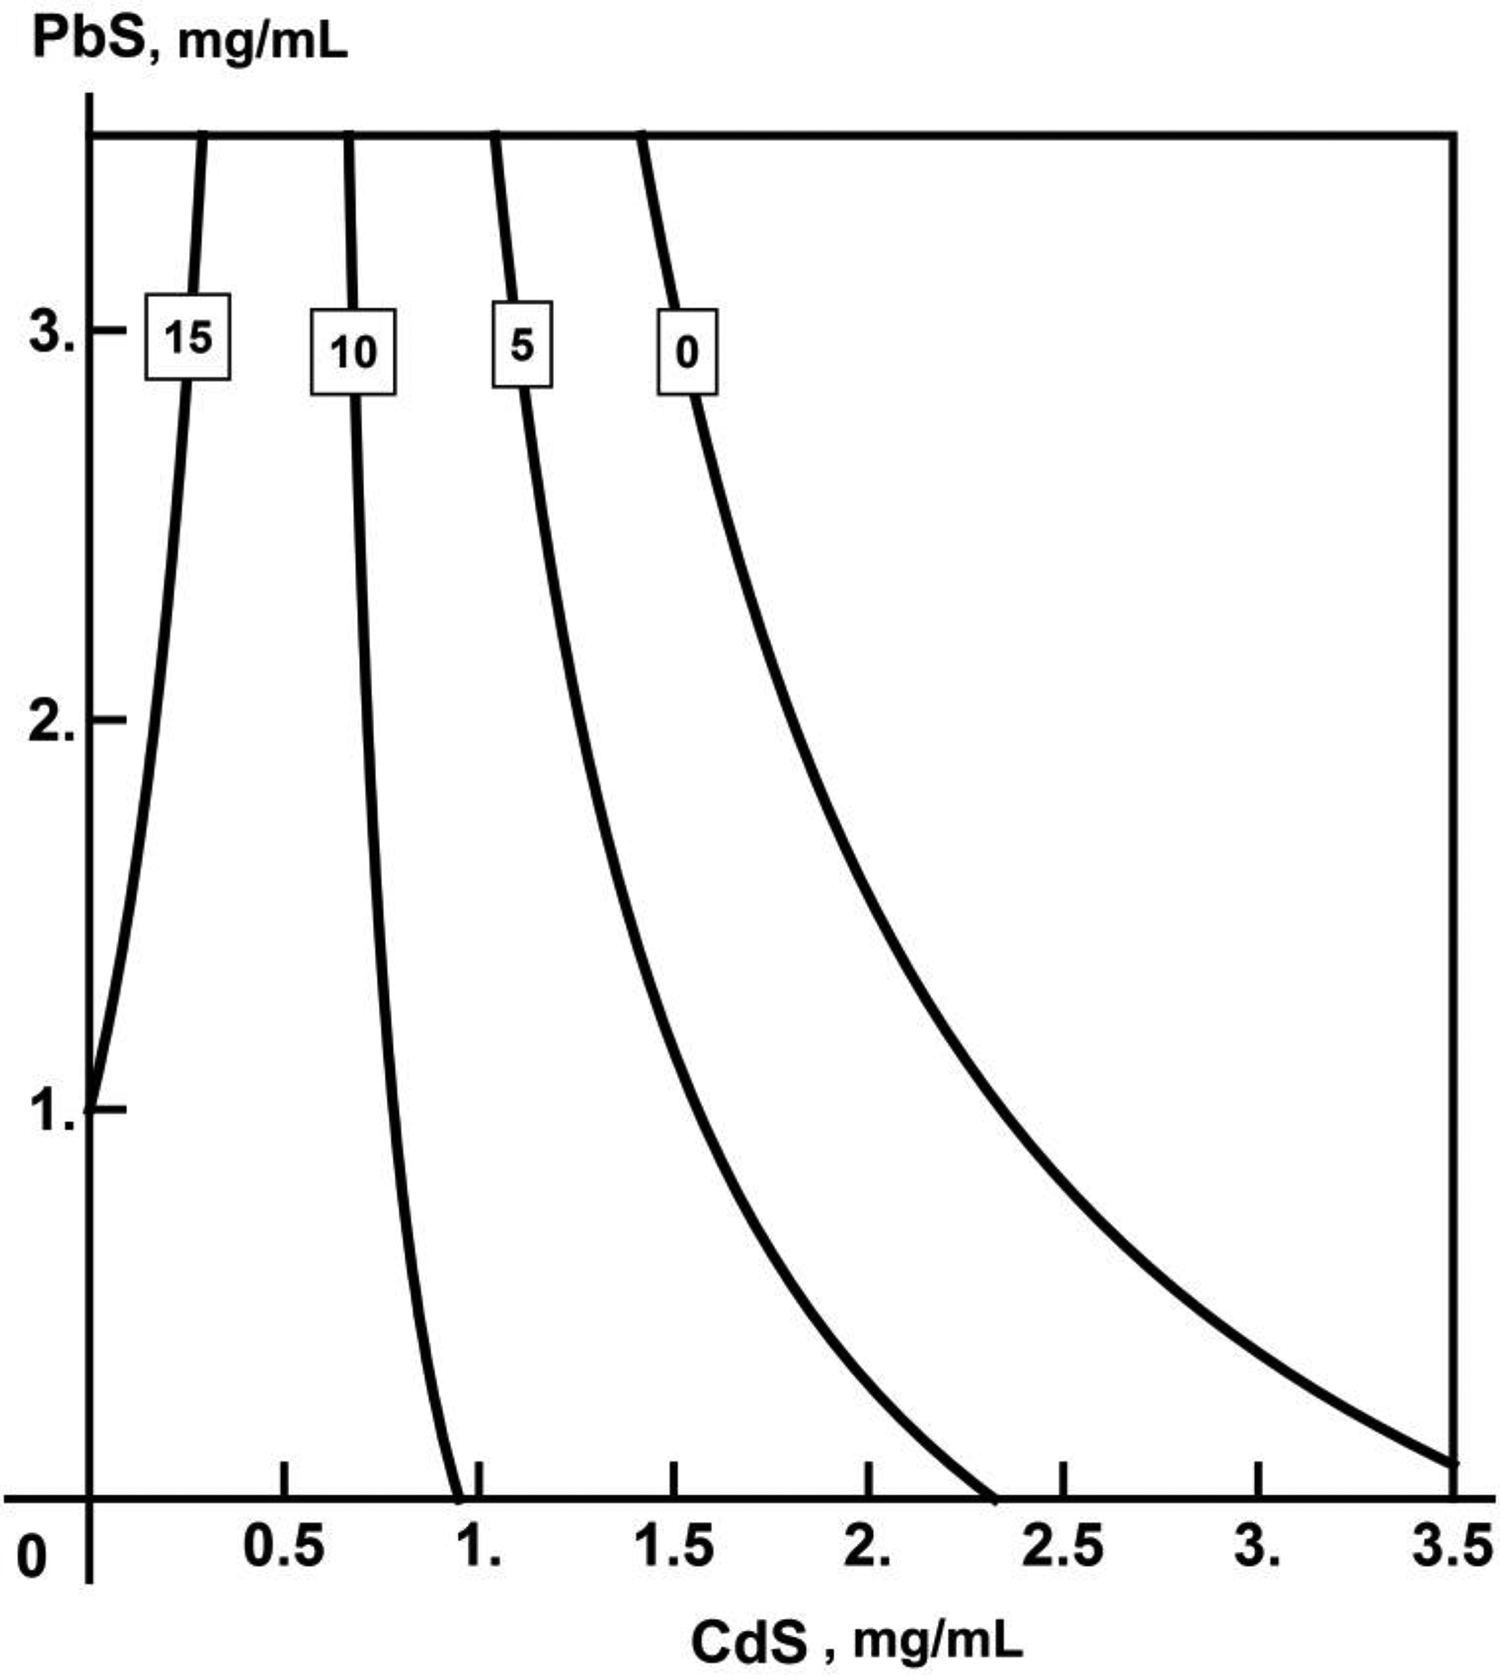
As can be seen from the results of the RSM analysis presented in the form of isoboles, all 3 recorded end points of combined action, particularly ATP-dependent luminescence inhibition (Figure 12), demonstrate the clear prevalence of CdS-NP action (which is well explained by its higher cytotoxicity compared with PbS-NP). However, at lower CdS-NP concentrations as well, there is a trend toward an opposite action of PbS-NP while at high concentration, on the contrary, to additivity of the combined action produced by the 2 NP species.

Isobologram characterizing the combined toxic action of CdS-NPs and PbS-NPs on the HL-1 cells culture as estimated by decrease in adenosine triphosphate–dependent luminescence. Numbers at the axes are respective MeS-NP concentrations in µg/mL, numbers at the isoboles are the values of the effect to which they correspond. CdS-NPs indicates cadmium sulfide nanoparticles; MeS-NP, mercaptoethanesulfonate nanoparticle; PbS-NPs, lead sulphide nanoparticles.
According to the effects of reduction in calcium spikes (Figure 13) and cardiomyocyte size (Figure 14), the unidirectional action of both CdS-NP (in relatively high doses) and PbS-NP is even more obvious, up to being superadditive in the first case.
Isobologram characterizing the combined toxic action of CdS-NPs and PbS-NPs on the HL-1 cells culture as estimated by change in the frequency of calcium spikes. Numbers at the axes are respective MeS-NP concentrations in µg/mL, numbers at the isoboles are the values of the effect to which they correspond. CdS-NPs indicates cadmium sulfide nanoparticles; MeS-NP, mercaptoethanesulfonate nanoparticle; PbS-NPs, lead sulphide nanoparticles.

Isobologram characterizing the combined toxic action of CdS-NPs and PbS-NPs on the HL-1 cells culture as estimated by the mean cardiomyocyte size in square micrometer. Numbers at the axes are respective MeS-NP concentrations in µg/mL, numbers at the isoboles are the values of the effect to which they correspond. CdS-NPs indicates cadmium sulfide nanoparticles; MeS-NP, mercaptoethanesulfonate nanoparticle; PbS-NPs, lead sulphide nanoparticles.
Numerous animal experiments carried out by the Ekaterinburg toxicological team by way of modeling the combined action of various combinations of metal ions or metal-oxide NPs 10,11,12,58,59,71 -76 have shown repeatedly that for one and the same binary toxic combination, the type of combined toxicity can vary from synergistic (superadditive) to contradirectional depending on the outcome under consideration and its level. This essential postulate of the theory of combined toxicity was also confirmed in experiments on different cell cultures exposed, alone or in combination, to NPs of manganese and nickel oxides 8 or lead and copper oxides. 9 It should be stressed that the typological ambiguity of the combined toxicity of cadmium and lead in ionic form was shown, in particular, under subchronic intoxication of rats by a large number of end points, including hemodynamic and electrocardiographic ones. 12 We believe that the experimental results considered in this paper are in good agreement with all these previously obtained data and strengthen the theoretical postulate formulated above.
Conclusions
Cadmium and lead sulfide NPs acting on the HL-1 line of cardiomyocytes display cytotoxicity as judging by the decrease in ATP-dependent luminescence, CdS-NP producing a considerably stronger effect than PbS-NP (partly due to more active dissolution of the former in incubation medium).
The CdS-NP in practically the same dose range as well as small doses of PbS-NP reduced the number of spontaneous calcium spikes, which is a specific effect for cells of this type and can indicate a disturbance of the Ca2+ transient, the main dynamic regulator of the contractile activity in the cardiomyocyte.
Along with cell hypertrophy under the action of certain doses of CdS-NP and PbS-NP, our experiment also revealed doses causing a decrease of the cardiomyocyte size. We obtained both monotonic (well approximated by the hyperbolic function) and different variants of nonmonotonic “dose–response” relationships, for which we managed to construct adequate mathematical expressions by modifying some of the hormesis models that we found in the literature. Overall, these results suggest that it would be scientifically reasonable to expand the concept of hormesis further by incorporating into it the possibility of several alternating changes in the sign of the response in any sequence. A possible essential mechanism of 3-phase “dose–response” relationships (which in this study were found to be typical of PbS-NP) is hypothesized.
Further support has been obtained for the fact that the ambiguity of the type of action displayed by one and the same pair of agents should be considered as one of the postulates of the general theory of combined toxicity.
Footnotes
Declaration of Conflicting Interests
The author(s) declared no potential conflicts of interest with respect to the research, authorship, and/or publication of this article.
Funding
The author(s) received no financial support for the research, authorship, and/or publication of this article.