
Abstract
The term hormesis describes a dose-response relationship that is characterized by a response that is opposite above and below the toxicological or pharmacological threshold. Previous reports have shown that this relationship is ubiquitous in the response of pharmaceuticals, metals, organic chemicals, radiation, and physical stressor agents. Recent reports have also indicated that certain nanoparticles (NPs) may also exhibit a hormetic dose-response. We describe the application of three previously described methods to quantify the magnitude of the hormetic biphasic dose-responses in nanotoxicology studies. This methodology is useful in screening assays that attempt to parse the observed toxicological dose-response data into categories based on the magnitude of hormesis in the evaluation of NPs. For example, these methods may be used to quickly identify NP induced hormetic responses that are either desirably enhanced (e.g., neuronal cell viability) or undesirably stimulated (e.g., low dose stimulation of tumor cells).
INTRODUCTION
Hormesis is a dose-response relationship that is characterized by an opposite response at high and low doses. For example, when considering an endpoint such as cell proliferation, the response at low concentrations may be a modest stimulation above the controls, followed by inhibition at higher concentrations (Calabrese and Baldwin, 2002). When represented on a graph, this dose-response resembles an inverted U-shaped dose response, or a β-curve (Figure 1).
Hormesis has been observed in a number of microorganisms, plants, as well as a phylogenetically diverse group of animals (Calabrese and Blain, 2005; Calabrese and Blain, 2011). We have previously described a three part methodology to quantify the observation of hormesis (Nascarella and Calabrese, 2009a) in the dose-response of yeast (Saccharomyces cerevisiae), exposed to putative anti-cancer agents (Holbeck and Simon, 2007; NCI, 2008). We suggest here that this methodology can be applied to an evaluation of nanoparticle (NP) induced dose responses.
Hormesis has been observed in a number of studies involving the health effects of NPs. For example, Jan et al. (2008) observed a hormetic response in the neurite length of NG108-15 murine neuroblastoma cells exposed to a 25 nM concentration of thioglycolic acid (TGA)-capped cadmium telluride (CdTe) quantum dots. Drobne et al. (2009) also discuss statistically significant stimulation of food assimilation, feeding rate and catalase activity in an animal model (arthropod) following exposure to titanium dioxide (TiO2) particles. Recently, Iavicoli et al. (2010) have reviewed a number of studies that reveal similar hormetic dose-responses in a variety of nanomaterials (e.g., single walled carbon nanotubes; silver molybdenum and aluminum nanoparticles, graphite nanofibers, titanium dioxide nanoparticles, inter alia).

Hormetic Dose-Response. (a) Most common hormetic dose-response curve depicting low-dose stimulatory and high-dose inhibitory responses, the β- or inverted U-shaped curve (b) Hormetic dose-response curve depicting low-dose reduction and high-dose enhancement of adverse effects, the J- or U-shaped curve.
The purpose of this paper is to offer a three part evaluative methodology to evaluate dose-response data for the presence of hormesis. This three part methodology may be summarized as follows:
(1) Evaluate the fundamental shape of the dose-response curve and determine if there is non-random biological activity below the toxicological threshold. Estimate the toxic threshold using a Bench Mark Dose (BMD) procedure (modified from Crump, 1984), and then evaluate the distribution of responses at concentrations below the estimated toxic threshold (Calabrese et al., 2006).
(2) Determine the average magnitude of response and the distribution of the mean response. Determine the average magnitude of response below a toxic threshold using a modeling (i.e., a linear mixed model) approach (Calabrese et al., 2008).
(3) Quantify the individual hormetic concentration-responses. Measure the width of the hormetic zone, the interval from the maximum stimulatory concentration to the toxic threshold, and the amplitude of the maximum stimulation (Nascarella et al., 2009).
Methods
Part I
The first assessment is a two part evaluation, with both parts contingent on first estimating the toxic threshold using a Bench Mark Dose (BMD) procedure (modified from Crump, 1984 as described in Calabrese et al. 2006), and then evaluating the distribution of responses at concentrations below the estimated toxic threshold, using two different procedures. These two procedures (i.e., the primary and secondary assessment) are described separately below.
Primary Assessment
The first step is to count the number of times replicates in each experiment were above and below (or equal to) 100% and compare the counted values to expected values assuming a threshold model. Using this approach, each repetition would have either one of two different responses: an H (response above 100%) or an L (response less than or equal to 100%). Then use a “fair coin” model for the responses below the BMD(10) where each replication would have a 50% probability of being above or below (or equal to) 100%, and determine the statistical independence across responses. The agreement between the observed data and this hypothesized model would then be evaluated (Calabrese et al., 2006).
Secondary Assessment
The second step involves comparing the frequency of responses at multiple levels above and below 100% (Calabrese et al., 2006). The hormetic model of non-monotonic concentration-response relationships suggests that there is non-random stimulatory response (i.e., responses greater than the control, 100%), below the toxic threshold. To evaluate the extent to which the data fit this assumption, we suggest constructing above-control (>100% response) and below-control (<100% response) ratios for all dose-responses in the respective BMD classification (i.e., BMD10). Evaluations could be made relative to responses above 100, 105, 110, 115 and 120, etc. and then to below-the-appropriate-control group response using the formula:

This method accounts for the possibility of an unrestricted stimulatory response while at the same time fixes the maximum inhibitory response at zero. When the concentration is below the BMD10, the next step involves calculating the mean and standard deviations of all responses below the BMD10.
Part II
In the second evaluative methodology, the average magnitude of response for each dose-response would be calculated using a modeling approach. We recommend using a linear mixed model to predict the average response in the low-concentration zone for each NP (Calabrese et al., 2008). The average response for each of the NPs (using the best linear unbiased prediction (BLUP) or empirical Bayes approach) may then be presented (with prediction intervals) as a quantitative assessment of the magnitude of hormesis. This assessment provides a more accurate prediction of the true NP response compared to a simple mean due to the fact that the regression towards the mean affects only NPs whose predictor differs from the mean, and not the mean itself (Calabrese et al., 2008). Separate models may also be fit for each NP, based on the number of concentrations below the toxic threshold (e.g., BMD or Zero Equivalence Point [ZEP]). If we assume at each concentration there are two replicates, the model would have 2 variance components: (1) variance of the distribution of the mean response for the agent and (2) replication variance, an estimate averaged over agents and concentrations may be determined (Calabrese et al., 2008).
This type of analysis is useful in large high-throughput toxicology assays where there are multiple chemicals evaluated over a number of different cell lines.
Part III
The third evaluative method involves a characterization of the quantitative features of hormetic dose-responses using an established entry and evaluative criteria for inverted u-shaped dose-responses (Calabrese and Baldwin, 1997; Nascarella et al., 2009). This methodology selects dose-responses that have at least one response in the low-dose zone that is stimulated 10% above the controls, followed by a response at a higher concentration that is decreased 20% below the control value (i.e., a toxic response). While a BMD approach may also be used to calculate the toxic threshold, we have generally used a zero equivalence point (or ZEP) approach. The ZEP is defined as the concentration (on the abscissa) where the response (on the ordinate) is equal to the control (ordinate value of 100%; see Figure 2). Conceptually, this may be thought of as the BMD0, (although this nomenclature is unconventional).
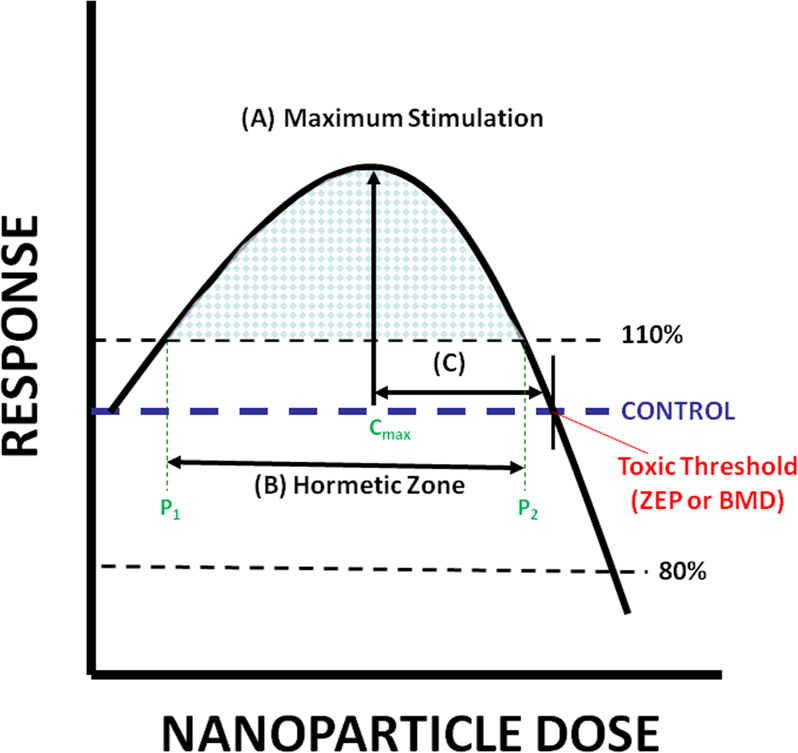
Quantitative features of a typical dose-response curve (β-curve) displaying hormesis (shaded region). (A) The maximum stimulatory response. (B) The width of the stimulatory response calculated from the lowest (P1) to the highest (P2) concentration showing a response that is 110% of the control response. (C) Distance from the concentration of the maximum stimulatory response to the highest concentration with a response equal to the control, the zero equivalent point (ZEP). In order for a concentration-response to be evaluated it must have a response in the low-concentration region ≥110% and a response at a higher concentration ≤80% of the control. (after Calabrese and Baldwin, 1997; Nascarella et al., 2009).
The quantitative features of hormetic concentration-response curves are shown in Figure 2. Specifically, they include the: (A) maximum stimulatory response; (B) width of the concentration showing stimulation above 110%; and (C) width from the maximum stimulation to the ZEP. They are described in more detail below.
Maximum Stimulatory Response and the Width from the Max Stimulation to the ZEP
The maximum stimulatory response (parameter A, Figure 2) is the response of the greatest magnitude (i.e., height) of all the concentrations below the toxic threshold (i.e., the BMD or ZEP). The concentration (or dose) that corresponds to the maximum stimulatory response is termed the Cmax. The distance from that concentration to the ZEP is referred to as parameter C (i.e., C = ZEP – Cmax; Figure 2).
Width of the Hormetic Zone
We define the width of the hormetic zone (parameter B, Figure 2) as the width of the stimulatory region that is ≥ 110% of the control (i.e., the blue checkered region in Figure 2). It therefore extends above and below the concentration of the maximum stimulatory response, but does not reach the ordinate or the ZEP. This width is calculated by first determining the lowest concentration at which the response is estimated to have increased 10% above the control value, before reaching the concentration of the maximum stimulatory response (we term this value P1). The second step involves determining the concentration > Cmax, where the response has decreased to < 10% above the control value (referred to as P2). The width is therefore the difference between the two points (i.e., width = P2-P1).
RESULTS
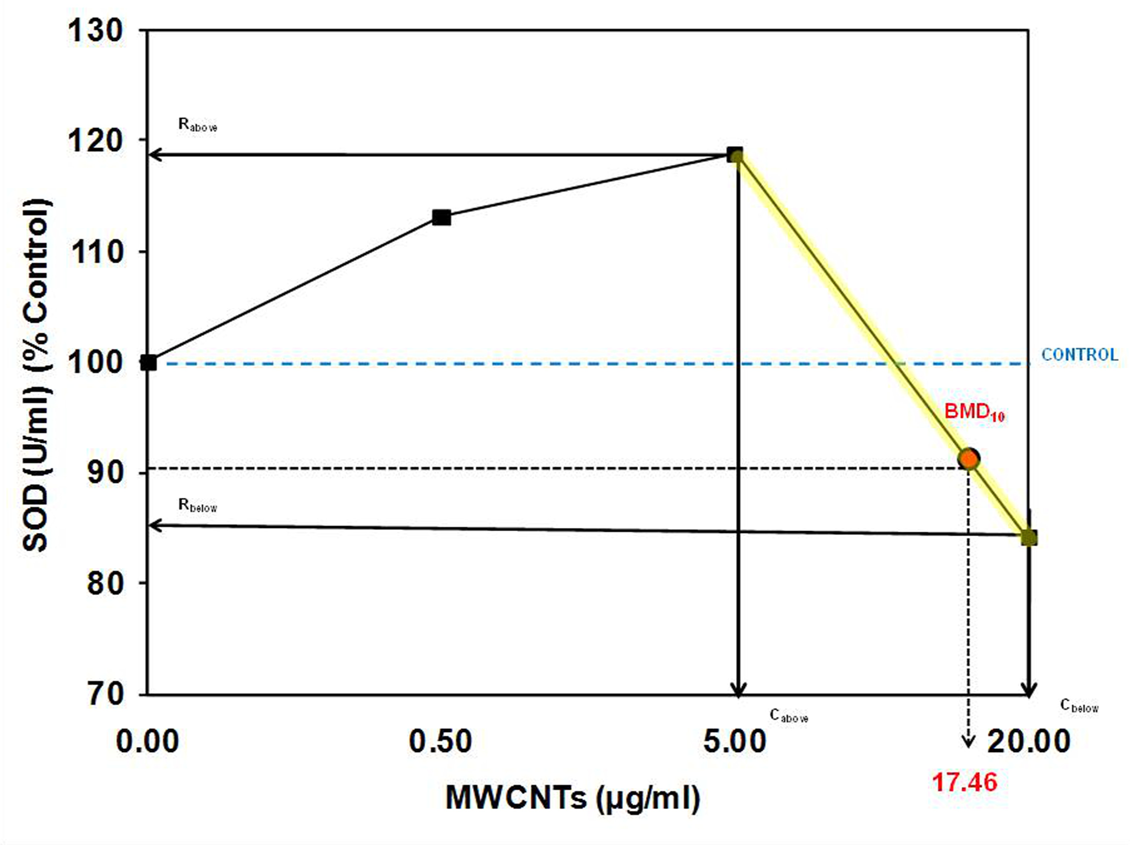
To illustrate the approach described above, we have evaluated data provided by Dr. Jun Yang of the Department of Toxicology, Hangzhou Normal University School of Public Health, Hangzhou, Zhejiang, China. Dr. Yang and his colleagues work is described in Guo et al. (2011) [and as such is referred to as Guo et al. in our analysis] where they reported a biphasic response of cellular redox status in human umbilical vein endothelial cells (HUVECs) exposed to multi-walled carbon nanotubes (MWCNTs). The HUVECs were exposed to MWCNTs that were > 95% pure, with an average diameter of 30 nm and a length of < 1 μM, at concentrations of 0 (control), 0.5, 5, and 20 μg/ml, for 24 h. The cells were then lysed using an ultrasonicator and centrifuged with the supernatants used for measurement of the activities of SOD using a commercial assay. As described above, we have characterized the biphasic dose-response reported by Guo et al. (2011) using a three-tiered approach for the evaluation of nanomaterials:
In Part 1, we evaluated the dose-response curve to determine if responses below the toxic threshold is non-random. To accomplish this, we first estimated the toxic threshold using the following Bench Mark Dose (BMD) procedure (modified from Crump (1984), as described in Calabrese et al. (2006)):

As Each of the six experiments described in the Guo et al. (2011) paper reveal a response of SOD activity below the BMD that is stimulated in a non-random fashion (i.e., 100% of the responses are above the control response; Figure 3).
Next, we determined the distribution of the mean response (i.e., the average magnitude of response below the toxic threshold) using a modeling approach, described above (i.e., a linear mixed model). On average, the response below the BMD is significantly stimulated 11% above the control response (range 4.2 – 17.4%; p<0.01; Figure 4).
In the final phase, we evaluated the individual hormetic concentration-responses. That is to say, we measured the width of the hormetic zone, the interval from the maximum stimulatory concentration to the toxic threshold, and the amplitude of the maximum stimulation. The maximum stimulatory response of HUVECs in this experiment averages 118% of the control (maximum of 131%), and the width of the stimulatory response is 30-fold. The stimulatory response was greatest at the 5 μg/ml concentration, and approximately 11 μg/ml below the ZEP of 16 μg/ml. These results in MWCNTs are consistent with the hormetic antioxidant response of in vitro human, bacterial, and yeast cells exposed to bulk chemicals. (Figure 5; Table 1).
Distribution of responses at concentrations below the estimated toxic threshold (BMD10). We determined if a response was above (H), or below/equal to the control (L). These data were then compared to the estimated above and below the threshold response that would be expected under the assumption of a threshold dose-response (Calabrese et al., 2006).

Mean response below the estimated toxic threshold. We estimated the average magnitude of response (115.9%, see shaded line) below the BMD10 using a linear mixed model approach (Calabrese et al., 2008).

Quantitative features of the hormetic dose-response (see Table 1).
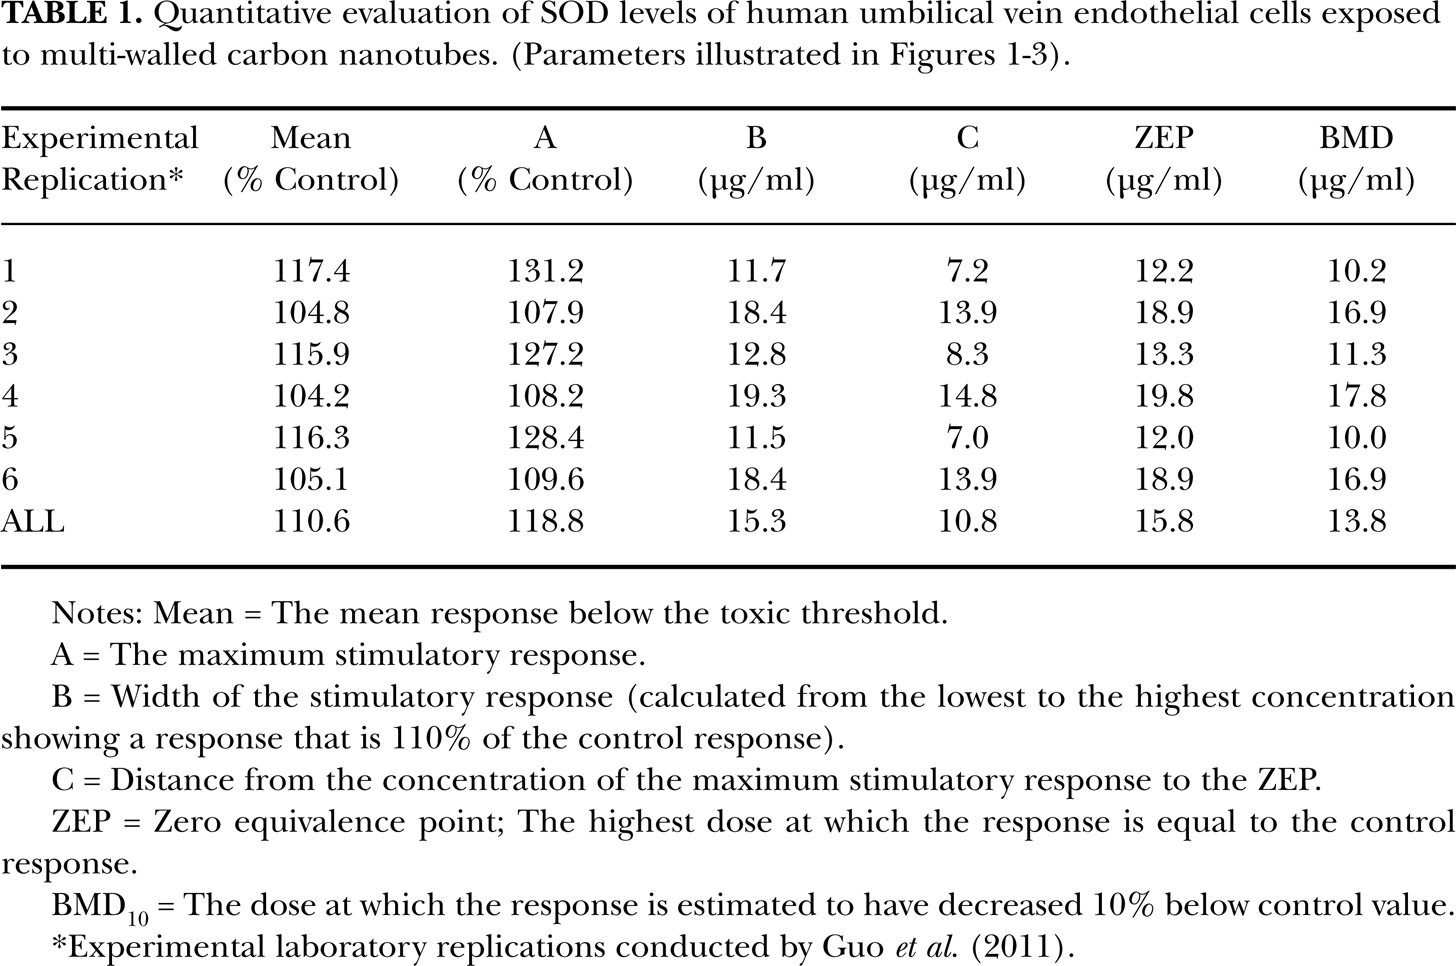
Notes: Mean = The mean response below the toxic threshold.
A = The maximum stimulatory response.
B = Width of the stimulatory response (calculated from the lowest to the highest concentration showing a response that is 110% of the control response).
C = Distance from the concentration of the maximum stimulatory response to the ZEP.
ZEP = Zero equivalence point; The highest dose at which the response is equal to the control response.
BMD10 = The dose at which the response is estimated to have decreased 10% below control value.
Experimental laboratory replications conducted by Guo et al. (2011).
DISCUSSION
Guo et al. (2011) describe the observation of a biphasic dose-response as follows (p. 6):
“One interesting finding in this study is that the activities of GSH-Px and SOD responded differently to varied concentrations of MWCNTs, e.g., low and medium concentration of MWCNTs stimulated their activities while high concentration of MWCNTs suppressed their activities. One possible answer is that when HUVECs were exposed to low and medium concentration of MWCNTs, ROS levels increased, and this imbalance might stimulate the activities of GSH-Px and SOD to suppress the levels of ROS and lipid oxidation. However, when exposed to high concentration of MWCNTs, excess ROS surpasses the cells’ ability to compensate, so the cell might simply shut down the activities of GSH-Px and SOD.”
We have shown that through the use of these multiple levels of evaluation (2 methods in Part I, a separate linear mixed model analysis in Part II, and a third evaluation of the quantitative features of the dose-responses in Part III) how a NP dose-response study can be systematically evaluated to determine if the biological activity below the toxic threshold is best described by a hormetic model. While the Guo et al. data has been collected on a relatively small-scale study, we anticipate applying these methods to a larger high-throughput data set. For example, the multi-part evaluation described here has been previously applied to a single, albeit large, high-throughput study of chemicals (i.e., NCI, 2008; Holbeck and Simon, 2007; see Calabrese et al., 2006; 2008; Nascarella et al., 2009).
This is a novel approach to evaluate dose-responses on features such as reproducibility, magnitude of stimulation, and the consistency of responses below the toxic threshold; while at the same time quantifying the specific parameters of the hormetic dose-responses (amplitude, width, toxic threshold, etc.). However, as Oberdörster et al. (2005) has reviewed, the prerequisites for determining the dose-response relationship for NPs include a sufficient number of data points in the dose-response continuum. Oberdörster et al. (2005) have commented on how the paucity of data in the low-dose range can result in severe misinterpretation of the response model. We suggest that the the methods presented here may assist in a comprehensive evaluation of NP dose-response.
Calabrese and Blain (2005) have similarly stressed the importance of study design in the assessment of hormesis. Namely, that the hormetic responses are typically modest, with the maximum stimulatory response being only 30–60% greater than the controls, and the optimal range of hormetic responses beginning at 1/3 – 1/4 of the estimated toxic threshold (Calabrese and Blain, 2005; Nascarella et al., 2009). This observation is consistent with both In vitro and In vivo studies reported in Iavicoli et al. (2010). For example, the stimulation of neurite growth in murine cells exposed to a 25 nM concentration of TGA-capped CdTe NPs was 20% greater than the controls (Jan et al., 2008), and the stimulation of feeding rate was 57–70% greater than the controls in arthropods (Porcellio scaber) exposed to 10–1000 μg/g of TiO2 NPs in food (Drobne et al., 2009).
A current issue in the evaluation of nanomaterial dose-responses is the determination of the appropriate dose metric (e.g., surface area, charge, mass, etc.). Currently, there is significant discordance in the scientific literature as to the correct dose-metric to employ in nanotoxicology studies (Becker et al., 2010; Oberdörster et al., 2005; Oberdörster et al., 2007). The methodology described here may assist investigators in characterizing the response, regardless of the respective dose-metric. This may allow future investigations to evaluate if a biphasic dose-response curve is dependent upon the dose metric.
Many toxicology studies are focused on establishing the median lethal or toxic doses (e.g., LD50, TD50), and not assessing hormesis. While the relationship between hormesis and toxic potency (as measured by the IC50) remains to be fully characterized, initial reports on non-NPs indicate that the magnitude of hormesis below the toxic threshold, and the difference between the IC50 and the ZEP (i.e., IC50-ZEP) are inversely related (Nascarella and Calabrese, 2009b). This could have important implications in the assessment of NPs and additional research in this area is warranted.
CONCLUSION
The methods described here may be useful in dose-response assessments designed to identify NP responses that are either desirably enhanced (e.g., neuronal cell viability) or undesirably stimulated (e.g., low dose stimulation of tumor cells). We have previously identified a number of nanomaterial toxicology studies that reveal biphasic dose-responses (e.g., single walled carbon nanotubes; silver molybdenum and aluminum nanoparticles, graphite nanofibers, titanium dioxide nanoparticles, inter alia; Iavicoli et al., 2010). Future efforts are focused on applying this methodology to quantify hormetic dose-responses within the rapidly expanding nanotoxicology field.
Footnotes
ACKNOWLEDGEMENTS
We thank Dr. Jun Yang of the Department of Toxicology, Hangzhou Normal University School of Public Health, Hangzhou, Zhejiang, China for providing the data used in this analysis. Dr. Yang and his colleagues work is described in ![]() . Edward J. Calabrese's efforts are sponsored by the Air Force Office of Scientific Research. The U.S. Government is authorized to reproduce and distribute for governmental purposes notwithstanding any copyright notation thereon. The views and conclusions contained herein are those of the authors and should not be interpreted as necessarily representing the official policies or endorsement, either expressed or implied, of the Air Force Office of Scientific Research or the U.S. Government. A preliminary version of this analysis was presented at the 10th Annual International Conference: Dose-Response: Implications for Toxicology, Medicine, and Risk Assessment at the University of Massachusetts Amherst, April 26–27, 2011.
. Edward J. Calabrese's efforts are sponsored by the Air Force Office of Scientific Research. The U.S. Government is authorized to reproduce and distribute for governmental purposes notwithstanding any copyright notation thereon. The views and conclusions contained herein are those of the authors and should not be interpreted as necessarily representing the official policies or endorsement, either expressed or implied, of the Air Force Office of Scientific Research or the U.S. Government. A preliminary version of this analysis was presented at the 10th Annual International Conference: Dose-Response: Implications for Toxicology, Medicine, and Risk Assessment at the University of Massachusetts Amherst, April 26–27, 2011.