
Abstract
Hormesis is a low-dose phenomenon that has been reported to occur, to different extents, in animals, plants, and microorganisms. However, a review of the literature shows that only a few reports describe it in humans. Also, the diversity of experimental protocols and cellular models used makes deciphering the mechanisms of hormesis difficult. In humans, hormesis mostly appears in the 20 to 75 mGy dose range and in nontransformed, radioresistant cells. In a previous paper by Devic et al, a biological interpretation of the adaptive response (AR) phenomenon was proposed using our model that is based on the radiation-induced nucleoshuttling of the ATM protein (the RIANS model). Here, we showed that the 20 to 75 mGy dose range corresponds to a maximum amount of ATM monomers diffusing into the nucleus, while no DNA double-strand breaks is produced by radiation. These ATM monomers are suggested to help in recognizing and repairing spontaneous DNA breaks accumulated in cells and contribute to reductions in genomic instability and aging. The RIANS model also permitted the biological interpretation of hypersensitivity to low doses (HRS)—another low-dose phenomenon. Hence, for the first time to our knowledge, hormesis, AR, and HRS can be explained using the same unified molecular model.
Introduction
The scientific jargon is frequently the source of confusions, notably when the current use of a specific term does not necessarily correspond to its historical definition. This is notably the case of the terms “adaptive response” and “hormesis.”
1
-4
In our previous report, these 2 terms were the subjects of a semantic study (Figure 1)
5
:
Adaptive response (AR) is an old term widely used in the 19th century in evolutionary biology. It generally evokes a long-term adaptation of an organism for some generations. Progressively, the definition of AR changed. Adaptive response is now defined as “a process of adaptation which allows survival under adverse conditions independently of the duration of the adaptation.”
6
In 1984, Olivieri et al first introduced this term in the radiation research field to describe a radiobiological phenomenon occurring after 2 successive doses
7
: the first one, the “priming” dose (dAR) precedes a certain period of time (ΔtAR), and a higher “challenging” dose (DAR). The priming dose is generally lower than the challenging dose. After reviewing the reports dealing with AR, we proposed the following “operational” definition of the AR phenomenon: any radiobiological phenomenon occurring when the biological effect induced by dAR + ΔtAR + DAR is lower than that induced by DAR alone.
5
Hormesis: The term “hormesis” (from the ancient Greek meaning stimulus) is more recent and less frequently used than AR. “Hormesis” was first introduced in 1943 by Southam and Ehrlich who discovered that tree bark extracts stimulate fungi growing at low concentrations and is toxic at high concentrations.
8
Luckey first introduced the term “hormesis” in the radiation research field in the 1980s.
9,10
As reviewed by Calabrese, hormesis can be described as a J- or U-shaped dose- or dose-rate-dependent phenomenon, associated with a specific threshold under which stress is considered to be “positive” and above which it is detrimental.
1
-4

The major biological effects specific to low dose. A, The hormesis phenomenon is defined as a continuous J-shaped function of dose or dose-rate with beneficial effect. The maximal extent of hormesis is reached at the dose dHORM. B, The adaptive response (AR) is defined as an infra-additive effect observed after the succession of a priming dAR and a challenging dose DAR separated by a period of time ΔtAR. C, The hypersensitivity to low-dose phenomenon (HRS) describes an excess of deleterious effect around the dose dHRS.
Even if some authors have suggested that AR and hormesis obey the same intrinsic mechanisms, their molecular and cellular bases remain misknown. 1 -4 In our previous review, we have shown that the occurrence and the extent of AR are dependent on individual radiosensitivity. Furthermore, we proposed a biological explanation for AR, based on the radiation-induced nucleoshuttling of the ATM protein kinase (RIANS). 5 Here, in order to help elucidate the specific mechanisms of hormesis, we have systematically applied the approach developed for AR 5 : (1) to review the experimental protocols, the cellular models, the biological and clinical end points, and the data related to the hormesis phenomenon and (2) to propose a biological interpretation for hormesis from the RIANS model. In order to avoid any interspecies bias, we deliberately focused, as a first step, on human data since it was the basis of the RIANS model. 11
Radiation Hormesis in Humans: Few Data Available in Literature
Why are Extrapolations From Microorganisms/Vegetal/Animal Data to Humans not Reliable?
With regard to the radiation response, there are 2 major interspecies differences, at least: DNA repair pathways and nucleus size:
– DNA double-strand breaks (DSBs) are considered as the key damage of lethality if unrepaired and of carcinogenesis if misrepaired.
12
There are 2 major DSB repair pathways:
The nonhomologous end-joining (NHEJ) pathway consists in joining the broken DNA ends. This pathway is mainly active in quiescent cells and therefore predominant in mammalians and especially in humans.
13
The recombination pathway, whether nonhomologous or homologous, consists in inserting a DNA fragment in the hole formed by the DNA break. This pathway is mainly active in proliferating cells. The relative importance of the recombination pathway is therefore lower in human cells and healthy tissues than in animal cells and tumors. However, in the case of syndromes associated with cancer proneness, the lack of control of recombination, also called hyper-recombination, may generate a significant accumulation of errors through misrepaired DSB and chromosome aberrations. Heterozygous mutations of BRCA1, BRCA2, p53, BLM, and FANC genes that confer high risk of cancer are generally associated with hyper-recombination. Hyper-recombination is also a specific feature of transformed and tumor cells.
13
Hence, the relative contribution of NHEJ and recombination in irradiated animal/plants/microorganisms models can be very different from that observed in humans. – In addition to the competition between NHEJ and recombination, species differ by the length of their genome that conditions the size of the nucleus and consequently the chromatin condensation. For example, in rodent cells, cell nuclei are generally smaller and chromatin condensation is generally higher than in humans.
14
One of the major consequences of these features is that rodents are more radioresistant than humans, with an average 50% lethal dose of about 15 and 4.5 Gy, respectively. Consequently, radiation-induced cellular death (radiosensitivity), transformation (radiosusceptibility), and accelerated aging (radiodegeneration) are not observed in the same dose ranges according to the species considered.
13
Particularly, at a dose that may cause cellular death in human cells, rodent models may appear more permissive to nonlethal cellular transformation, while no significant effect is observed in microorganisms. Furthermore, data obtained with some specific end points may be interpreted differentially according to the species considered. For example, while a higher proliferation rate may appear positive for microorganisms placed in extreme conditions, it can be considered as negative and a sign of cellular transformation for human healthy tissues. Hence, interpreting a radiobiological phenomenon as hormetic should be based on objective criteria depending on the species considered.
Altogether, despite the number of data accumulated in animals and microorganisms, these examples show that the occurrence of hormesis phenomenon with certain species cannot be simply extrapolated to human data.
General Features of the Literature Data About Radiation Hormesis in Humans
As a first step, we have inventoried the peer-reviewed papers (1) in which the term “radiation hormesis” is cited, (2) published in English from 1980 to 2019, (3) with an abstract available, and (4) referenced in the PubMed or in the Web of Science databases. From these criteria, 270 and 469 articles were found, respectively (Table 1). It is noteworthy that such numerical differences are likely due to the definition of the research criteria in both databases. Furthermore, a number of reports that concern hormesis may not have been inventoried if the authors did not mention the term “radiation hormesis” in the title or in the abstract.
Number of Peer-Reviewed Reports Dealing With Radiation Hormesis Provided by PubMed and Web of Sciences Databases.a
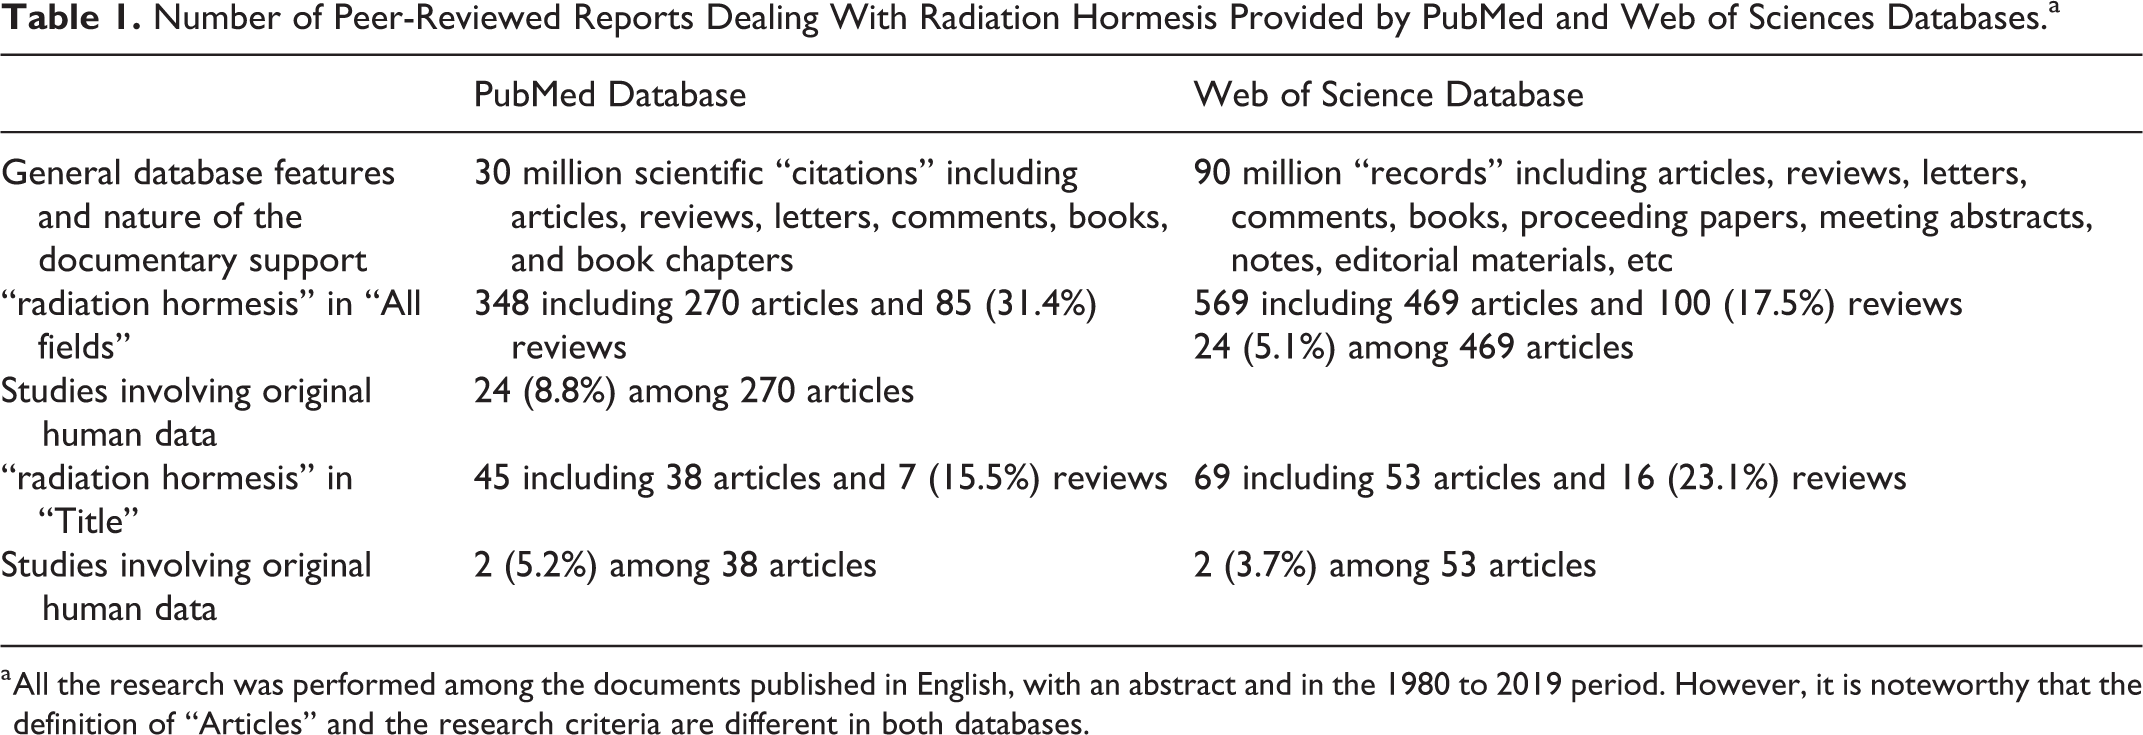
a All the research was performed among the documents published in English, with an abstract and in the 1980 to 2019 period. However, it is noteworthy that the definition of “Articles” and the research criteria are different in both databases.
As a second step, and despite the limitations described above, a small subset of 24 reports involving original human data mentioned in the title or in the abstract was identified. It represents 8.8% and 5.1% of all the inventoried papers, respectively
15
-38
(Tables 1 and 2). By analyzing these reports, 3 major conclusions can be drawn:
– There are few original human data about hormesis. They are mainly distributed into in vitro or ex vivo single-dose experiments and epidemiological and isolated clinical cases studies. In agreement with Luckey,
9
growth rate, growth development, reproduction, immune reactions, cancer incidence, life span, cell survival, cell death pathways, cytogenetics, and DNA damage induction and repair can be considered as the major end points used in the inventoried reports dealing with radiation hormesis (Table 2). However, most of these end points are not equally represented in human data and the description of the hormesis phenomenon may depend on the choice of the end point. – Among the 15 different cell lines used in the in vitro experiments, 7 are tumor or immortalized cell lines (Table 2). Again, the description of the hormesis phenomenon may also depend on the type of cells chosen. Indeed, even if the transformed, immortalized, or tumor cells grow faster than primary cells in vitro, they do not necessarily reflect the radiation response of healthy tissues, notably the radiosensitivity (radiation-induced cell death), the radiosusceptibility (radiation-induced cell transformation), and the radiodegeneration (radiation-induced cell aging) reactions.
13
With regard to nontransformed cells, hormesis has been observed in normal lung, prostate, blood, and endothelium tissues (Table 2). – Among the human hormesis data, the great majority of epidemiological studies concern cancer incidence/mortality of A-bomb survivors, which may represent an actual limitation to document hormesis, since radiation can influence the incidence of a wide range of noncancer diseases. These 3 points are discussed below.
Original Papers Dealing With Ionizing Radiation Hormesis Involving Human Data and Published Between 1980 and 2019.

Abbreviations: AR, adaptive response; DSB, DNA double-strand breaks; ERK, extracellular signal-regulated kinases; MAPK, mitogen-activated protein kinases.
Analysis of In Vitro and Ex Vivo Studies About Radiation Hormesis in Humans
There are 2 types of in vitro studies dealing with hormesis in human cells: those that consist in an exposure to a single dose or dose rate and those that obey the AR protocols (as described in Introduction). With regard to the single-dose or dose rate studies, Table 2 shows that experimental protocols vary drastically. Notably, the investigated dose rates varied from 0.1 to 0.5 Gy/min and are so different that no rigorous conclusion can be drawn about the dose rate range in which hormesis may occur. By contrast, the most frequent doses at which hormesis was observed in human cells belong to the (10-100 mGy) dose range and maximal extents belong to the (20-75 mGy; Table 2). This dose range is consistent with other reports in which hormesis is not mentioned in the title and the abstract, at least. For example, by using a normal human embryonic lung fibroblasts, Velegzhaninov et al showed that a single dose of 30 to 50 mGy resulted in decreasing senescence, which strongly suggests hormesis. 39
While cell proliferation and clonogenicity are the most frequent end points used in the in vitro studies dealing with radiation hormesis in human cells, the analysis of the Table 2 suggests that hormesis is more generally observed in normal than in tumor cells. For example, by applying doses ranging from 20 to 100 mGy, Liang et al showed that cell proliferation was significantly increased in fibroblasts through the activation of both MAPK/ERK and PI3K/AKT pathways, but not in tumors. 28 Similarly, Yang et al pointed out hormesis in human lung epithelial, but not in lung adenocarcinoma cells. 30 In addition, the cell lines in which hormesis has been observed were found rather radioresistant. Indeed, the available cell survival data of the cell lines used in the 24 reports described in Table 2 showed a surviving fraction at 2 Gy of more than 50%, suggesting intrinsic radioresistance. Furthermore, there are no hormesis data available with the hyper-radiosensitive cellular models like fibroblasts providing from ataxia telangiectasia or tumor cell lines holding mutations in DNA repair genes. 13 Interestingly, our previous report showed that AR was preferentially observed in radiosensitive rather than radioresistant cells, which reveals an important difference between hormesis and AR phenomena. 5
The ex vivo studies dealing with radiation hormesis in human cells also involve various experimental protocols: they generally consist in sampling blood plasma or cells from individuals exposed at a dose rate belonging to the (1-15 mSv/yr) range (Table 2). However, the exposures to radiation in this series of data are too different to establish a consensual explanation (cobalt-60-contaminated buildings, proximity to nuclear power plant, occupational exposure, high natural radiation background, etc; Table 2). Like for the in vitro studies, there is still no consensus for any mechanistic model to explain hormesis.
Analysis of Epidemiological and Clinical Case Studies About Radiation Hormesis in Humans
The most famous example of hormesis in epidemiological studies is the decrease in the incidence of some cancers observed in the cohorts of A-bomb survivors. 40,41 Hiroshima data have suggested that the rate of leukemia deaths per 100 000 persons determined in a 35-year period significantly decreases around an exposure of 75 mGy. 42 However, this conclusion is still a subject of controversies and debates. Furthermore, the authors did not necessarily mention the term “hormesis” in all their studies. 43,44 Interestingly, some other reports have also shown that cancer incidence or mortality decreases at doses belonging to the (20-75 mGy) range, when ovary, colon, or breast cancers are considered. 16,40
With regard to the dose rate data, only 3 reports referenced in Table 2 described a lower cancer incidence. All these reports concern elevated United States areas. These elevated areas were considered to be associated with higher radiation background. 23 -25 However, the correlation coefficients were low and the direct link between altitude and natural radiation background may be a source of artifacts. Furthermore, a rigorous analysis of the statistical significance of the differences observed between the natural radioactivity values was not performed. A similar study conducted in Poland presented more convincing data between 0.5 and 4.6 mSv/yr: for the first time, the hormesis effect was quantified with dose rate and defined as a decrease by 1.17%/mSv/yr of all cancer deaths. 26 However, this effect was found not statistically significant for lung cancers, probably because of smoking that represents a major confounding factor. 26
Hence, the epidemiological and ex vivo studies dealing with human radiation hormesis suggest that if hormesis is caused by natural radiation background, it may preferentially concern the low- rather than high-radiation background areas with dose rates belonging to the (0.5-15 mSv/yr) range. Indeed, there is a lack of consensual evidence of a hormesis effect in the high-level background radiation areas. For example, while the levels of chromosome aberrations have been found higher in circulating lymphocytes of Ramsar (Iran) inhabitants than in controls, neither detrimental nor beneficial (hormetic) effect was demonstrated. 45 It is noteworthy that the (0.5-15 mSv/yr) dose rate range corresponds to the worldwide average radiation background, which may make detecting hormesis difficult.
In addition to the epidemiological data, there are some isolated clinical case reports that have revealed hormesis, but again, they represent a very reduced number of cases. The case reports referenced in Table 2 concern 1 patient with rheumatoid arthritis treated by hot spring radon therapy 35 and 3 other patients with prostate cancer, prostate cancer with bone metastasis, and ulcerative colitis who were submitted to repeated low-dose treatment. 31 Because of the poor number of cases and since they do not present any quantitative features, these 2 reports cannot be rigorously considered as significant proofs of the existence of hormesis even if they may suggest that hormesis is not limited to a decrease in cancer risk (Table 2).
Radiation Hormesis in Humans: The AR Data
The AR phenomenon can theoretically be considered as hormesis if the biological effect is plotted against dAR (Figure 1). As reviewed in our previous report, 5 from the 1980s until to date, the AR response has been observed with the dAR + ΔtAR + DAR scenario and with the following values: (1-500 mGy) for dAR, (1-48 hours) for ΔtAR, and (0.1-6 Gy) for DAR. In about 90% of reports, dAR was found lower than 50 mGy and higher than 1 mGy. 5 However, in each report, there was no AR data enough to plot the biological effect against a series of dAR doses in order to reflect the existence of the hormesis phenomenon as defined in Introduction.
Radiation Hormesis in Humans: Some Quantitative Features
From the review described above, hormesis appeared to be more frequently observed in human untransformed radioresistant cells exposed at the doses belonging to the (20-75 mGy) range and delivered at high dose rate or else at low dose rate belonging to the (0.5-15 mSv/yr) range during a long period of time (Table 2). However, it must be stressed that the statistical robustness of single-dose and dose rate data is unequal. Indeed, the (0.5-15 mSv/yr) dose rate range is supported by few epidemiological studies based on calculated risks and in which a number of confounding factors (altitude, radiation background, smoking, etc) have not been considered. Furthermore, these dose rates values are so close to the lower limit of natural radiation background that the existence of any radiobiological phenomenon has to be considered with caution. Conversely, the same (20-75 mGy) dose range was obtained in in vitro, ex vivo, and epidemiological studies with different cell lines and subpopulations and with different end points in an independent manner Hence, at this stage of the article, we deliberately focused on hormesis occurring in the (20-75 mGy) dose range.
What does happen in human cells when irradiated at the (20-75 mGy) range? The DNA damage repair and signaling is a key process of the individual response to radiation. These DNA damage induction rates are proportional to the radiation dose. They are not dependent on the radiosensitivity status of cells but can vary with the size of the nucleus. In untransformed human fibroblasts, a dose of 1 Gy X- or γ-rays simultaneously induces about 10 000 base damage (BD), 1000 DNA single-strand breaks (SSB) and 40 DSB per cell. 13,46 These DNA damage induction rates are lower in lymphocytes. 13 A (20-75 mGy) dose range corresponds to the induction of 200 to 750 BD, 20 to 75 SSB, and 0.8 to 3 DSB per fibroblast and much less in human lymphocytes. At doses lower than 25 mGy, no radiation-induced DSB is expected. At doses lower than 1 mGy, no radiation-induced SSB is expected. In human radioresistant cells, a background of 0 to 2 spontaneous DSB is generally observed. 47 Hence, an exposure to the doses belonging to the (20-75 mGy) range results in a number of DNA damage at the same order as spontaneous DNA damage background. Conversely, in radiosensitive cells, there is more spontaneous DNA damage and some additional DNA damage may be also produced during repair in response to irradiation because of genomic instability. 13 Hence, the total yield of DNA damage induced at (20-75 mGy) may be much higher in radiosensitive than radioresistant cells. It was therefore not surprising that Table 2 suggests that hormesis is preferentially observed in radioresistant cells. Hence, an exposure to (20-75 mGy) may cause an oxidative stress facilitating biochemical processes that are not deleterious for cells but without producing DSB. Besides, some authors proposed the term “eustress” to describe such “positive” stress. 48 However, no mechanistic model linking molecular, cellular, and clinical aspects has been proposed to explain quantitatively the positive role of such eustress in human cells.
Radiation Hormesis in Humans: Toward a Model Requiring the ATM Kinase?
The ATM protein kinase is a key protein of the molecular and cellular response to ionizing radiation and notably, a very important actor of the DSB signaling and repair pathways. In 2016, we have proposed a model based on the RIANS to explain the individual response to radiation. 11,47,49 In the frame of this model, the radiation-induced oxidative stress induces DNA damage in the nucleus and the monomerization of ATM dimers in both cytoplasm and nucleus, in a linearly dose-dependent manner: The resulting ATM monomers can diffuse in the nucleus and trigger the DSB recognition via the phosphorylation of the H2AX histone (γH2AX). 11,49 The γH2AX phosphorylation, visible by immunofluorescence by the formation of γH2AX foci, is the first step of DSB repair via NHEJ pathway, the major DSB repair pathway in humans. The presence of ATM in the nucleus also inhibits the MRE11-dependent recombination-like error-prone DSB repair pathway that leads to misrepaired DSB and cancer proneness. 11,49,50 Any delay in the RIANS leads to a radiosensitivity and/or radiosusceptibility phenotype. Hence, in the frame of RIANS model, radioresistant (namely group I) cells are characterized by a fast RIANS, while cells with moderate radiosensitivity (namely group II) elicit a delayed RIANS. Hyper-radiosensitive (namely group III) cells show either a normal RIANS but a gross DSB repair defect due to deleterious mutations in DSB repair genes or a total absence of functional RIANS due to ATM mutations. 47,51,52
In the frame of the RIANS model, the number of radiation-induced DSB, NDSB, the number of radiation-induced ATM monomers, Nmono,, the number of ATM monomers that diffuse in the nucleus, Ndiff, and the number of radiation-induced ATM monomers that recognized one DSB through the γH2AX phosphorylation, Nrec, obey the following formulas, respectively 49 :


in which IDSB is the rate of the production of DSB per Gy; Imono is the rate of the production of ATM monomers per Gy. Furthermore, the nuclear membrane is characterized by a width
The formula (3) permits to determine the number of nuclear ATM monomers at a given postirradiation time t. Indeed, the t-integral of Ndiff(t, D),

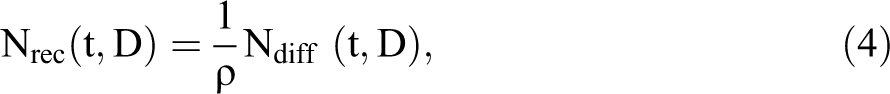
By using the numerical values validated in the study by Bodgi and Foray from hundreds of human fibroblasts with different radiosensitivity, 49 the diffusion of ATM monomers, whether represented as instantaneous or cumulative values, was simulated for 2 representative radioresistant (solid line) and radiosensitive (dotted line) cell lines at different postirradiation times (Figure 2). The cumulative number of ATM monomers increased very rapidly with dose: for example, in the first 10 minutes postirradiation, the number of active nuclear ATM monomers in radioresistant cells (solid lines) varies from 17 000 to 47 000 after an exposure to 20 and 75 mGy, respectively (Figure 2A). This cumulative number does not change significantly with radiosensitivity since these values become 13 000 and 36 000 in radiosensitive cells, respectively (dashed line; Figure 2A). However, when these values are considered with the number of radiation-induced DSB, the picture changes. Indeed, while the number of ATM monomers that diffuse in nucleus increases with dose, the number of nuclear ATM monomers per radiation-induced DSB decreases. The number of active nuclear ATM monomers per radiation-induced DSB in the (20-75 mGy) dose range appears 3 to 4 times higher than at 1 Gy in radioresistant cells (solid line) and 2 to 3 times higher than at 1 Gy in radiosensitive cells (Figure 2B). If we compared these values with the absolute number of ATM monomers that diffuse in nucleus at the same time (here, 10 minutes postirradiation), the intercept of the curves corresponds to the maximal amount of ATM monomers that is not “consumed” to recognize radiation-induced DSB. This value is reached for both radioresistant and radiosensitive at a dose (dHORM) of about 25 mGy (Figure 2B). At such dose, hormesis is supposed to be maximal. Interestingly, this dose also corresponds to the induction of less than 1 DSB per cell, which is in very good agreement with the hypothesis that hormesis may occur when ATM kinase activity in the nucleus is maximal in the absence of any radiation-induced DSB (Figure 2).
Number of ATM monomers that diffuse into the nucleus for radioresistant and radiosensitive cells. Data plots represent the numerical simulations derived from the formula 5 (panel A) and 3 (panel B) validated in the study by Bodgi and Foray. 49 The following conditions were taken: S/L = 100 π 10−6 and χmono·Imono =1.5 for (group I) radioresistant cells (solid lines) and 3.8 for (group II) radiosensitive cells (dotted lines) as proposed in the study by Bodgi and Foray. 49 The A panel shows the simulated data as a function of the dose with the indicated repair times. The B panel shows the simulated data as a function of the dose at 10 minutes divided by the number of DSB taken as 40xD (black lines) or not (red lines). DSB indicates DNA double-strand breaks
Literature and our data are therefore consistent with the existence of a hormesis phenomenon preferentially observed in radioresistant cells and triggered by a single dose belonging to the (20-75 mGy) dose range. The common feature of the radioresistant cells is a complete radiation-induced DSB recognition and repair for doses lower than or equal to 2 Gy. 47 However, even if radiation-induced DSB recognition and repair are complete, some radioresistant cells may show a low but significant genomic instability reflected by spontaneous SSB due to spontaneous reactive oxygen species or nuclease activity. 53 At doses belonging to the [20-75 mGy] range, the number of radiation-induced SSB does not exceed 75 SSB per cell, which is statistically not sufficient to create additional DSB. However, high spontaneously nuclease activity may also contribute to the aging and genomic instability by increasing spontaneous DNA damage. 53,54 For example, a significant amount of spontaneous SSB may influence the cellular metabolism: a flux of additional nuclear ATM monomers (like that produced in the [20-75 mGy] dose range) may help in reducing the biological consequences of spontaneous DNA breaks and their impact on genomic instability and aging.
In the frame of the RIANS model, as far as the end points chosen are dependent on the nuclear ATM kinase activity, the biological consequences of hormesis may be of great diversity. Indeed, the protein kinase ATM was shown to be upstream a cascade of phosphorylation of its substrates by obeying a functional and temporal hierarchy: phosphorylation of the ATM substrates involved in DNA damage recognition, then in DNA damage repair, then in cell cycle checkpoint, and finally in cellular death pathways. 55 Furthermore, the ATM kinase activity is required to insure genomic integrity and inhibition of any abnormal cellular process. 55 Interestingly, all the steps of the molecular and cellular response to radiation cited in Table 2 are known to be facilitated by a very high ATM kinase nuclear activity, which makes the RIANS model consistent with the hormesis phenomenon. The consequences of a high ATM kinase activity can also be observed by downstream cellular scale. This is notably the case of clinical features occurring at the tissue scale like immune and inflammation reactions. 55 However, further experimental data related to ATM are needed to establish a quantitative and qualitative link between cellular event and tissue reactions. Furthermore, all these end points cannot describe a hormesis phenomenon at the same extent. For example, the recognition and the repair of DSB and chromosome damage are “bounded” notions: When all the damage are recognized or repaired, a hormetic dose cannot help in recognizing or repairing more. Consequently, if the recognition or the repair of DSB and chromosome damage is taken as an end point, the dose–response may show a threshold but not a J-shaped curve and therefore cannot reveal hormesis as defined in Introduction.
Hence, in the frame of RIANS model, hormesis may be dependent on the nuclear ATM kinase activity and help in reducing spontaneous cell death, genomic instability, and aging in radioresistant cells. Further investigations are however needed to consolidate such hypothesis.
Toward a Unified Mechanistic Model for the Specific Low-Dose Phenomena?
Interpretation of HRS Phenomenon in the Frame of the RIANS Model
The RIANS model provides a relevant explanation for other specific low-dose effects like hypersensitivity to low doses (HRS)
49
and AR.
5
At this stage, we found useful to investigate whether the RIANS model may unify these specific low-dose phenomena. Let us focus on single-dose phenomena and summarize our previous findings about the HRS phenomenon:
– Major features: First described by Lambin et al
56
and Marples and Joiner,
57
the HRS phenomenon results in a significant reduction of clonogenic cell survival, increase in chromosome breaks, micronuclei, unrepaired DSB, or gene mutations after a single low-dose dHRS generally belonging to the (100-800 mGy) dose range. The maximal HRS effect is generally obtained at dHRS = 200 mGy and corresponds to a biological effect equivalent to a dose 5 to 10 times higher.
58
-60
Unlike hormesis, HRS has been more generally observed in human cells with moderate radiosensitivity (group II) rather than in radioresistant one (group I).
5
– Interpretation of the RIANS model: In the HRS-positive cells, the number of ATM monomers that diffuse in the nucleus is not sufficient enough to permit the full recognition of the radiation-induced DSB. Consequently, although the number of radiation-induced DSB is low at dHRS (about 8 DSB per cell at 200 mGy), the number of unrepaired or misrepaired DSB remaining 24 hours after irradiation can reduce survival or increase transformation. The numerical relevance of the RIANS model to explain HRS was published elsewhere (Figures 3 and 4).
49

Schematic illustrations of the RIANS model to explain HRS and hormesis phenomena. In (group II) radiosensitive cells, the HRS phenomenon is the result of the sequestration of radiation-induced ATM monomers (red symbols) by overexpressed ATM substrates (blue squares): some DSB remain either unrepaired or misrepaired. In (group I) radioresistant cells, hormetic doses may produce ATM monomers diffusing in nucleus without producing DSB. Such ATM monomers may contribute to reduce spontaneous DNA breaks, oxidative stress, genomic instability, and aging. DSB indicates DNA double-strand breaks; HRS, hypersensitivity to low doses; RIANS, radiation-induced nucleoshuttling of the ATM protein.

Schematic illustration of the HRS and hormesis phenomena as a function of dose. When biological effect is plotted against dose, the HRS and hormesis phenomena are revealed by a J- and a Λ-shaped curves, respectively. These 2 low-dose phenomena reach their maximal extent at different doses, dHORM and dHRS. HRS indicates hypersensitivity to low doses.
Altogether, the literature and our data suggest that:
– Radioresistant (group I) cells are not HRS positive but may be hormesis positive – Radiosensitive (group II) cells may be HRS positive but are not hormesis positive – Hyper-radiosensitive (group III) cells are neither HRS positive nor hormesis positive
The HRS and Hormesis Contributions in the Debate About Low-Dose and Low Dose Rate Effects
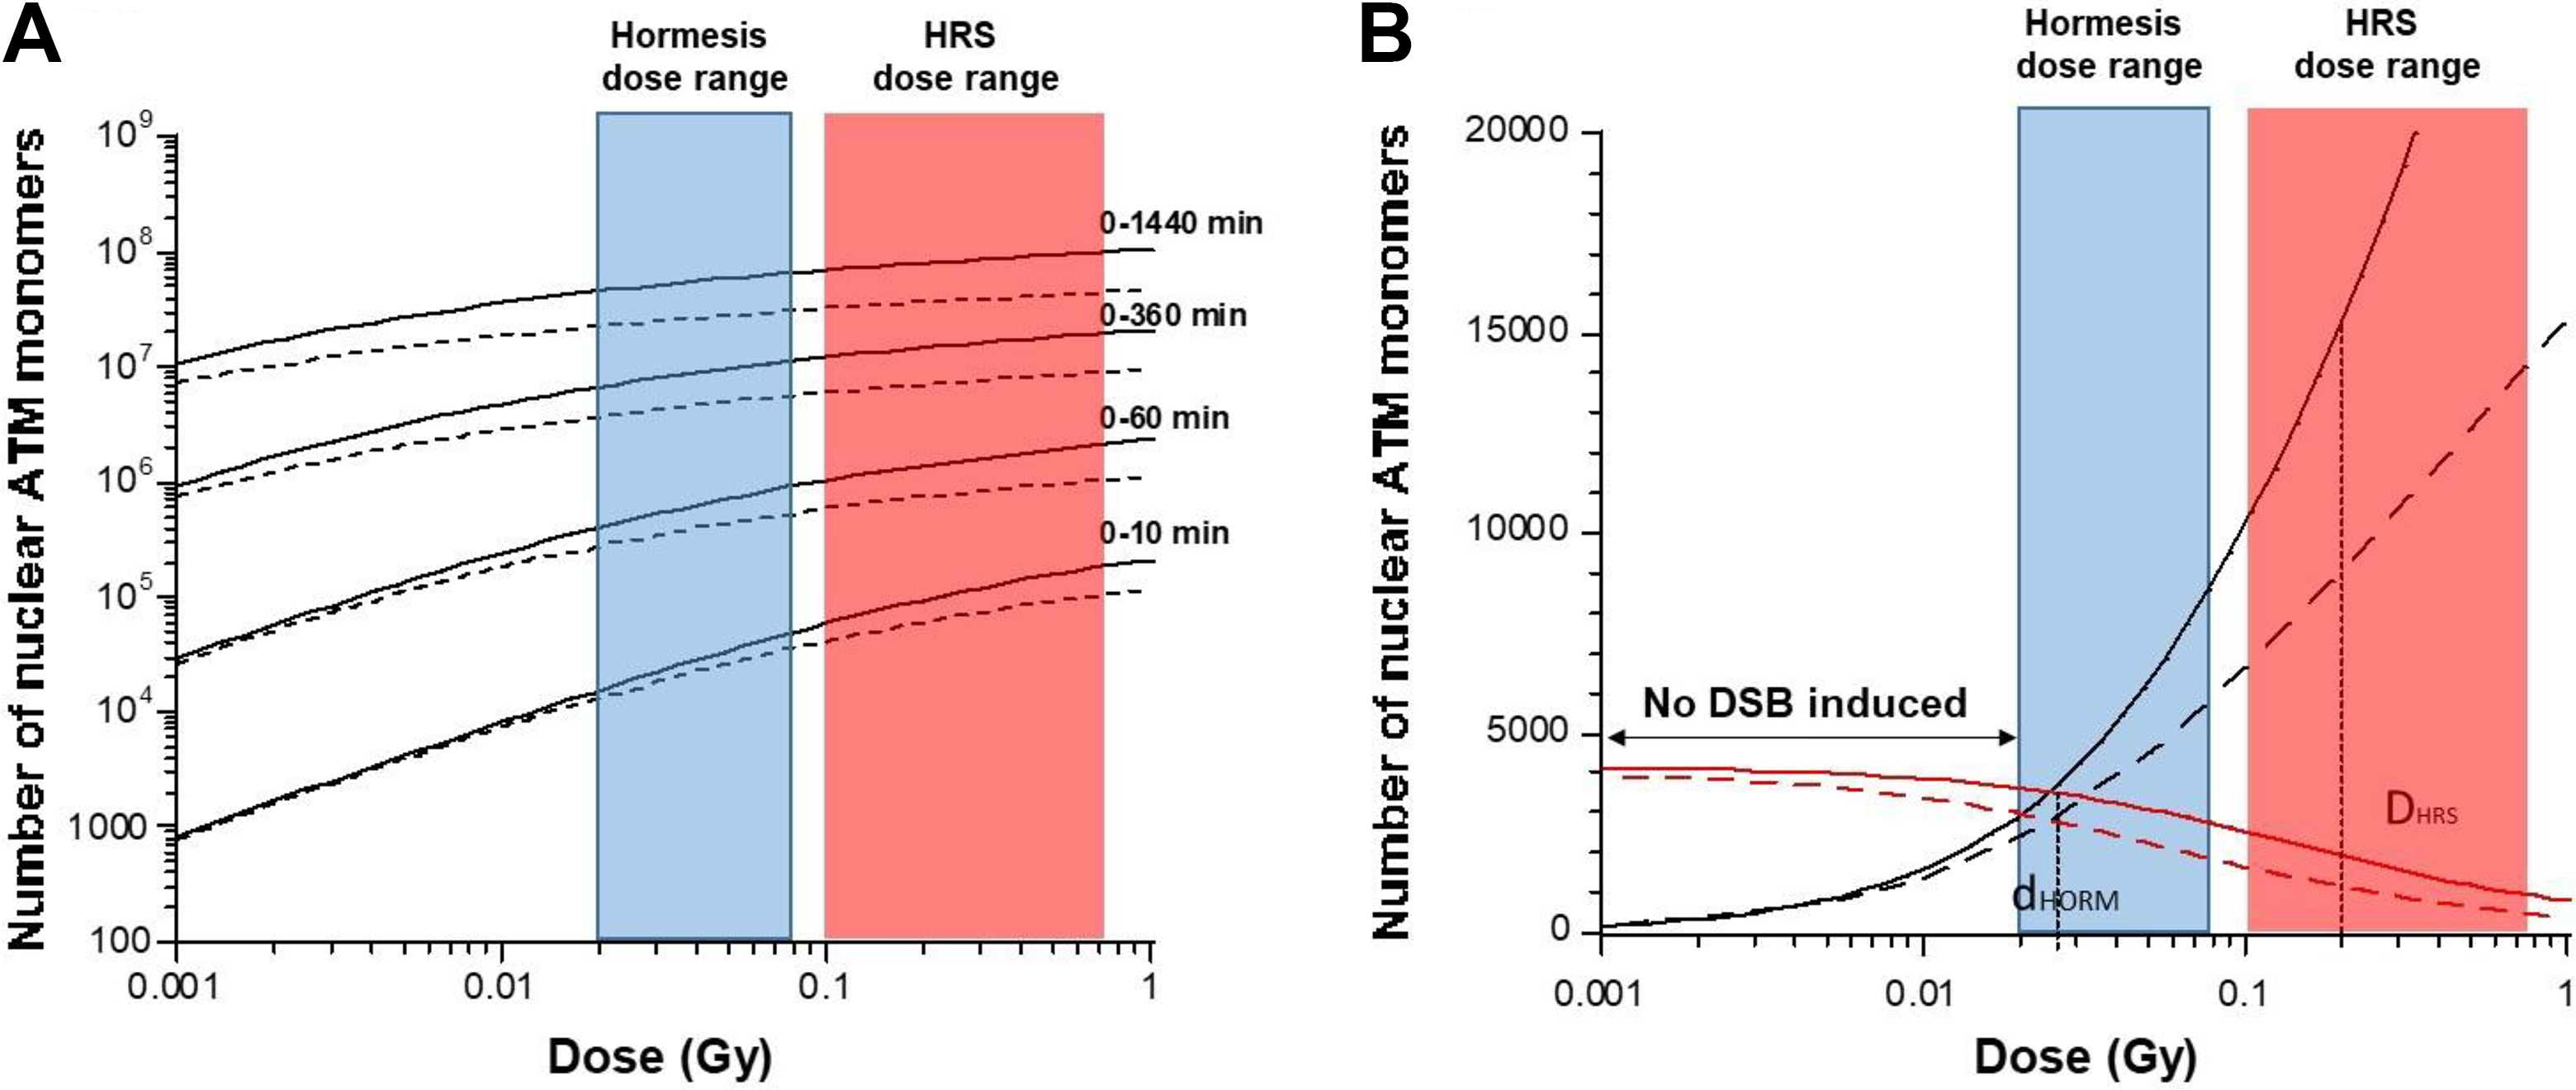
The HRS and hormesis phenomena are specifically observed in radiosensitive and radioresistant cells, respectively. What are the relative contributions of these 2 phenomena in the linear non-threshold (LNT)/nonlinear threshold (NLT) models? The hormesis and HRS phenomena are revealed by a J- and a L-shaped dose-dependent curves, respectively. At high dose-rate (like for the Japanese atomic bomb), hormesis and HRS occur at distinct dose ranges ([20-75 mGy] and [100-800 mGy], respectively). There is a number of examples of data showing both HRS and hormesis with a peak around 200 mGy and a reverted peak around 25 mGy. This is notably the case of the relative risk about solid tumor incidence among the Japanese atomic bomb survivors 41,61,62 (Figure 5A-D).
Representative examples of dose–response curves showing both hormesis and HRS phenomena. A, Solid cancer dose response from Hiroshima bomb survivors reproduced from figure 3 of the study by Pierce and Preston 61 with permission. The thick solid line is the fitted linear gender-averaged excess relative risk (ERR) dose response at age 70 after exposure at age 30 on data in the 0- to 2-Gy dose range. The points are nonparametric estimates of the ERR in dose categories. The thick dashed line is a non-parametric smooth of the category-specific estimates, and the thin dashed lines are 1 standard error above and below this smooth. 61 B, Female breast cancer dose–response from Hiroshima bomb survivors reproduced from figure 14 of the study by Pierce and Preston 61 with permission. Same characteristics as panel (A). 61 C, Solid cancer dose response from Hiroshima bomb survivors reproduced from figure 4 of the study by Ozasa et al 41 with permission. Excess relative risk for all solid cancer in relation to radiation exposure. The black circles represent ERR and 95% CI for the dose categories, together with trend estimated based on linear (L) with 95% CI (dotted lines) and linear-quadratic (LQ) models using the full dose range, and LQ model for the data restricted to dose <2 Gy. 41 D, Solid cancer dose response from Hiroshima bomb survivors reproduced from figure 1 of the study by Preston et al 62 with permission. Age-specific cancer rated over the 1958 to 1994 follow-up period relative to those for an unexposed person, averaged over the follow-up and over sex, and for age at exposure 30. The dashed curves represent ± standard error for the smoothed curve. The straight line is the linear risk estimate computed from the range 0 to 2 Sv. Because of apparent distinction between distal and proximal zero-dose cancer rates, the unity baseline corresponds to zero-dose survivors with 3 km of the bombs. The horizontal dotted line represents the alternative baseline if the distal survivors were not omitted. The inset shows the same information for the fuller dose range. 62 E, Leukemia dose–response from UK national registry for nuclear workers study reproduced from figure 1 of reference 63 with permission. Nonlymphatic leukemia ERR estimates and 90% CI 2-year-lagged external cumulative dose category with linear ERR/Sv estimate and associated 90% CI reference lines. 63 F, Schematic illustration of the double occurrence of hormesis and HRS and its theoretical evolution as far as the dose rate decreases (gray arrows). The dashed line shows theoretical data from lower dose rate than those shown with solid line. The dotted line corresponds to theoretical data from dose rate lower than 0.1 Gy/min with which hormesis and HRS compensate each other in a horizontal threshold. In all the panels, the red and green arrows indicate the maximal HRS and hormesis effect, respectively. CI indicates confidence interval; HRS, hypersensitivity to low doses.
In the epidemiological data obtained from individuals exposed to lower dose rates (like for nuclear workers), the general slope of the relative risk decreases, which is consistent with a lower rate of DSB induction and a longer time allocated to repair DNA damage 63 (Figure 5E). However, in these cases, the peak reflecting HRS is found shifted to lower values (about 150 mGy in the example shown in Figure 4E). How to explain this trend? In a previous report, the maximal HRS effect was found to correspond to a constant irradiation time of less than 30 seconds irrespective of dose, dose rate, and cellular model. 59 Consequently, the lower the dose rate, the lower the dose dHRS. Hence, from these hypotheses, we can propose a general model in which the risk decreases with dose rate together with the dose at which HRS is maximal (Figure 5F). Interestingly, our previous paper about HRS predicts that dHRS is included in the (20-75 mGy) range for dose rates lower than 0.1 Gy/min. 59 In other terms, HRS and hormesis can compensate each other for dose rates lower than 0.1 Gy/min and a horizontal threshold should appear, which may render more difficult a significant discrimination of both phenomena (Figure 5F). Although further investigations are needed to consolidate this model, it is the first time to our knowledge that dose rate is included in a model of risk whose mechanistic interpretation is proposed. It is noteworthy that the available data do not permit to predict hormesis with repeated/chronic exposures yet.
We examined thereafter the conditions of the occurrence of both hormesis and HRS phenomena in the frame of the LNT/NLT models. Interestingly, by simulating radiosensitive and radioresistant subpopulations, the LNT model appears to be numerically incompatible with both hormesis and HRS phenomena, while the NLT models seem to be more permissive (Figure 6). Hence, if significant subpopulations of radioresistant hormesis-positive individuals and radiosensitive HRS-positive individuals exist, the NLT can take into account them as far as the statistical error is acceptable. Again, further investigations are needed to document this hypothesis.
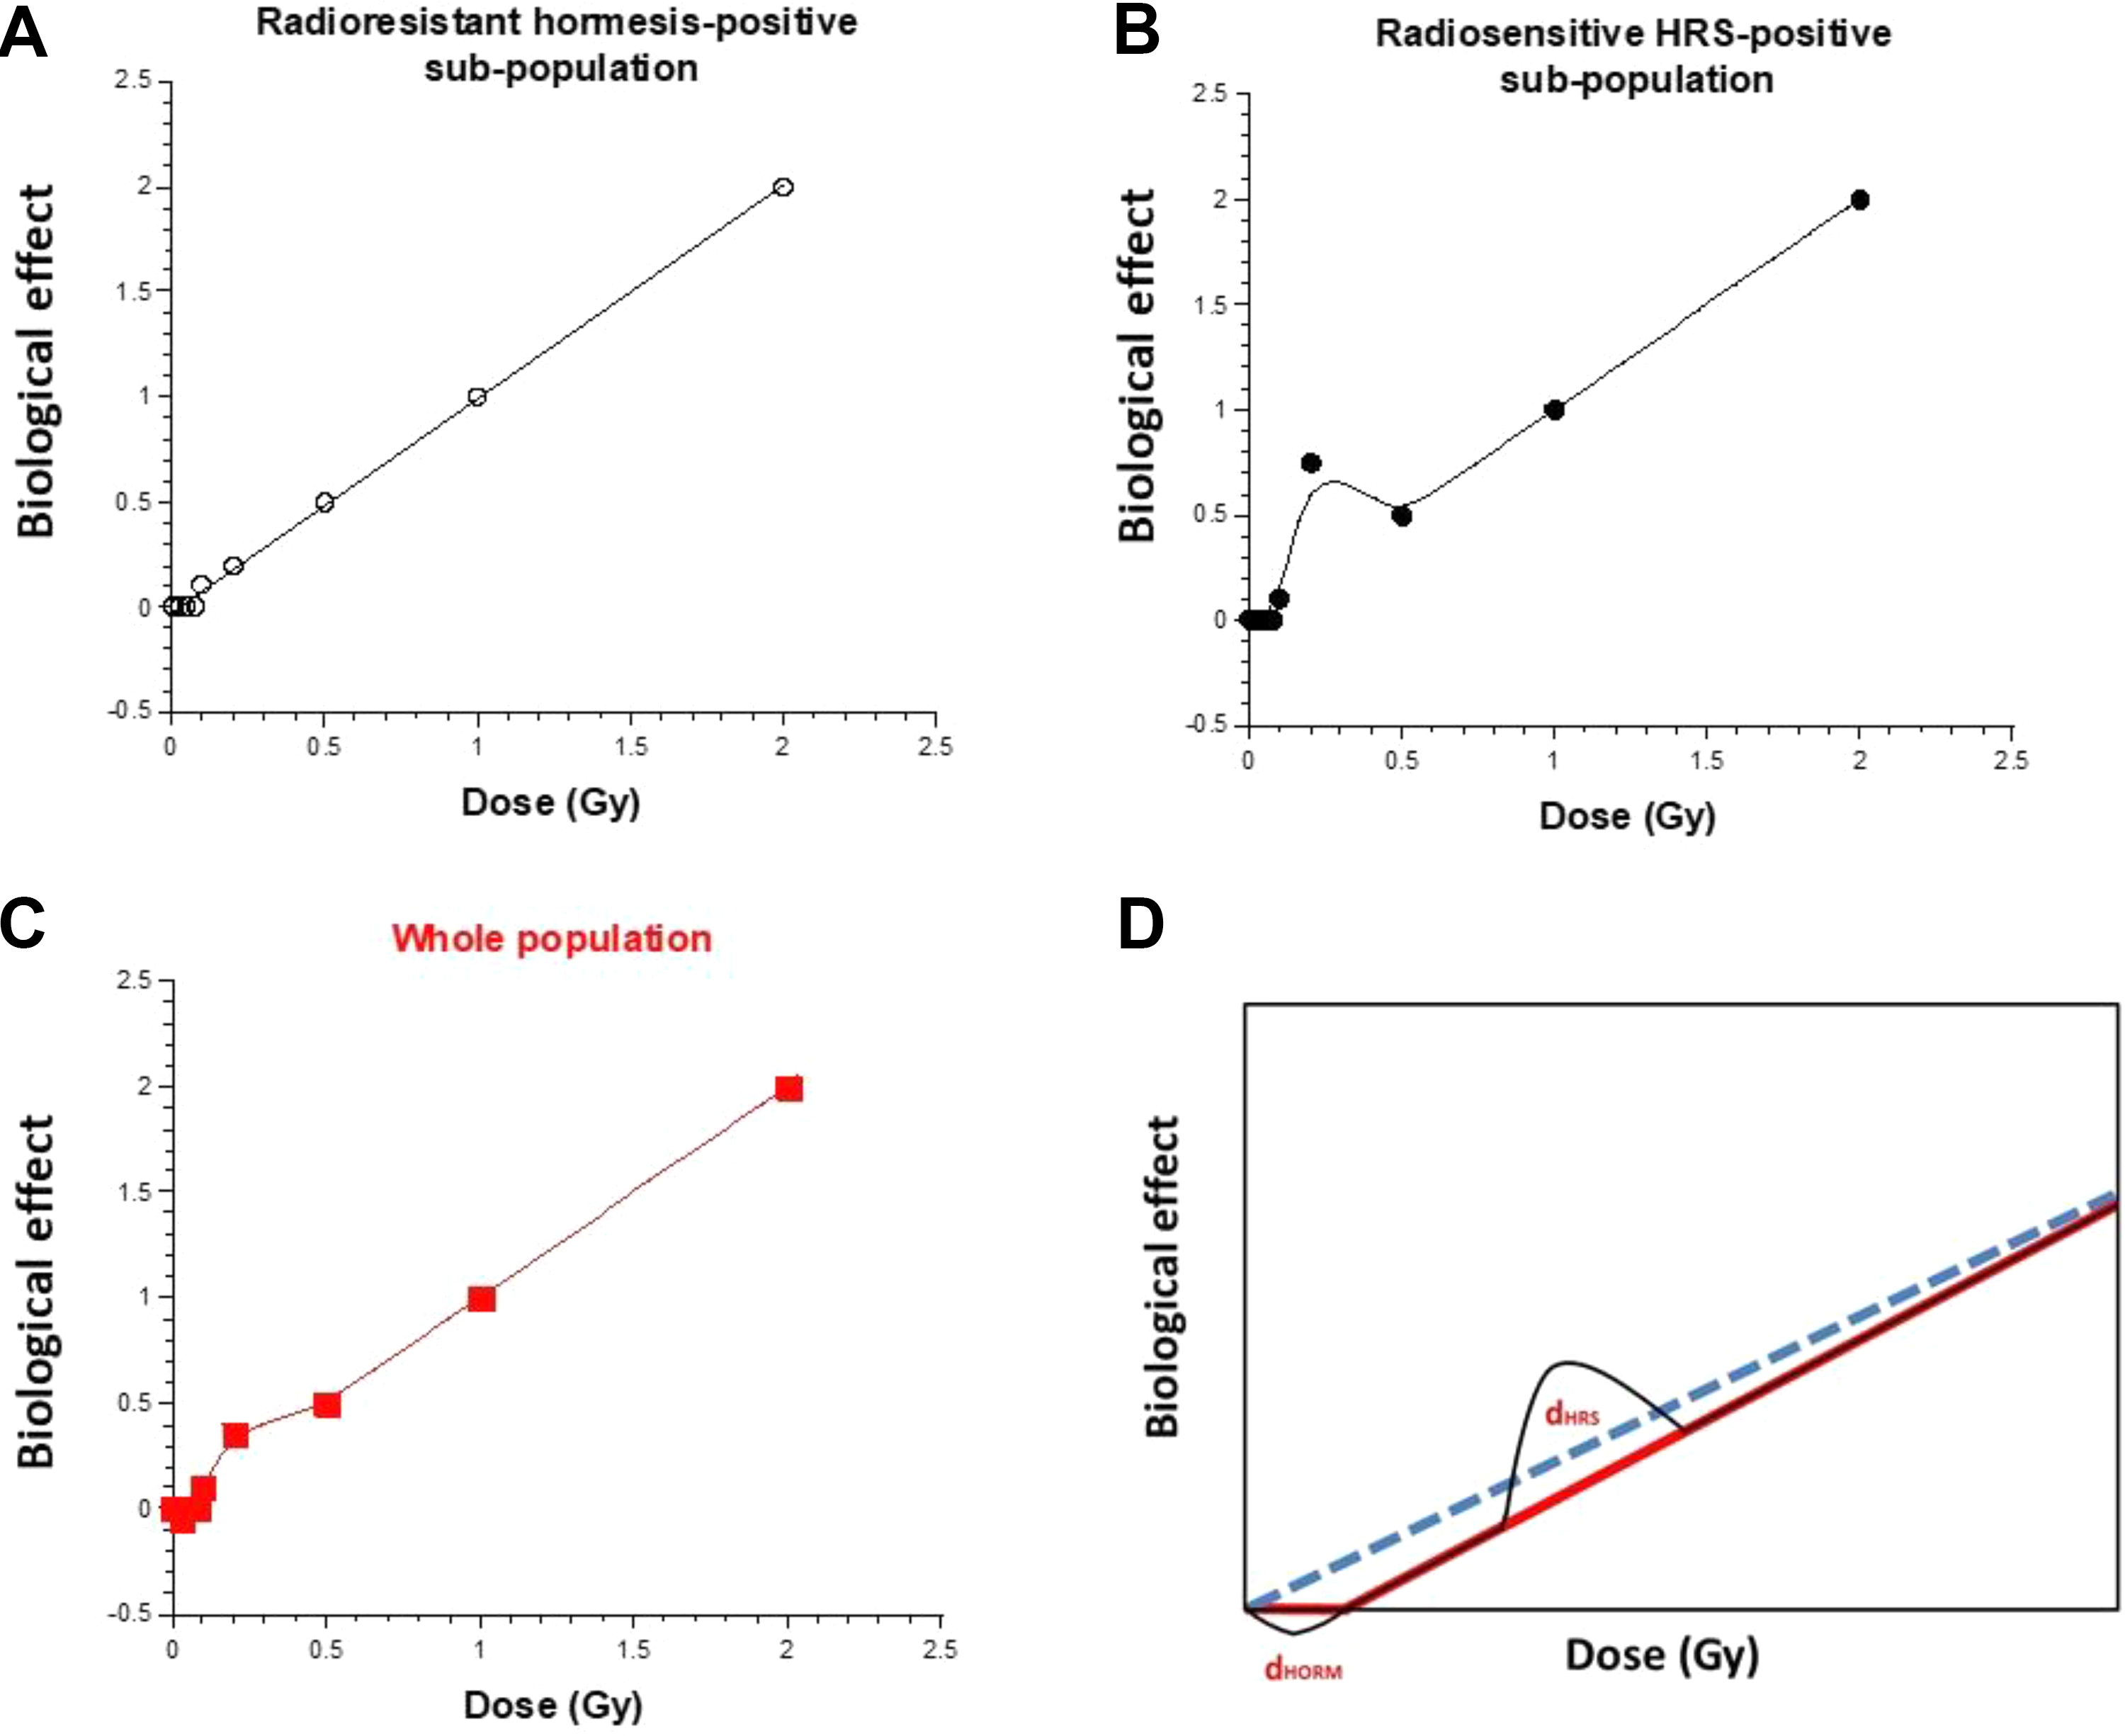
Simulation of a biological effect of irradiation on a population composed of radioresistant and radiosensitive individuals. We considered an LNT model for the radioresistant subpopulation (fixed at 80% of the whole population) and an NLT model for the radiosensitive subpopulation (fixed at 20% of the whole population). In addition, we considered that 20% of radioresistant individuals exhibit hormesis (panel A) and 20% of radiosensitive individuals exhibit HRS (panel B). The panel (C) shows the weighted sum of the curves shown in panels (A) and (B). The panel (D) shows the schematic illustration that the double occurrence of hormesis and HRS cannot be fitted properly by the LNT. HRS indicates hypersensitivity to low doses; LNT, linear non-threshold; NLT, nonlinear threshold.
Conclusions
Hormesis is an experimentally validated radiobiological phenomenon observed in a variety of cellular models, with numerous experimental protocols and with various molecular, cellular, and clinical end points that describe a J-shaped dose–response. However, when the human data are considered, the number of reports about hormesis is very low. Still to date, no mechanistic model describing hormesis has been proposed. From a review of literature, hormesis appears to occur in the (20-75 mGy) dose range and preferentially in human radioresistant cells/individuals. This dose range corresponds to less than 1 radiation-induced DSB per cell. In the frame of the RIANS model, hormesis appears to correspond to a maximal yield of active ATM monomers in the nucleus, while no DSB is induced by radiation. Such amount of ATM monomers may contribute to reduce spontaneous oxidative stress, genomic instability, and aging with various beneficial consequences. Interestingly, the RIANS model also permits the description of the HRS phenomenon that generally occurs around 200 mGy. For the first time to our knowledge, these 2 low-dose specific phenomena can be considered together in the same unified mechanistic model.
Footnotes
Acknowledgments
The authors thank Christiane Beaufrère for her technical help. The PhD thesis of C.D. is supported by Fibermetrix. The postdoctoral fellowship of M.L.F is supported by the Centre National d’Etudes Spatiales (CNES). This work was supported by the Commissariat General à l’Investissement (Programmes Investissement d’avenir—INDIRA project).
Declaration of Conflicting Interests
The author(s) declared no potential conflicts of interest with respect to the research, authorship, and/or publication of this article.
Funding
The author(s) disclosed receipt of the following financial support for the research, authorship, and/or publication of this article: This work was supported by Commissariat Général à l'Investissement (INDIRA Project), Centre National d'Etudes Spatiales (CNES) (ATHENA projects) and Institut National du Cancer (INCa) (PROUST project).