
Abstract
Nanomaterials are extensively applied in various fields such as industry, medicine, and food and drugs due to their unique properties. In this study, gold nanoparticles were biosynthesized using leaf extract of Azadirachta indica and chloroauric acid salt. We have determined the cytotoxicity, genotoxicity, and apoptotic effect of green gold nanoparticles (gGNPs) on human normal (CHANG) and liver cancer (HuH-7) cells. Before exposure to cells, physiochemical characteristic of gGNPs was characterized using a transmission electron microscope and dynamic light scattering. Cytotoxicity of gGNPs was found dose-dependent, as it was confirmed using 2 methods, namely, 3-(4, 5-dimethylthiazol-2-yl)-2, 5-diphenyltetrazolium bromide and neutral red uptake. The gGNPs provoked intracellular reactive oxygen species (ROS), lipid peroxide, and reduced total glutathione and mitochondrial membrane potential in CHANG and HuH-7 cells in a dose-dependent manner. We have observed that N-acetyl-
Introduction
Natural and anthropogenic nanoparticles (NPs) are extensively applied in industry, consumer products, and drinking water treatment due to their distinctive characteristic conferred by dimensions of nano-sized elements. 1,2 Nowadays, NPs are used in more than 1200 commercial products such as drugs, food storage containers, clothing, and washing machines. 2 These consumer products can discharge NPs into the domestic waste stream during use, cleaning, and disposal leading to NPs in surface waters and potentially ending in drinking waters. 3 Gold NPs (GNPs) are used in drug/gene delivery, diagnostic, and imaging due to its electronic, chemical, and optical nature. 4 Christian et al 5 have reported that gold element is inert, biocapatables, and more reactive than the macroparticles when it converts into nano-sized particles. Also, Pan et al 6 reported the toxicity of GNPs to depend upon the size of the particles. The main significance of the green synthesis is lack of toxic by-products manufactured during metal NP synthesis. 7 We have found some literature about cytotoxicity of GNPs depend upon the size, shape, and surface charge. 8,9 The generation of reactive oxygen species (ROS) inducing oxidative stress is considered as one of the major factors for toxicity of NPs. 10,11 The excess generation of ROS provoked oxidative stress, and as a consequence, the cells are failing to sustain the normal physiological redox-regulated functions. 12,13 The compromise in cell function and growth includes oxidative changes in proteins to produce protein radicals, 14 initiation of lipid peroxidation, 15 DNA damage, 16 modulation in gene expression 17 through activation of redox-sensitive transcription factors, and modulation of inflammation through transduction, 18 inducing genotoxicity and cell death. 19,20
Inhalation and oral routes of exposure are considered one of the imperative routes of NP exposure. Also, cytotoxicity of NPs has been evidenced to depend not only on their shape, surface chemistry, or size but also on the cell line studied. Mateo et al 21 have reported the effect of GNPs-induced cytotoxicity on 2 tumor cell lines, HL-60 and HepG2. Furthermore, the current literature regarding cytotoxic responses of liver exposed to green GNPs (gGNPs) is very limited. So, we chose normal human liver (CHANG) and tumor cells as a model in our study. The objective of this study was to determine the mechanism of comparative toxicity of gGNPs on the CHANG and cancer (HuH-7) cells.
Materials and Methods
Chemical and Reagents
Green GNPs were synthesized using leaf extract of Azadirachta indica and auric chloride (HAuCl4) salt. 5, 5-dithio-bis-(2-nitrobenzoic acid), 3-(4, 5-dimethylthiazol-2-yl)-2, 5-diphenyltetrazolium bromide (MTT), 2, 7-dichlorofluorescin diacetate (H2-DCFH-DA), and dimethyl sulfoxide (DMSO) were obtained from Sigma-Aldrich (St. Louis, MI). Dulbecco modified Eagle medium (DMEM), fetal bovine serum (FBS), and antibiotics were purchased from Gibco, South America. All other reagent-grade chemicals were purchased from local suppliers.
Characterization of gGNPs
The shape and size of gGNPs were observed using transmission electron microscope (TEM; JEOL Inc, Tokyo, Japan) at an accelerating voltage of 80 kV. The average hydrodynamic size and zeta potential of gGNPs in deionized water was examined by dynamic light scattering (DLS; Nano-Zeta Sizer-HT, Malvern, United Kingdom) as described by Alarifi et al. 22 We have used 700 μg/mL for DLS measurement because this is the maximum exposure dose used in cytotoxicity studies.
Cell Culture and NPs Exposure
CHANG and HuH-7 cells were procured from American Type Culture Collection (Manassas, VA). Both cells were grown in DMEM culture medium supplemented with FBS (10%) and 100 U/mL antibiotics at CO2 (5%) incubator at 37°C. Nearly at 80% confluence of both cells, these were subcultured into 96-well plates, 6-well plates, and 25-cm2 flasks according to designed experiments.
The cells were precultured for 24 hours before exposure to gGNPs. The NP powder was suspended in culture medium (1 mg/mL) and diluted according to the experimental concentrations (10-700 µg/mL). Cells were not treated with NPs served as controls in each experiment.
Cytotoxicity End Points
3-(4, 5-dimethylthiazol-2-yl)-2, 5-diphenyltetrazolium bromide assay
The cytotoxicity of gGNPs on CHANG and HuH-7 cells was measured according to Alarifi et al method. 23 Briefly, 1 × 10⁴ cells per well was cultured in culture plate (96-well) and treated with various doses (0, 10, 50, 150, 250, 350, and 700 µg/mL) of gGNPs for 24 hours. After exposure, the culture media were removed from 96-well plates and replaced with culture medium containing MTT solution in an amount equal to 5% of culture volume and incubated for 210 minutes at 37°C until a purple-colored formazan product developed. The developed formazan crystal was dissolved in DMSO. After dissolving the crystal, the absorbance was measured at 570 nm using a microplate reader (Synergy-HT; BioTek, Winooski, Vermont).
Neutral red uptake assay
Also, the cytotoxicity of gGNPs was measured by neutral red uptake (NRU) test as described by Alarifi et al. 23 Briefly 1 × 10⁴ cells per well was plated in 96-well plate and treated with different concentration of gGNPs (0, 10, 50, 150, 250, 350, and 750 µg/mL) for 24 hours. After exposure, the old culture media were removed and 100 µL/well dissolved neutral red dye (50 µg/mL) in culture media was filled and incubated for 4 hours. After incubation, the plate was washed by dye extract and fixative solution, and plate was determined of OD at 570 nm using UV–Vis spectrophotometer (Edinburgh Instruments Ltd, Kirkton Campus, Livingston, UK).
Evaluation of Intracellular ROS
The intracellular ROS generation after treatment of gGNPs was evaluated by applying DCFH-DA as described by Alarifi et al. 23 Briefly, 1 × 10⁴ cells were cultured in black bottom culture plate (96 well) and left for 24 hours for attachment in CO2 incubator at 37°C. Then, both cells were treated with gGNPs for 24 hours. After treatment, the culture plates were washed with chilled phosphate-buffered saline (PBS), and 10 µM DCFH-DA was added per well at 37°C for 1 hour. After 1-hour incubation, the plate was washed and fluorescence intensity was measured at 485 nm excitation and 520 nm emissions using the micro plate reader (Synergy-HT; BioTek). The values were expressed as a percentage of fluorescence intensity relative to the control wells.
Another set of cells (1 × 10³ cells/well in a 6-well transparent plate) were analyzed for intracellular fluorescence using a fluorescence microscope (Olympus CKX 41; Olympus: Center Valley, Pennsylvania), with images taken at 40× magnification.
Efficacy of N-Acetyl-l -Cysteine in GGNPs-Derived Cytotoxicity and Oxidative Stress
The protecting effect of N-acetyl-
Preparation of Cell Extract
To observe the oxidative stress due to exposure of gGNPs in CHANG and HuH-7 cells, cell lysate of control and exposed cells for lipid peroxide (LPO) and total GSH was prepared. Both cells were grown in 75-cm 2 culture flasks and exposed to gGNPs (0, 10, 150, 250, 350, and 700 µg/mL) for 24 hours. The cell lysate was prepared by scraping the cells in chilled PBS. Then, the cells were lysed using cell lysis buffer (1 × 20 mM Tris-HCl [pH 7.5], 150 mM NaCl, 1 mM Na2EDTA, 1% Triton, 2.5 mM sodium pyrophosphate). Then, the cells were centrifuged at 13 000 rpm at 4°C, and the supernatant was collected and maintained on ice for further assays.
Lipid peroxide assay
Level of LPO was determined by measuring the formation malondialdehyde (MDA) using the method of Ohkawa et al. 24 The absorbance of the cooled mixture was observed at 532 nm and was converted to MDA and expressed in terms of percentage when compared to the control.
Glutathione assay
The total GSH content (GSH/GSSG) was measured using a commercial colorimetric assay kit (ab156681). The total GSH was expressed in terms of percentage as compared to the control.
Mitochondrial Membrane Potential Test
Mitochondrial membrane potential (MMP) test was determined in CHANG and HuH-7 cells (5 × 10 4 cells per well) after exposure to gGNPs (50, 350 µg/mL) for 24 hours according to Alarifi et al method. 23 Both cells were washed with chilled PBS and added fluorescent dye (Rh-123, 10 mM/ well of 6 chambered slides) for 60 minutes at 37°C in the dark. After incubation, the plate was washed with PBS, and 50 fluorescence images per concentration were captured using an upright fluorescence microscope (OLYMPUS CKX 41) with 40× magnification.
Chromosome Condensation in CHANG and HuH-7 Cells
After exposure to gGNPs, the chromosome condensation in both cells was evaluated using DAPI stain through a confocal microscopy. In brief, the cells were washed with chilled PBS and added 10-µL DAPI and incubated for 30 minutes in the darkroom. After incubation, the cells were washed and images were captured using fluorescence microscopy.
Evaluation of Caspase-3 Enzyme
Caspase-3 enzymes play a significant role in cell death. Caspase-3 enzyme was determined in gGNPs exposed and unexposed CHANG and HuH-7 cells using Bio-Vision colorimetric assay kits (BioVision, Inc., Milpitas, CA).
Quantitative Real-Time Polymerase Chain Reaction Analysis
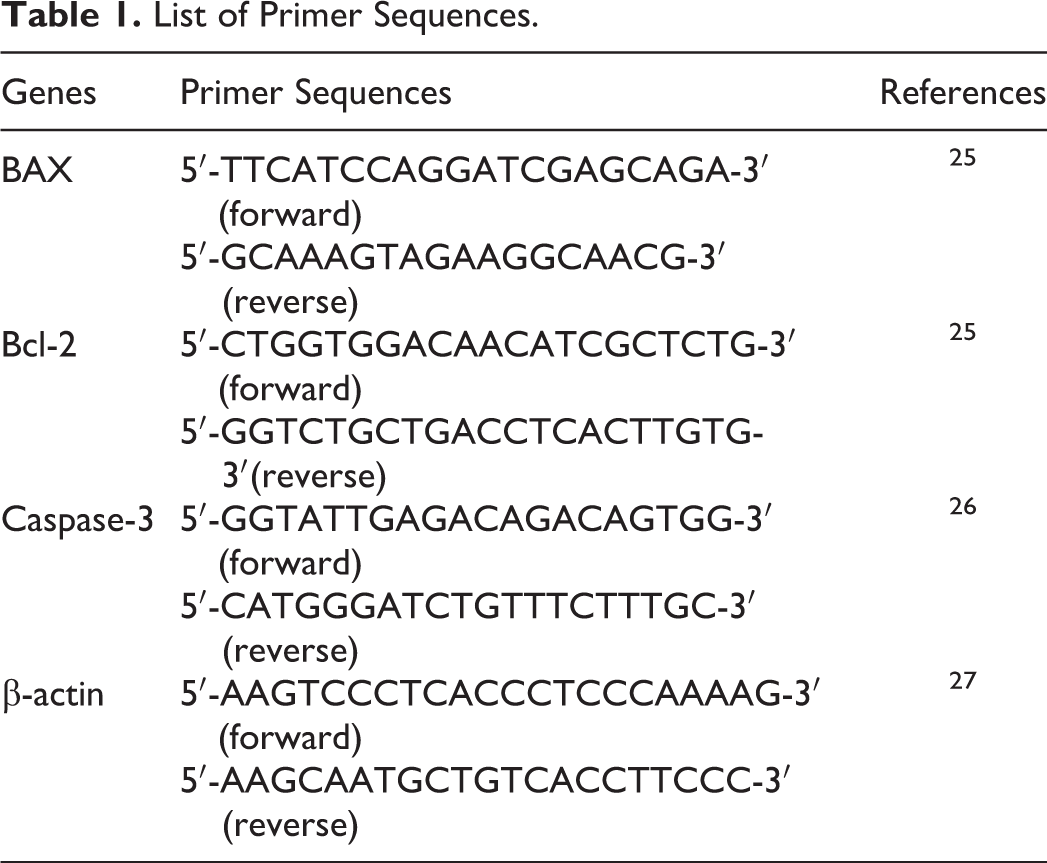
Both cells were subcultured in 75-cm 2 flask and exposed to gGNPs (150 and 350 μg/mL) for 24 hours. Total RNA was isolated by applying the Qiagen RNeasy Mini Kit (Valencia, California) according to the manufacturer’s instructions. The quantity of RNA was measured by Nanodrop 8000 spectrophotometer (Thermo-Scientific, Wilmington, Delaware), and RNA quality was checked on 1% agarose gel using the gel documentation system (Universal Hood II; BioRad, Hercules, California). Complementary DNA was from total RNA by the reverse transcriptase using Moloney murine leukemia virus (Promega, Madison, Wisconsin) and oligo (dT) primers (Promega) according to the manufacturer’s protocol. Quantitative real-time polymerase chain reaction (PCR) was done using the QuantiTect SYBR Green PCR kit (Qiagen) using the ABI PRISM 7900HT Sequence Detection System (Applied Biosystems, Foster City, CAlifornia). The sequences of primer for bax, bcl-2, caspase-3, and β-actin used in this study are given in Table 1. 25 -27 Expressions of selected genes were normalized to the β-actin gene, which was used as an internal housekeeping gene.
List of Primer Sequences.
In Vitro Comet Assay
Comet assay is a visual and sensitive technique to determine single-strand DNA damage in treated cells. CHANG and HuH-7 cells were grown in 6-well culture plates (Nunc) at 5 × 10 5 cells/well for 24 hours and exposed to gGNPs (0, 10, 350, and 700 µg/mL) for 24 hours at 37°C. The DNA damage was determined by applying Comet Assay Kit (3-well slides; ab238544) according to the manufacturer’s instructions. The DNA damage was expressed as tail extent moment value (product of the tail length by the tail content) and olive tail moment using Comet score software.
Protein Assay
The total protein content in the cell extracts was estimated by the Bradford method 28 using bovine serum albumin as the standard.
Statistical Analysis
The statistical differences were determined by analysis of variance, and the differences were noted (P < .05, .01). The data are expressed as average of 3 independent experimental points.
Results
Characterization of GGNPs
We have characterized gGNPs by TEM and DLS methods. Figure 1A denotes the TEM image of gGNPs. The average diameter of gGNPs was around 55 ± 3.5 nm. The hydrodynamic size of gGNPs in deionized water was 160 nm. Further, the zeta potential of gGNPs in water was ∼12.4 mV (Figure 1B).

Schematic diagram of production of green gold nanoparticles (gGNPs). A, Transmission electron microscopy (TEM) image of gGNPs. B, Size distribution of gGNPs (%). C, Size of gGNPs (mm) by dynamic light scattering (DLS).
Cytotoxicity
CHANG and HuH7 cells were exposed to different doses of NPs (10-700 μg/mL) for 24 hours, and the cell viability was determined by MTT and NRU tests. The gGNPs induced cytotoxicity in a dose-dependent manner.
The MTT results indicated that viability of CHANG cells was decreased up to 99%, 98.5%, 95%, 89%, 83%, and 74%, while HuH-7 cell viability decreased to 98%, 99%, 90.4% 85%, 70.8%, and 66% for same concentrations 10, 50, 150, 250, 350, and 700 μg/mL, respectively (Figure 2A). Furthermore, we have confirmed the cytotoxicity of gGNPs on these cells by NRU test, and result of NRU test (Figure 2B) was in accordance with MTT test.

Cytotoxicity of gold nanoparticles (GNPs) on CHANG and HuH-7 cells for 24 hours, as determined by (A) 3-(4, 5-dimethylthiazol-2-yl)-2, 5-diphenyltetrazolium bromide (MTT) tests, (B) neutral red uptake (NRU) tests. Each value represents the mean ± standard error (SE) of 3 experiments (N = 3). *P < .05 and P < .01 versus control.
Oxidative Stress
Oxidative stress was determined in CHANG and HuH-7 cells. After treatment of NPs, the production of ROS was measured as the intensity of fluorescence image. The exposed cells showed more green fluorescence of dichlorofluorescin (Figure 3B, C, E, and F), and it is considered as a biomarker of ROS production in comparison to control (Figure 3A and D). Figure 3G showed production of ROS in a dose-dependent manner. Lipid peroxide was increased and total GSH quantity was declined in exposed cells when compared with control cells in a dose-dependent manner in both the cells (Figure 4A and B). Figure 4C showed the correlation between induction of intracellular ROS generation and reduction of GSH in CHANG and HuH-7 cells after exposure to gGNPs for 24 hours.
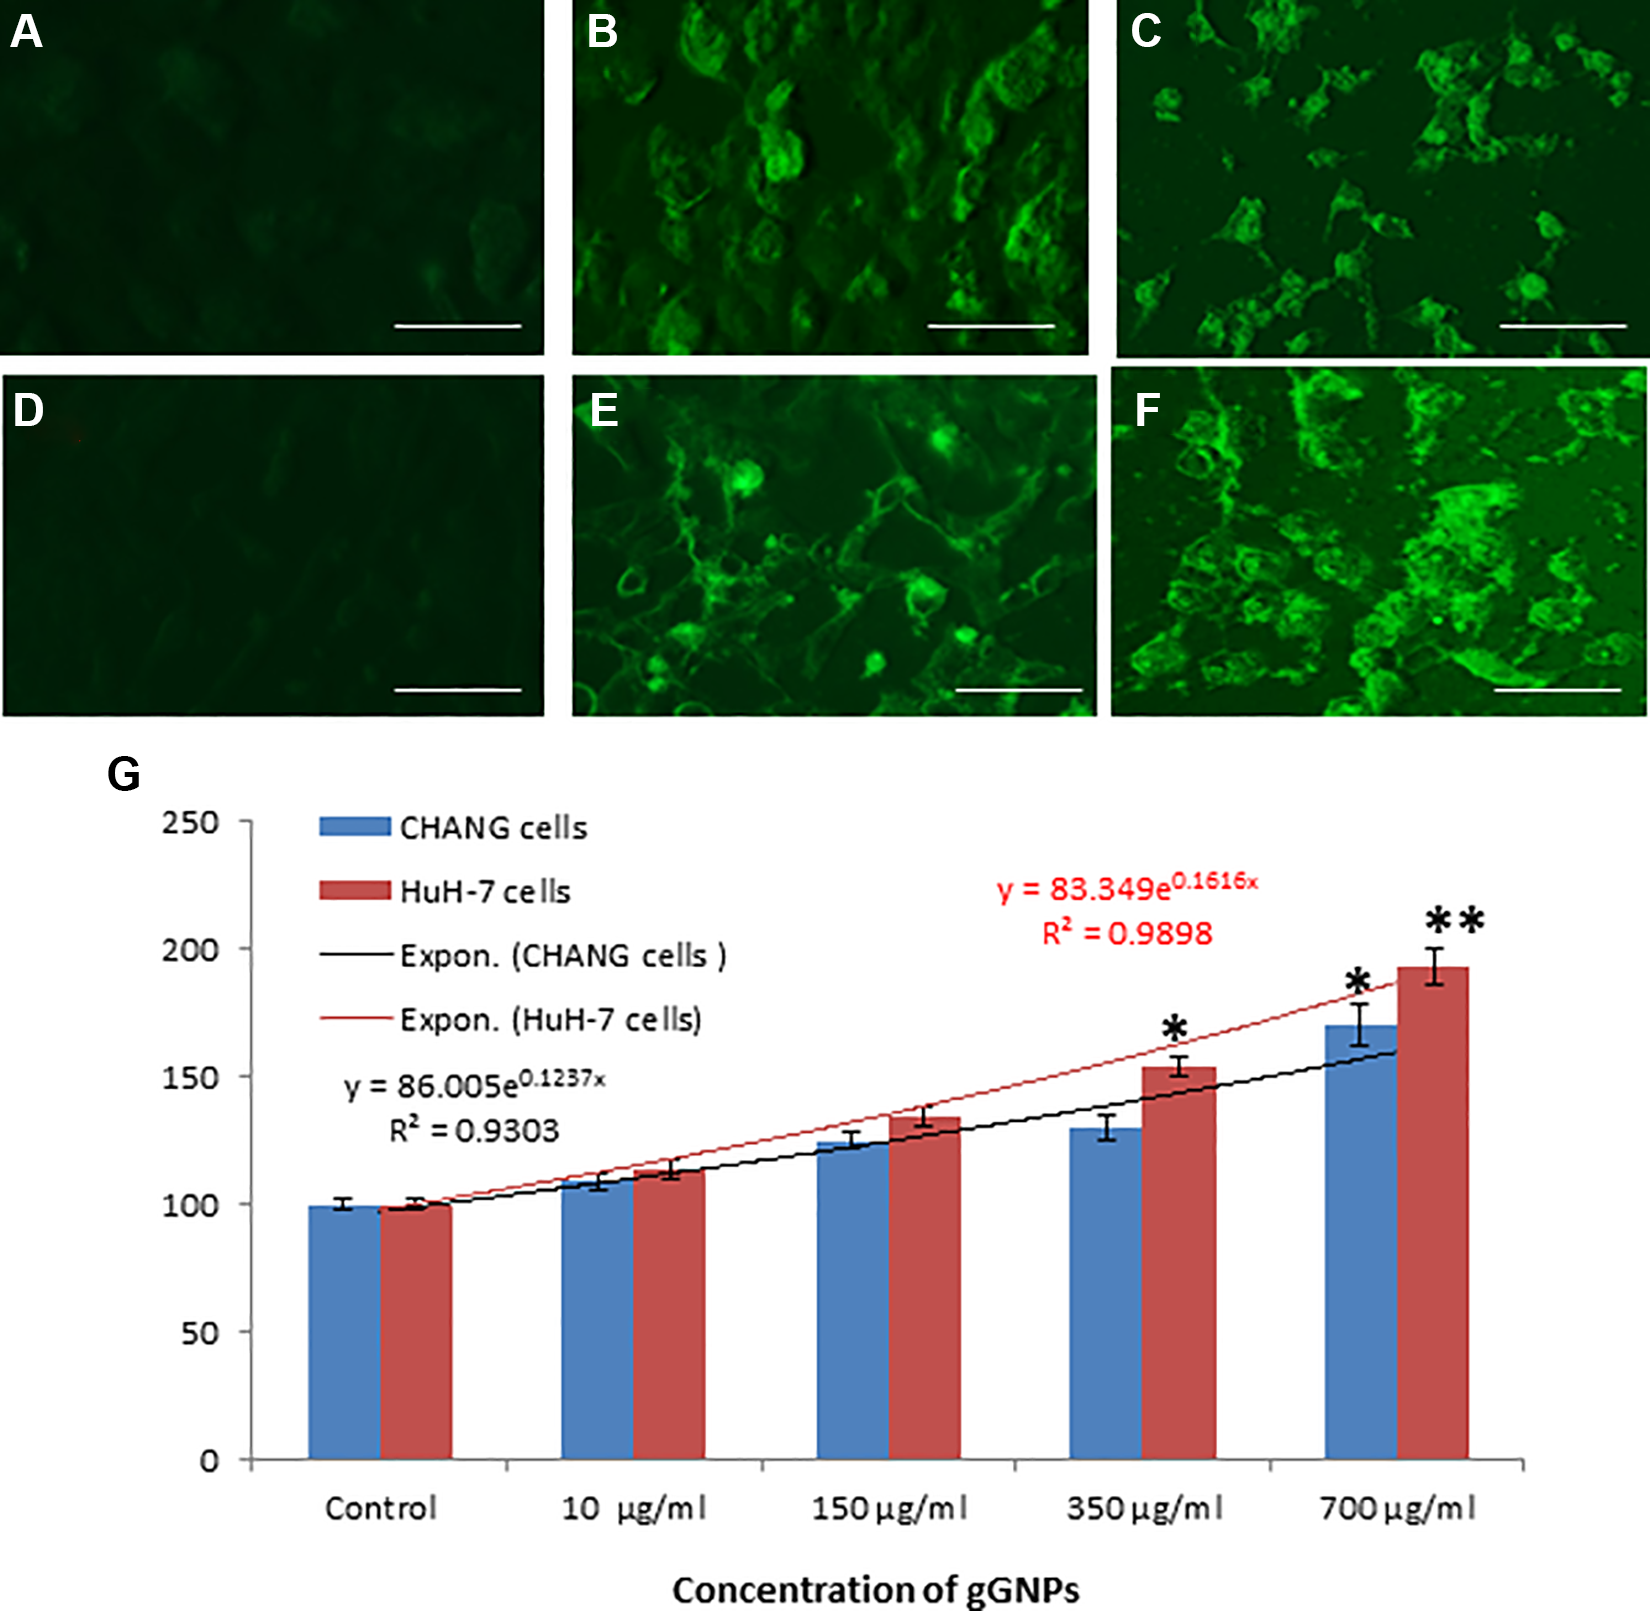
Intracellular reactive oxygen species (ROS) generation after exposure to green gold nanoparticles (gGNPs). A, CHANG cells untreated; (B) CHANG cells treated at 350 µg/mL; (C) CHANG cells treated 700 µg/mL; (D) HuH-7 cells untreated; (E) HuH-7 cells treated 350 µg/mL; and (F) HuH-7 cells treated 700 µg/mL for 24 hours. G, Percentage of ROS production due to gGNPs in both cells. Each value represents the mean ± standard error (SE) of 3 experiments. *P < .05 and **P < .01 versus control. Scale bar is 40 μm.

A, Level of lipid peroxide (LPO). B, Decreased level of glutathione (GSH). C, Correlations between intracellular reactive oxygen species (ROS) generation and reduction of GSH in CHANG and HuH-7 cells after exposure to green gold nanoparticles (gGNPs) for 24 hours. Each value represents the mean ± standard error (SE) of 3 experiments. *P < .05; **P < .05 versus control.
Effect of NAC on Cytotoxicity and Oxidative Stress of gGNPs
The role of oxidative stress in cell toxicity of CHANG and HuH-7 due to gGNPs was confirmed using NAC (10 mM) which is a well-known ROS inhibitor. The data of these experiment showed that NAC scavenged the production of ROS and reduced cytotoxicity of respective NPs in both the cells (Figure 5A and B).

Effect of N-acetyl-l-cysteine (NAC) on green gold nanoparticles for 24 hours in CHANG and HuH-7 cells (A) Percentage of MT1 reduction in 24 hours. B, Percentage of ROS generation in 24 hours. Each value represents the mean ± standard error (SE) of 3 experiments. *P = .05 analysis between without NAC and with NAC.
Finally, it is observed that cell toxicity and oxidative stress due to NPs was a little bit more in HuH-7 cells in comparison to CHANG cells. However, the mechanism of cytotoxicity of gGNPs was same in both CHANG and HuH-7 cells.
Mitochondrial Membrane Potential
Some researchers reported that MMP was compromised during the apoptotic process of cells. 22 In this study, we found that red fluorescence intensity of Rh-123 dye was lowered in both cells after exposure to gGNPs in comparison to control cells. The decrease in the fluorescence intensity of Rh-123 dye indicates loss of MMP, and it was dose-dependent in both the cells (Figure 6).

Green gold nanoparticles induced concentration-dependent mitochondrial membrane potential in CHANG and HepG2 cells at 24 hours. Scale bar is 50 μm.
Green GNP-Induced Apoptosis
The chromosome condensation was observed using DAPI staining, and more condensed chromatin was found in CHANG (Figure 7B and C) and HuH-7 cells (Figure 7E and F) at 350 and 700 µg/mL of gGNPs exposure in comparison to control CHANG (Figure 7A) and HuH-7 cells (Figure 7D), respectively.
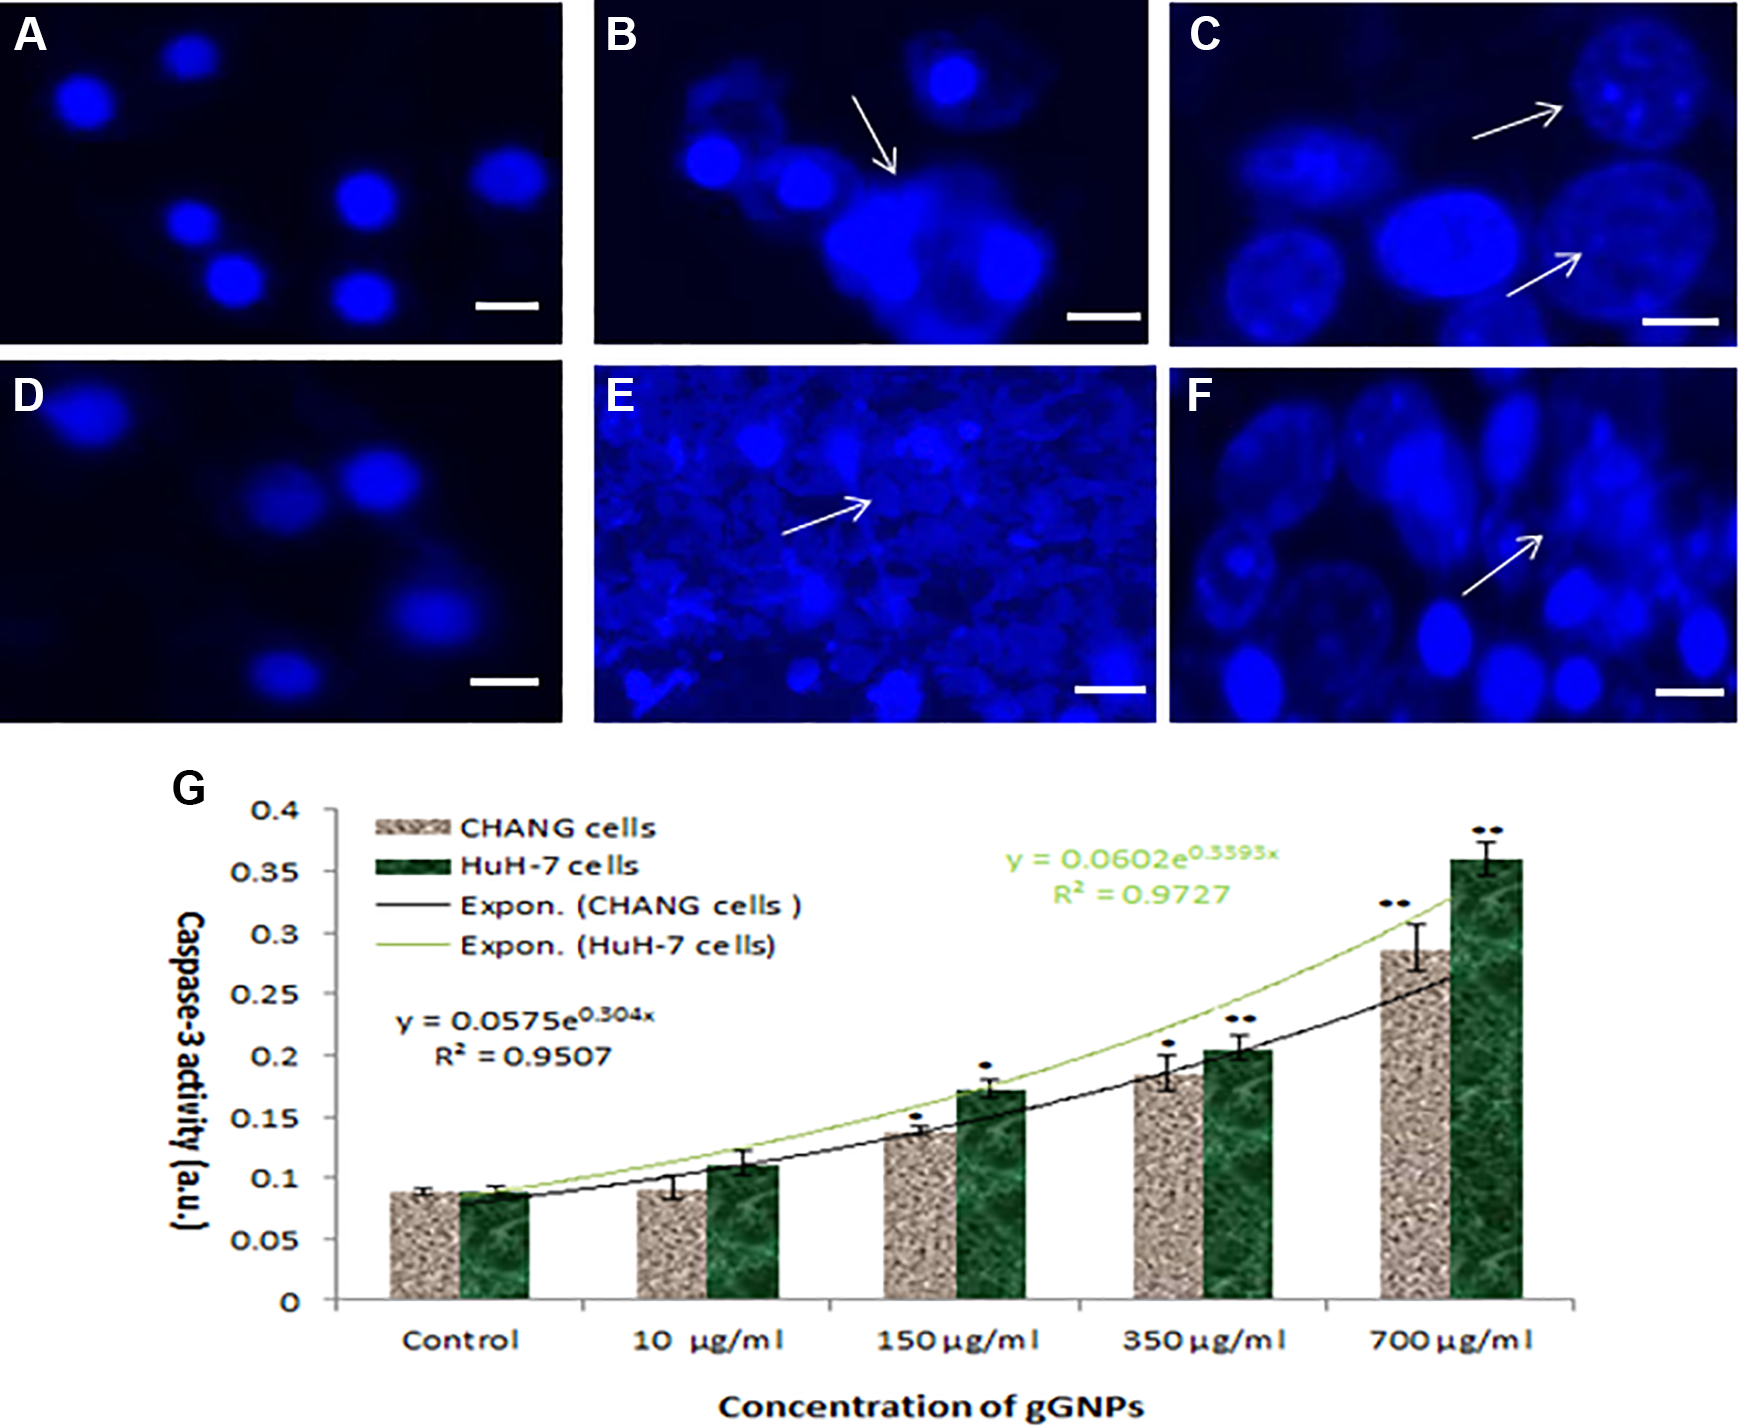
Condensation of chromosome after exposure to green gold nanoparticles (gGNPs). A, CHANG cells untreated. B, CHANG cells treated at 350 μg/mL. C, CHANG cells treated 700 μg/mL. D, HuH-7 cells untreated. E, HuH-7 cells treated 350 μg/mL. F, HuH-7 cells treated with 700 μg/mL for 24 hours. G, Caspase-3 activity due to gGNPs in both the cells. Each value represents the mean ± standard error (SE) of 3 experiments. *P < .05 and **P < .01 versus control. Scale bar is 50 μm.
We have analyzed the level of caspase-3 in CHANG and HuH-7 cells. The level of caspase 3 was increased according to concentrations (Figure 7G). Also, we have confirmed the induction of apoptosis using quantitative real-time PCR to determine the involved apoptotic genes (bax, bcl2, and caspase-3) in CHANG and HuH-7 cells exposed to gGNPs (350 µg/mL). The data showed that gGNPs change the regulation of apoptotic genes in both cells (Figure 8). We have observed more expression of caspase-3 genes and downregulation of bcl2 and upregulation of bax genes.
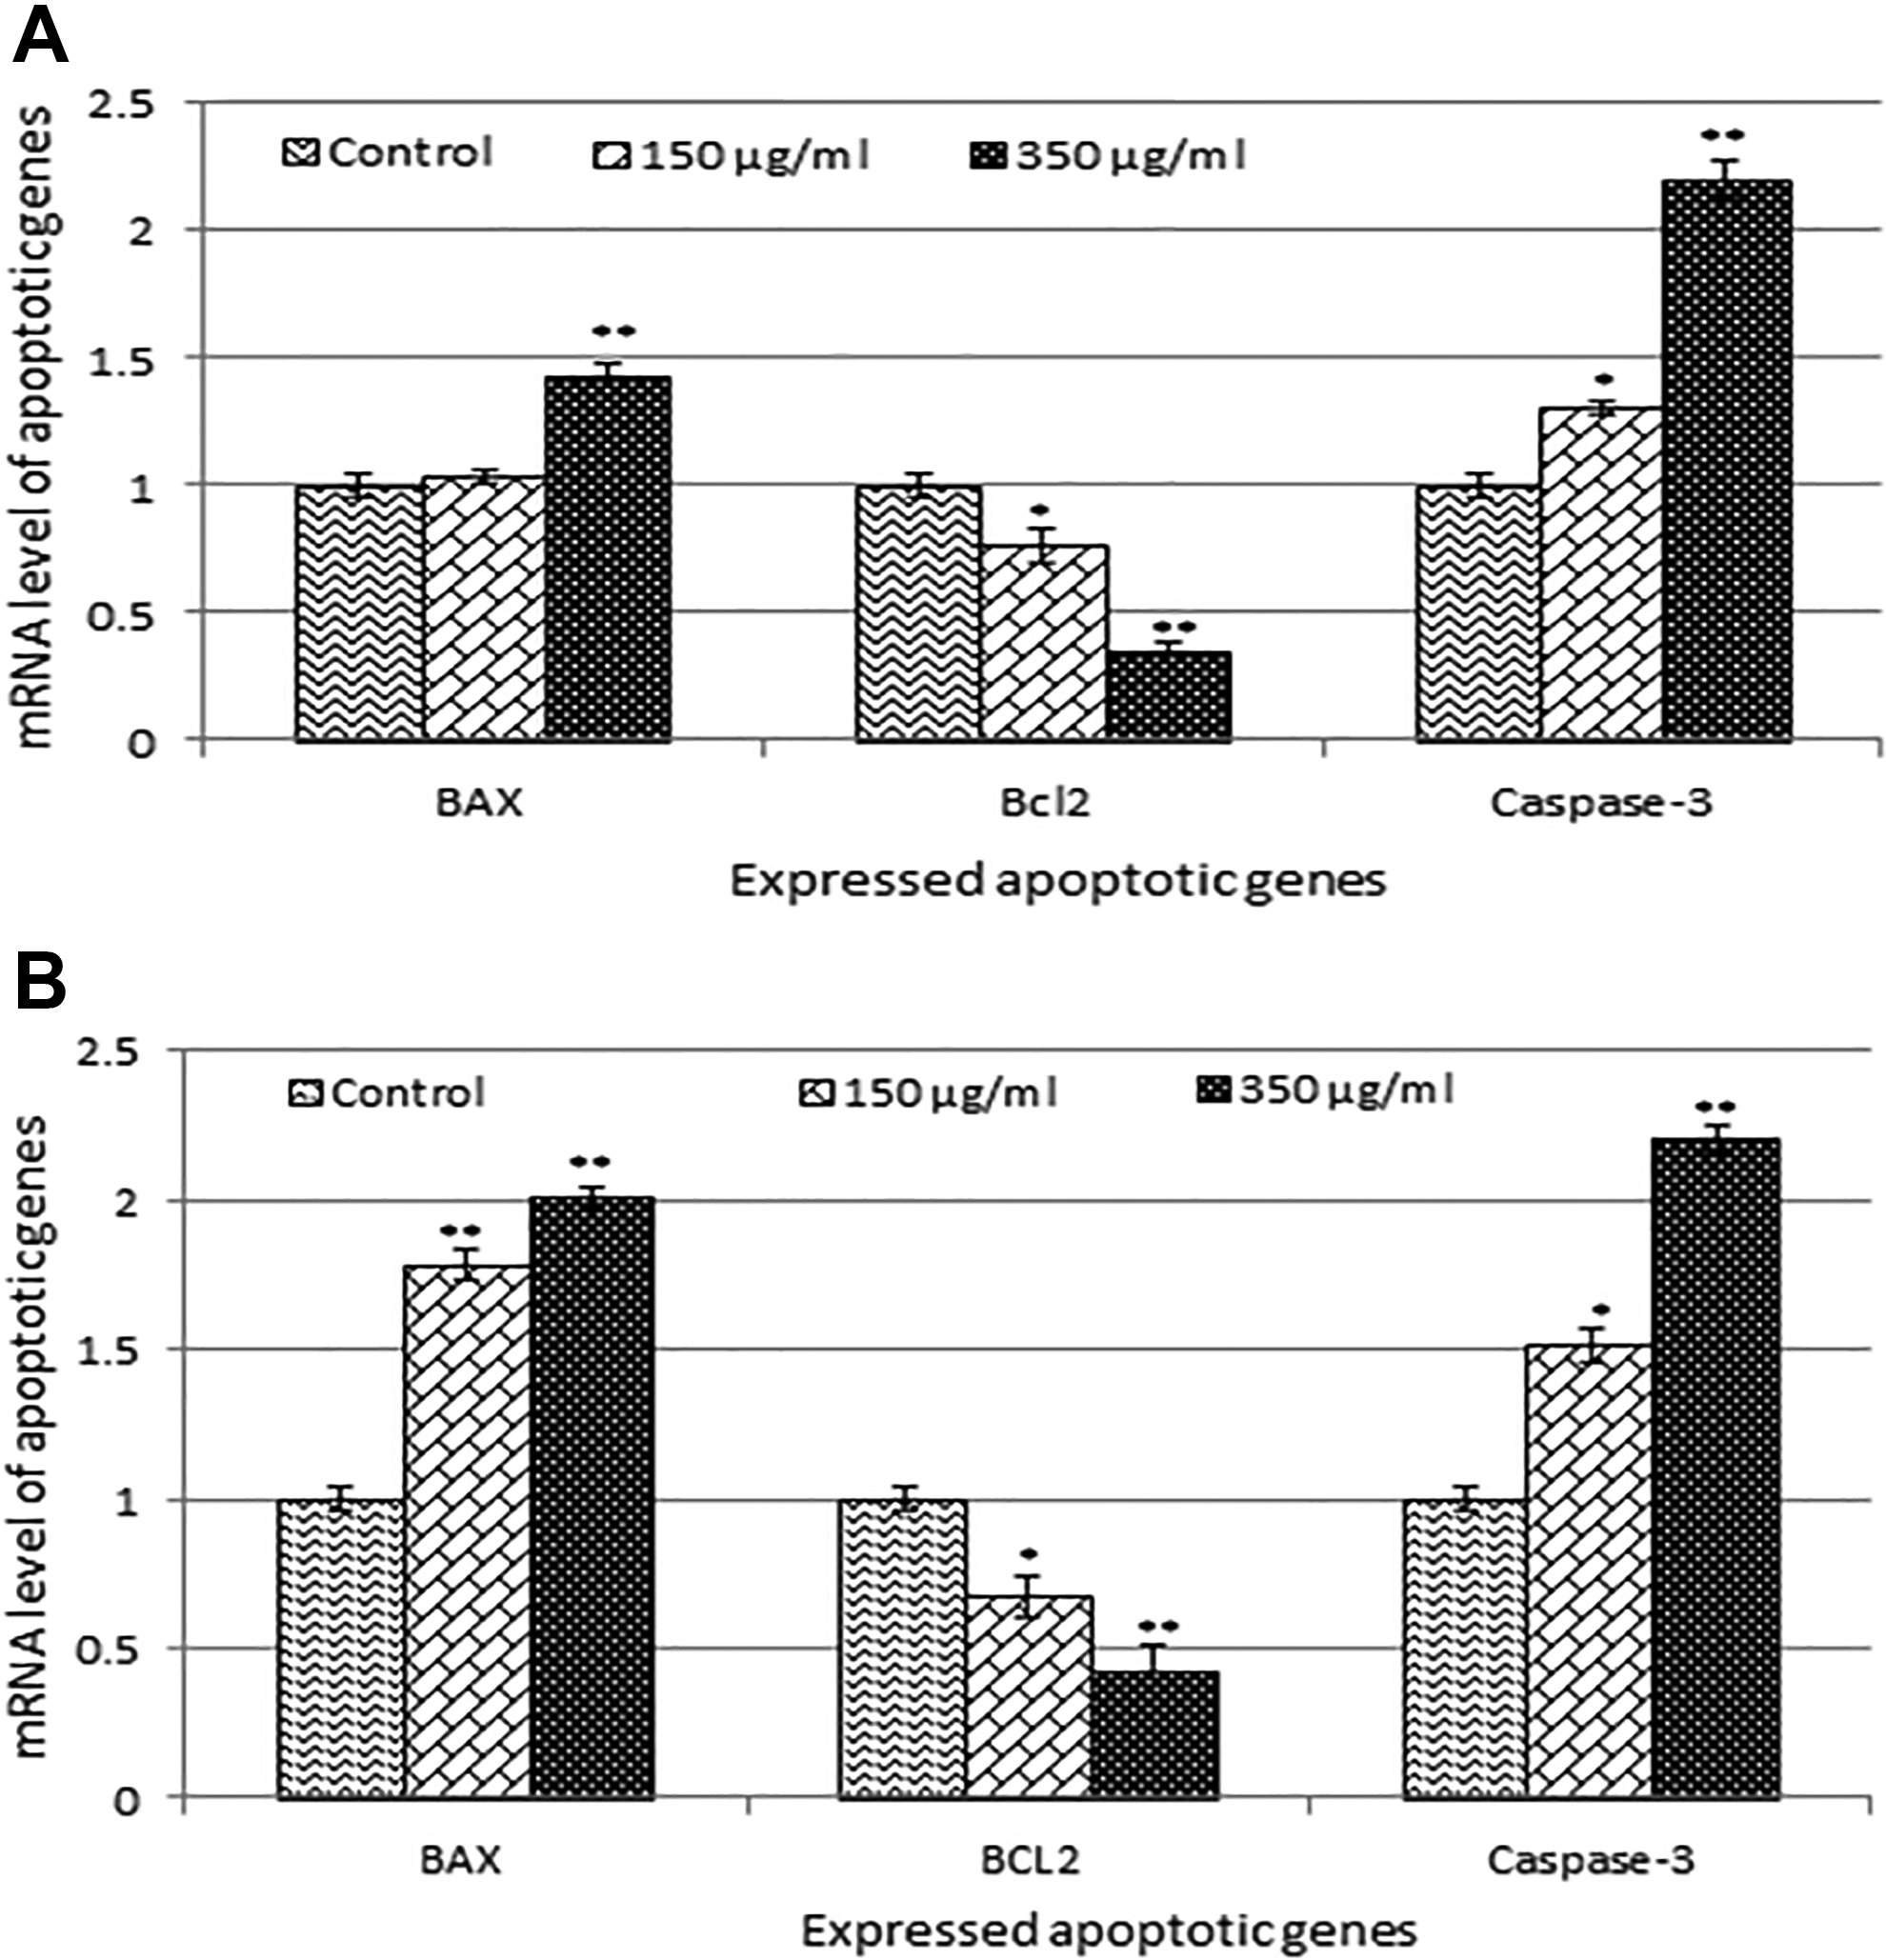
Quantitative real-time polymerase chain reaction (PCR) analysis of messenger RNA (mRNA) levels of apoptotic genes in CHANG and HuH-7 cells after exposure to green gold nanoparticles (gGNPs; 150 and 350 µg/mL for 24 hours). A, Expression of Bax, Bc12, and caspase-3 genes in CHANG cells in 24 hours. B, Expression of Bax, Bc12, and caspase-3 genes in HuH-7 cells in 24 hours. Results are expressed average ± standard error (SE) of triplicate experiments. *P < .05 and **P < .01 versus control.
DNA Damage
We have observed the fragmentation of DNA due to exposure of gGNPs, and it was determined as % tail DNA and olive tail moment in the control and exposed cells. Both cells exposed to gGNPs and showed more DNA damage in exposed cells than in control cells. The maximum DNA damage was found at 700 µg/mL gGNPs in CHANG and HuH-7 cells (Figure 9).

A and B, DNA strand breakage in CHANG and HuH-7 cells after green gold nanoparticles (gGNPs) exposure for 24 hours. Images representing DNA damage in CHANG and HuH-7 cells exposed to gGNPs for 24 hours. C, Control CHANG cells. D, CHANG cells at 350 μg/mL gGNPs. E, CHANG cells at 700 μg/mL gGNPs. F, Control HuH-7 cells at 350 μg/mL gGNPs. H, HuH-7 cells at 700 μg/mL gGNPs. Each value represents the mean ± standard error (SE) of 3 experiments. *P < .05 and **P < .01 versus control. Scale bar is 20 μm.
Discussion
Nanotechnology is a pioneering field in science and technology with much application in biomedical fields and producing of new materials. Gold NPs have been found useful in the field of drug delivery. The size and shape of NPs are affecting its application in drug transporter. The large size of the particles created problem in drug delivery. Nowadays, biosynthesized metallic NPs using plant extract has been receiving more attention as it is a simple and viable alternative against chemical and physical methods with their potential applications in nanomedicine. Shankar et al 29 have synthesized stable GNPs from geranium leaves (Pelargonium graveolens) with variable size including rod, flat sheet, and triangle.
In this experiment, we have analyzed cytotoxicity and DNA-damaging potential of the synthesized gGNPs in CHANG and HuH-7cells. Green GNPs inhibited cell proliferation in a concentration-dependent manner, and HuH-7 cells are more sensitive to gGNPs than CHANG cells. The change in morphology of CHANG and HuH-7 was observed using AO/EB staining, and these alterations are correlated with cytotoxicity of gGNPs. The apoptotic nuclei of both cells at 700 µg/mL could be identified by their distinctively marginated and fragmented appearance. In the control cells without exposure, the cell nuclei were intact and normal. To investigate whether the proliferation of cell was inhibited by the apoptotic response, we have determined apoptotic cells using Annexin-V-FITC and PI staining after exposure to gGNPs. The genotoxic potential of gGNPs was determined using comet assay, and more DNA damage occurred at higher concentration of NP exposure. We measured the LPO and GSH levels in both cells after exposure to gGNPs, which are markers of oxidative stress. Lipid peroxide can give rise to more radicals and fragment biomolecules with ROS. Green GNPs induce injury to the cell lysosome as demonstrated by NRU uptake. The current finding corroborated with our previous work of silver-doped graphene oxide nanocomposite and green platinum NPs toxicity on human hepatic normal and carcinoma cells and HEK293 cells, respectively. 30,31
This study demonstrates that gGNP is an inducer of apoptosis in liver cells, although its effect takes place more slowly than with DNA-damaging NPs and after a long dormant time. The gGNP-induced apoptosis was led by the activation of caspase-3, which is observed at 150, 250, 350, and 700 µg/mL NP exposure by evaluation of caspase-3 activity by enzyme-linked immunosorbent assay and real-time PCR. Activation of caspase-3 was accompanied by downregulation of bcl2 and upregulation of bax and p53 genes. All these events led the appearance of the morphological signs of apoptosis, which were observed in a large percentage of cells after exposure of gGNPs. When free radicals come in close contact with the cellular organelles, they may oxidize and reduce macromolecules (DNA, lipids, proteins), resulting in significant oxidative damage to the cell. Green GNPs reduced viability of cells, increased ROS generation, and LPO level and reduced GSH in CHANG and HuH-7 cells. The DNA damage and oxidative stress as observed in the present study are in the findings of Alarifi et al 23 in the human hepatocarcinoma cells for nanoalumina and Alkahtane 32 in the A549 for indium tin oxide NPs.
We observed gGNP-induced cytotoxicity in CHANG and HuH-7 cells, and the results corroborated with the findings of Kumar et al 33 in ovarian cancer cells for different sized GNPs. Green GNPs induced oxidative stress in a dose-dependent manner, as it was proved by declination in ROS production and lipid peroxidation. Green GNPs provoked apoptosis in both cells as confirmed by compromise of MMP and downregulation bcl2 and upregulation of bax and caspase-3 apoptotic genes and DNA fragmentation. It is also valuable to message that HuH-7 cells are more sensitive to gGNPs than CHANG cells.
Conclusion
It is concluded based on our result that gGNPs induced cytotoxicity and apoptotic change in HuH-7 and CHANG cells. The toxicity of gGNPs may be induced due to oxidative stress. It is also valuable to notice that HuH-7 cells are more sensitive to gGNPs than CHANG cells. Further investigations are underway to find out the mechanisms of toxicity due to gGNPs at an in vivo level.
Footnotes
Authors’ Note
The data used to support the findings of this study are included in this article.
Declaration of Conflicting Interests
The author(s) declared no potential conflicts of interest with respect to the research, authorship, and/or publication of this article.
Funding
The author(s) disclosed receipt of the following financial support for the research, authorship, and/or publication of this article: This research was funded by the Deanship of Scientific Research at Princess Nourah Bint Abdulrahman University, through the Research Funding Program (Grant No# FRP-1440-4).