
Abstract
Chemoprevention strategies employ the use of compounds to inhibit the initiation, promotion, and progression phases of carcinogenesis. The successful chemopreventative candidate must therefore (1) selectively inhibit growth of transformed cells and (2) be administered on a frequent basis to confer maximal protection. Phytochemicals are a subclass of bioactive plant secondary metabolites that exhibit antioxidative, anticarcinogenic, and anti-inflammatory properties contributing to proper cell function. To assess the effectiveness of these compounds warrants an understanding of their cytotoxic mode of action. In this study, p53 variant human colon carcinoma cell lines were chronically exposed to varying concentrations of the phytochemicals—curcumin, andrographolide, and d-limonene—to determine the role of p53-induced cytotoxicity, with p53-mutant and p53-deficient cell lines representing precancerous lesions. Cytotoxicity was assessed using clonogenic assays and macroscopic colony counts were used to quantify cell survival. The results demonstrate that each phytochemical exhibits selective cytotoxicity toward nonfunctional p53 cell lines, suggesting a p53-mediated role in inhibition of cell clonogenicity and potential chemopreventative properties. Although each compound displays this described effect, only the
Introduction
Chemoprevention is an anticancer strategy that involves the use of compounds to inhibit the initiation of carcinogenesis and delay its promotion and progression. Mutations in the genome of cells are caused by the introduction of various carcinogens into the cellular environment (e.g. radiation) that are associated with increases in oxidative stress and chronic inflammatory responses that exacerbate the effect. 1,2 Therefore, the successful chemopreventative candidate must have potent antioxidative, immunomodulatory, and tumoricidal properties that counteract the carcinogen at the source as well as modify the development of accompanying systemic effects. As carcinogenic processes constitute a long latency period, the candidate must be administered on a frequent basis to confer maximal chemoprotection. Unlike chemotherapeutic compounds, the candidate must exert low cytotoxicity toward nonmalignant cells while exerting high specificity and maximal lethality toward transformed cells. Specifically, these compounds aim to target deregulation of the cell cycle and target only cells that delineate from proper cell function. 3,4 Cellular deregulation might include alteration in tumor suppressor function via p53 transcription pathway and RAS oncogene activation. These criteria warrant a cytotoxic examination of these compounds to ensure demonstrable high tissue tolerance and efficacy.
Despite synthetic analogues in the fields of oncology and chemotherapy, chemopreventative strategies usually rely on the use of dietary natural products in exerting their effects on cellular targets. 5,6 Plant secondary metabolites represent a class of natural compounds that have recognized antioxidative, anti-inflammatory, and growth inhibitory anticarcinogenic properties in vivo. 7 -9 Phytochemicals refer specifically to those plant-derived compounds that exhibit bioactive antioxidative capabilities. Subclasses of these phytochemicals include polyphenolic, terpene, and diterpene compounds. 10 Although there are thousands of such phytochemical compounds, not each is compatible with consumption given their toxicity profiles in vivo. Therefore, only a few have been given notable attention with regard to their observed tumoricidal effects. 11
Aims
Cytotoxic profiles of phytochemicals on isogenic cell lines might provide important information on the mechanism of these substances to determine the targets of growth inhibition. Specific compounds might interfere in certain pathways that are conducive to carcinogenic processes and therefore act to inhibit these processes. Additionally, these mechanisms might provide us with information on modifications that enhance the specific activity of the substances. This study investigates the interaction of the phytochemicals—curcumin, andrographolide, and
Materials and Methods
Subculture
HCT116 p53 wt, HT29, and HCT116 p53 null cell lines were cultured in T75 flasks (Falcon) containing RPMI 1640 medium (Gibco), Fetal Bovine Serum (Gibco), 1000 mM Penicillin–streptomycin solution (Gibco), and 2 mM L-glutamine (Gibco). Cells were maintained in an incubator at 37°C with 95% air and 5% CO2. Subculture was routinely performed when cells were 80% to 100% confluent using a solution of 0.25% Trypsin (Gibco), Dulbecco's Phosphate-Buffered Saline (Gibco), and 1 mM EDTA (Versene; Gibco) at 37°C.
Compounds
Curcumin, andrographolide, and
Clonogenic Assay
Clonogenic technique by Puck and Marcus was used for cell survival analysis. Briefly, compounds were generated as per the dose optimization section and administered into T25 flasks (Falcon). Cells were detached from stock T75 flasks (Falcon) and resuspended in medium to generate a single-cell suspension. Sample aliquot of the cell suspension was counted with the Z2 Cell Counter (Beckman Coulter) to generate values of viable cells. Following administration of compounds into flasks containing varying concentrations of each compound, cells were plated into each T25 flask (Falcon). Cell cultures were incubated for their respective clonogenic period, approximately 9 days for HCT116 p53 wt and HCT116 p53 null containing flasks and 11 days for HT29 flasks. Cells were stained following their clonogenic period of incubation with 25% carbol fuchsin in water where macroscopic colonies equal to and over 50 cells satisfy the criteria of reproductive cell survival. Total of 3 independent experiments were conducted with 3 replicates per experiment (n = 3).
Dose Function Analysis
Exposure of cells to growth inhibitory compounds comprises of 2 characteristic values in a dose–response curve, the nonminimal inhibitory concentration (NIC) and the minimal inhibitory concentration (MIC). The NIC value refers to the minimal dose at which the compound begins to inhibit cell growth, whereas the MIC refers to the minimal dose that exerts maximal growth inhibition.
In this study, cytotoxicity curves and corresponding NIC and MIC values were constructed using data from the clonogenic assay cell survival criteria. The inhibitory concentration for each compound was determined using the statistical software analysis package GraphPad Prism 7. The NIC and MIC software interpolated values were determined utilizing a Gompertz function dose–response curve based on the Lambert and Pearson method of determining antibiotic susceptibility in bacterial strains. The function assigns NIC and MIC values corresponding to intersections of the slope of the inflection point with the upper and lower asymptote, respectively. The 3-parameter Gompertz function is a type of sigmoidal logistic growth and decay function that describes cell survival by the equation f(x) = a × exp [−b × exp.(−c × x)]. Values of a < 0, b > 0, and c > 0 are representative of decreases in cell survival and therefore the characteristic cytotoxicity curve that describes the situations of inhibitory growth applicable to administration of antitumorigenic compounds to cancerous cells.
Statistical Analysis
The One-way analysis of variance (ANOVA) between groups with follow-up Tukey multiple comparisons test was conducted using the statistical software package GraphPad Prism 7 to examine the effects of phytochemical exposure on varying p53 function between each cell. The NIC and MIC values define a measured and computed value that characterizes each curve in terms of the biological effect end point. The input of each test therefore consists of the NIC and MIC values of each curve along with their associated standard deviation (SD) and degrees of freedom to assess differences between groups. The Tukey multiple comparisons test reports multiplicity adjusted P values that pool the SD of each group and therefore report conservative levels of significance. The 95% confidence interval and multiplicity adjusted P value <.05 were taken to be significant.
Results
Figures 1 to 3 represent the dose cytotoxicity profiles of each phytochemical between p53 variant human colon carcinoma cell lines and graphically describe the derivation of Gompertz NIC and MIC best-fit values. The tabulated results in Table 1 put into perspective the relative cytotoxicity of each compound and p53-mediated effects between cell lines. From Table 1, the curcumin had the lowest NIC and MIC values in each of the cell lines, followed by andrographolide and
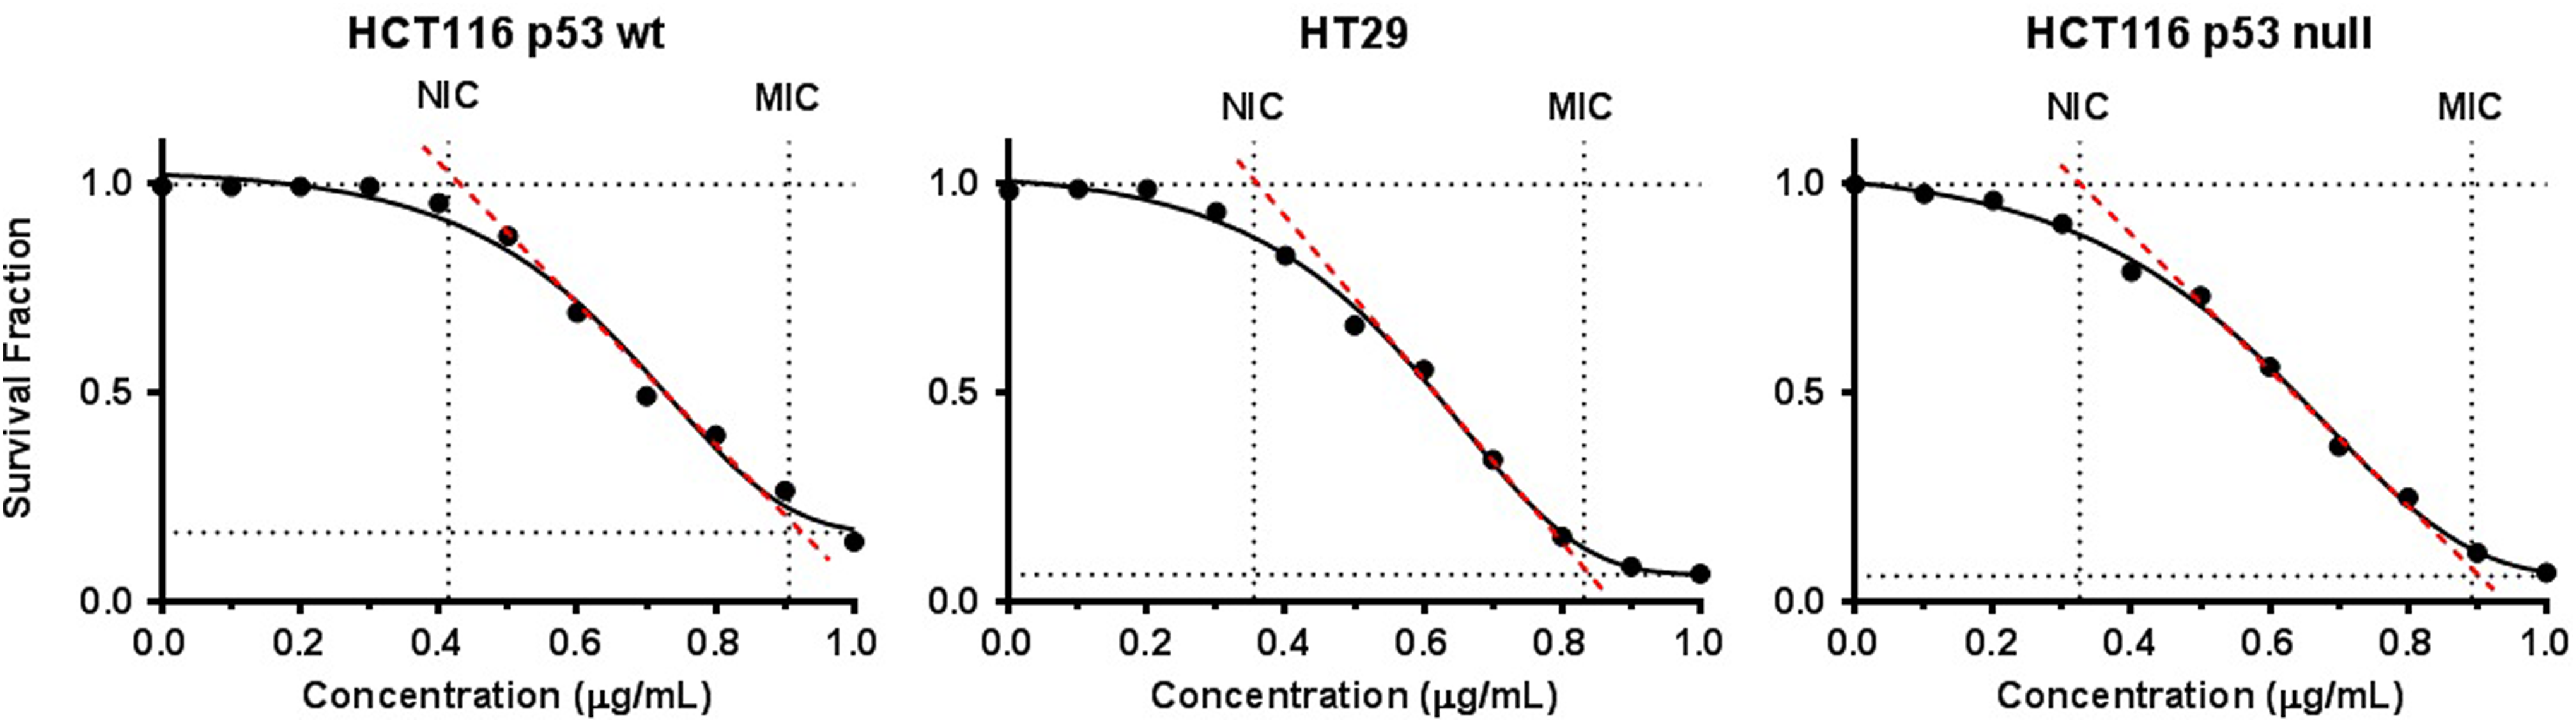
Curcumin cytotoxicity data on 3 p53 variant human colon carcinoma cell lines are representative of triplicate experiments. Values shown in each graph are expressed as the mean survival fraction of 3 independent experiments (n = 3). The solid line corresponds to the best-fit Gompertz function of the data. The dashed line represents the slope of the inflection point of the Gompertz function. Intersections of the inflection point with the upper and lower asymptote of the Gompertz function represent the NIC and MIC, respectively. Concentration data are expressed in micrograms per milliliter. MIC indicates minimal inhibitory concentration; NIC, nonminimal inhibitory concentration.

Andrographolide cytotoxicity data on 3 p53 variant human colon carcinoma cell lines are representative of triplicate experiments. Values shown in each graph are expressed as the mean survival fraction of 3 independent experiments (n = 3). The solid line corresponds to the best-fit Gompertz function of the data. The dashed line represents the slope of the inflection point of the Gompertz function. Intersections of the inflection point with the upper and lower asymptote of the Gompertz function represent the NIC and MIC, respectively. Concentration data are expressed in micrograms per milliliter. MIC indicates minimal inhibitory concentration; NIC, nonminimal inhibitory concentration.


Abbreviations: MIC, minimal inhibitory concentration; NIC, nonminimal inhibitory concentration; wt, wild type.
aValues are expressed in μg/mL.

Abbreviations: MIC, minimal inhibitory concentration; NIC, nonminimal inhibitory concentration; wt, wild type.
Evaluation of the statistical significance in Table 3 of the best-fit values in the curcumin treatments showed there was significance in the comparison between the NIC and MIC values of the HCT116 p53 wt versus HT29 and HCT116 p53 wt versus HCT116 p53 null cell lines and the MIC values of HT29 versus HCT116 p53 null cell lines. Cytotoxicity comparisons in the andrographolide treatments demonstrate the significance between the NIC values of HCT116 p53 wt versus HT29 and the MIC values of HCT116 p53 wt versus HCT116 p53 null and HT29 versus HCT116 p53 null cell lines. The

Abbreviations: MIC, minimal inhibitory concentration; NIC, nonminimal inhibitory concentration; ns, nonsignificant; wt, wild type.
a P value chart displays the results of p53-mediated phytochemical interactions and summarizes the 1-way analysis of variance (ANOVA) with subsequent Tukey multiple comparisons test. P values are multiplicity adjusted P values with 95% confidence interval.
bLevel of significance.
c P = .001 to .01.
d P = .0001 to .001.
e P < .0001.
f P = .01 to .05.
Discussion
The results demonstrate that there is likely a p53-mediated role in the induction of growth inhibition and cytotoxicity in response to curcumin, andrographolide, and
In terms of oral dosing implications, the NIC value is the relevant value as the MIC value of nonfunctional p53 cell lines HT29 and HCT116 p53 null coincides to a significant extent with that of the HCT116 p53 wt cell lines and is therefore likely to cause toxic effects in otherwise nonmalignant cells. The successful chemopreventive candidate therefore has to have practical dose discrepancies between the NIC values of wt and mutant p53 cell lines to demonstrate in vivo effects. In this respect, the
Conclusion
The use of phytochemicals in chemoprevention might have an important role in targeting various precancerous cell lines through enhancing cell regulatory mechanisms. Their appeal involves their noninvasive and practical route of administration via oral consumption. The compounds require frequent intake to confer maximal protective effects; in this regard, cytotoxic profiling of chronic long-term exposures to these compounds and their metabolites is important as it serves to provide guidance in this field. In this study, chronic exposures to curcumin, andrographolide, and
Footnotes
Declaration of Conflicting Interests
The author(s) declared no potential conflicts of interest with respect to the research, authorship, and/or publication of this article.
Funding
The author(s) disclosed receipt of the following financial support for the research, authorship, and/or publication of this article: The Canada Research Chairs Program (Recipient: CEM, Grant Number: 950-221284), National CFIDS Foundation Inc (Recipient: CEM), NSERC Collaborative Research and Development Grant (Recipient: CEM, Grant Number: RGPIN293153-12), CANDU Owners Group (Recipient: CBS, Grant Number: CRDPJ484381-15), and Bruce Power (Recipient: CEM).