
Abstract
Background
The purpose of the present study was to evaluate the usefulness of the median nerve stenosis rate (MNSR) measured on sagittal sonographic images of the median nerve in the diagnosis of carpal tunnel syndrome (CTS).
Methods
The study population consisted of 45 hands from 37 patients with idiopathic CTS (CTS group), and 60 hands from 35 asymptomatic healthy subjects (control group). Carpal tunnel syndrome was diagnosed by clinical findings and positive electrophysiological study results. All patients and control subjects underwent ultrasonographic examination. At the carpal tunnel level, the transducer was placed longitudinally to the median nerve, and an image of the longitudinal median nerve was obtained. The minimum median nerve diameter (MND) was measured at the middle part of the capitate level, while the maximum MND was measured at the distal radioulnar joint level. The MNSR was calculated as (1 – minimum MND/maximum MND) × 100 (%). The cross-sectional area of the median nerve was also measured at the level of the pisiform.
Results
On longitudinal sonographic images, the MNSR was significantly larger in the CTS group than the control group. When the cut-off value of the MNSR was 26.73%, the sensitivity and specificity were 91.1% and 80%, respectively. The area under the receiver operating characteristic curve was larger for the MNSR than for the cross-sectional area.
Conclusion
The results suggest that the MNSR proposed in the present study may be useful as an auxiliary method for CTS diagnosis on ultrasonographic examination.
Keywords
Introduction
Carpal tunnel syndrome (CTS) is the most common entrapment neuropathy in the upper extremities.1-3 CTS is diagnosed clinically in accordance with the presence of symptoms (such as numbness in the median nerve distribution, hand or wrist pain, and difficulty grasping and using small objects) and physical examination findings, including provocative testing (Phalen’s test and Tinel’s sign).1-4 Although electrophysiological study is useful for the diagnosis of CTS, false negative errors reportedly occur in 13% of the patients. 2 The compressed median nerve inside the carpal tunnel can be directly visualized using magnetic resonance imaging (MRI), but MRI has the disadvantages of lengthy examination duration and high cost.5-8
Recently, the effectiveness of ultrasonographic examination in the diagnosis of CTS has been reported.9-11 Ultrasonographic examination enables the visualization of the morphological changes of the median nerve inside the carpal tunnel, and requires less cost and time than MRI. In patients with CTS, the reported ultrasonographic examination findings include swelling of the median nerve in the proximal part of the carpal tunnel, flattening of the median nerve in the distal part of the carpal tunnel, and palmar bowing of the transverse carpal ligament.9-11 Many studies on patients with CTS have performed ultrasonographic examination of the median nerve in the axial plane, while there have been few reports on the examination of the median nerve in the sagittal plane.9-12
A previous MRI study reported that the most notable characteristics of CTS were median nerve compression at the distal carpal tunnel and prestenotic swelling in the proximal portion of the carpal tunnel on the longitudinal image. 8 We hypothesized that the changes in the median nerve seen on sagittal images could be observed on ultrasonography as well as MRI, and would be useful for the diagnosis of CTS. The present study aimed to evaluate the usefulness of the median nerve stenosis rate (MNSR) measured on sagittal sonographic images in the diagnosis of CTS. The diagnostic value of the MNSR was compared with that of the cross-sectional area (CSA) measured on axial sonographic images.
Materials and Methods
The present study was approved by our institutional ethics committee, and informed consent was obtained from all study participants. Between January 2012 and May 2015, a total of 45 hands from 37 patients with idiopathic CTS (CTS group; 31 women, 6 men; mean age 72.04 years, range 47-88 years) and 60 hands from 35 asymptomatic healthy subjects (control group; 29 women, 6 men; mean age 71.83 years, range 48-89 years) were evaluated by ultrasonographic examination at a single center. Carpal tunnel syndrome was diagnosed in accordance with clinical findings (paresthesia in the median nerve distribution, a positive Phalen’s test, and a positive Tinel’s sign) and a positive electrophysiological study. The control group did not undergo electrophysiological examination.
We used an ultrasonographic instrument equipped with a linear array transducer (LOGIQ P6, GE Healthcare, Chicago, Illinois). The patients in the CTS group underwent ultrasonographic examination preoperatively. The control group also underwent the same ultrasonographic examination. Briefly, at the carpal tunnel level, the transducer was placed longitudinally to the median nerve, and a longitudinal image of the median nerve was obtained. Both groups were imaged while sitting with the forearm supinated and the wrist in the neutral position. The maximum median nerve diameter (MND) was measured in the proximal portion of the carpal tunnel at the distal radioulnar joint level, while the minimum MND was measured at the distal end of the carpal tunnel in the middle of the capitate. The MNSR was calculated as (1 – minimum MND/maximum MND) × 100 (%).
An axial image of the median nerve was obtained in the proximal portion of the carpal tunnel by placing the transducer perpendicular to the median nerve. The CSA of the median nerve was measured using Image J (National Institutes of Health, Bethesda, Maryland) at the level of the pisiform.
Two independent observers (H. F. and T. O.) performed the ultrasonographic examination 3 times in each study participant, and the average values were obtained. The 2 observers performed the ultrasonographic examination on different days to investigate the inter-rater reliability.
Statistical Analysis
The Student’s t-test was used to compare the maximum MND, minimum MND, MNSR, and CSA of the median nerve between the CTS group and the control group. Receiver operating characteristic (ROC) curves were calculated to investigate the optimal cut-off values of the maximum MND, minimum MND, MNSR, and CSA of the median nerve. The reliabilities of ultrasonographic variables were tested using intraclass correlation coefficients. The Student’s t-test and ROC curves were performed using EZR software version 1.27 (Saitama Medical Center, Jichi Medical University, Saitama, Japan). The intraclass correlation coefficients were calculated using SPSS (IBM, Chicago, Illinois). Values of P < .05 were considered statistically significant.
Results
Table 1 summarizes the ultrasonographic measurements of the median nerve in the CTS and control groups. Compared with the control group, the CTS group had a significantly greater CSA of the median nerve at the level of the pisiform (P < .001), significantly greater maximum MND (P < .001), significantly smaller minimum MND (P < .001), and significantly greater MNSR (P < .001).
Ultrasonographic Measurements of the Median Nerve in 45 Hands Diagnosed With CTS, and in 60 Hands From Healthy Control Subjects.
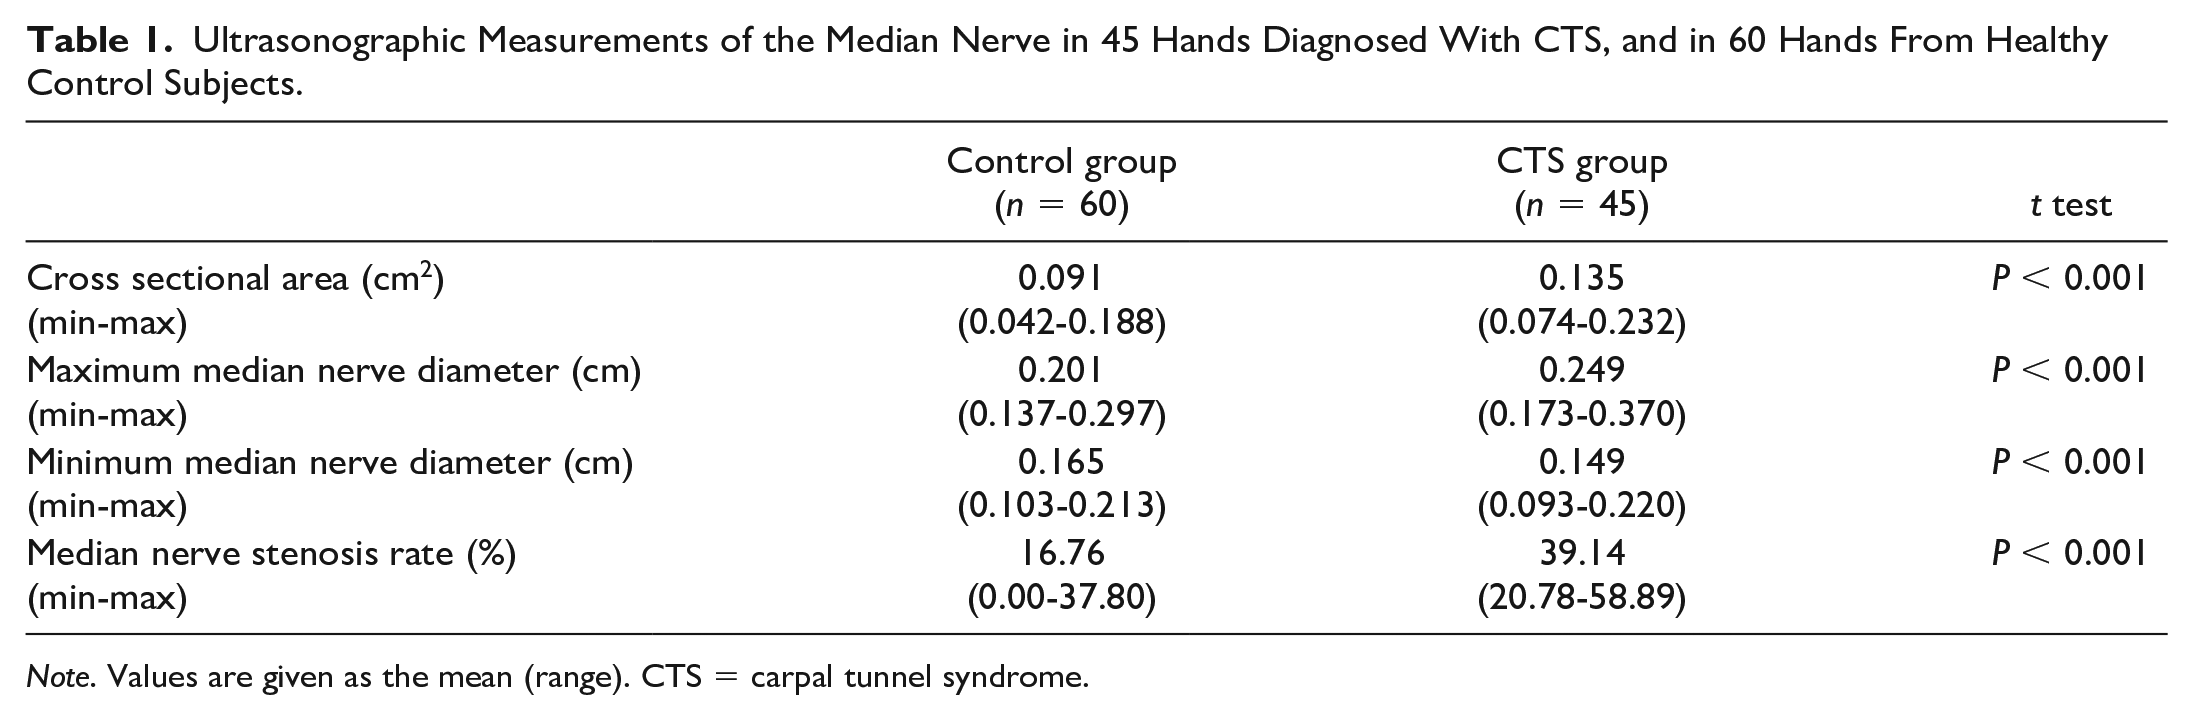
Note. Values are given as the mean (range). CTS = carpal tunnel syndrome.
Representative ultrasound images from each group are presented in Figures 1 and 2. Figure 1 shows the axial ultrasound images from a patient in the CTS group (Figure 1a), and a healthy subject in the control group (Figure 1b). The average CSA was 0.135 cm2 in the CTS group and 0.091 cm2 in the control group. Figure 2 shows the longitudinal ultrasound images from a patient in the CTS group (Figure 2a), and a healthy subject in the control group (Figure 2b). In the control group, the average maximum MND was 0.201 cm, the average minimum MND was 0.165 cm, and the average MNSR was 16.76% (Figure 2b). In the CTS group, the average maximum MND was 0.249 cm, the average minimum MND was 0.149 cm, and the average MNSR was 39.14% (Figure 2a).
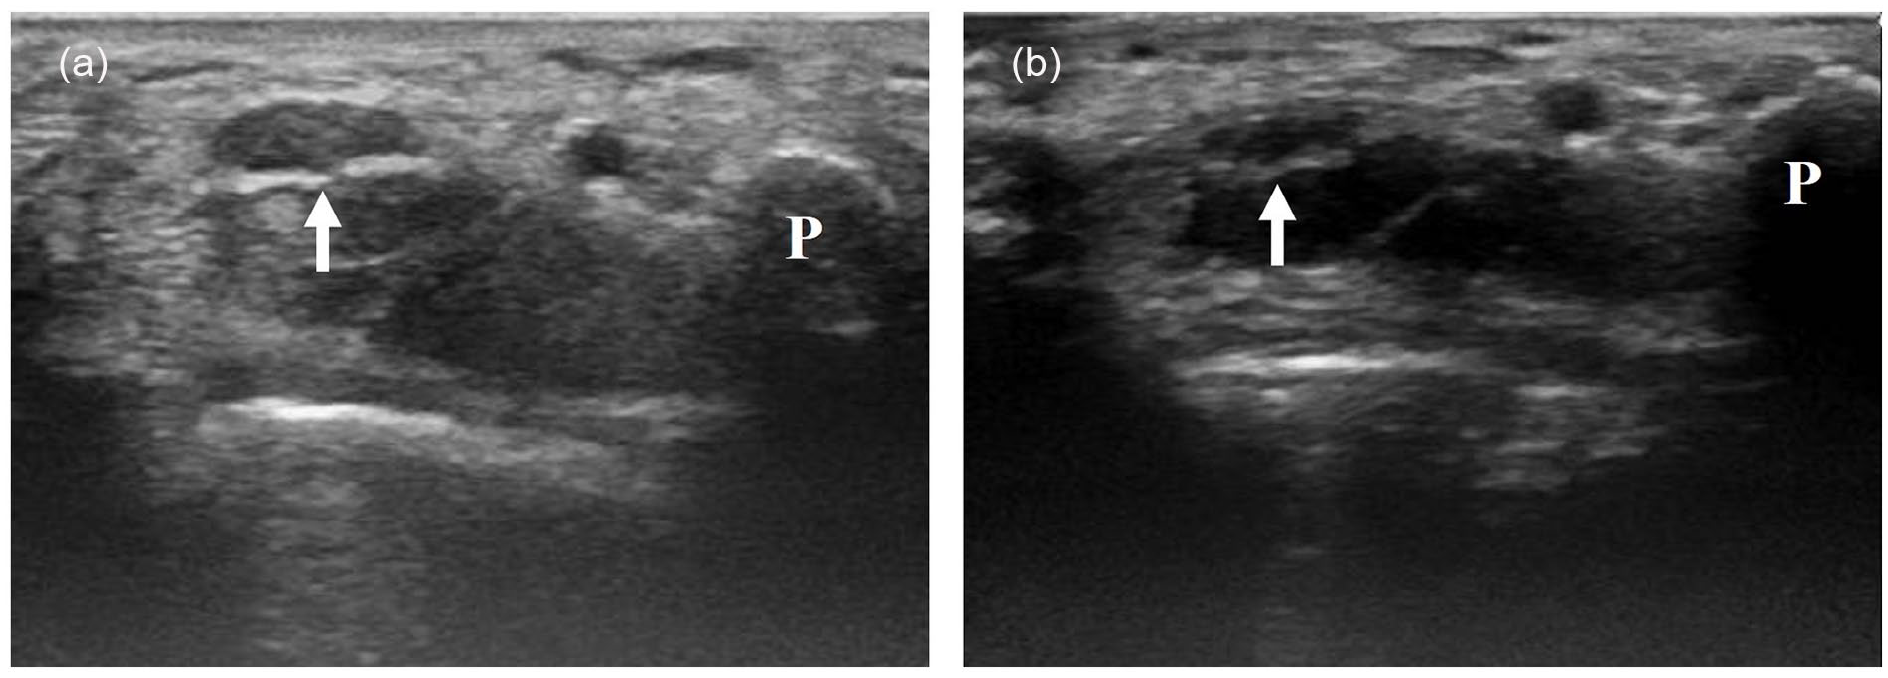
Axial ultrasound images of the median nerves of a woman with CTS (a) and a healthy asymptomatic woman (b).
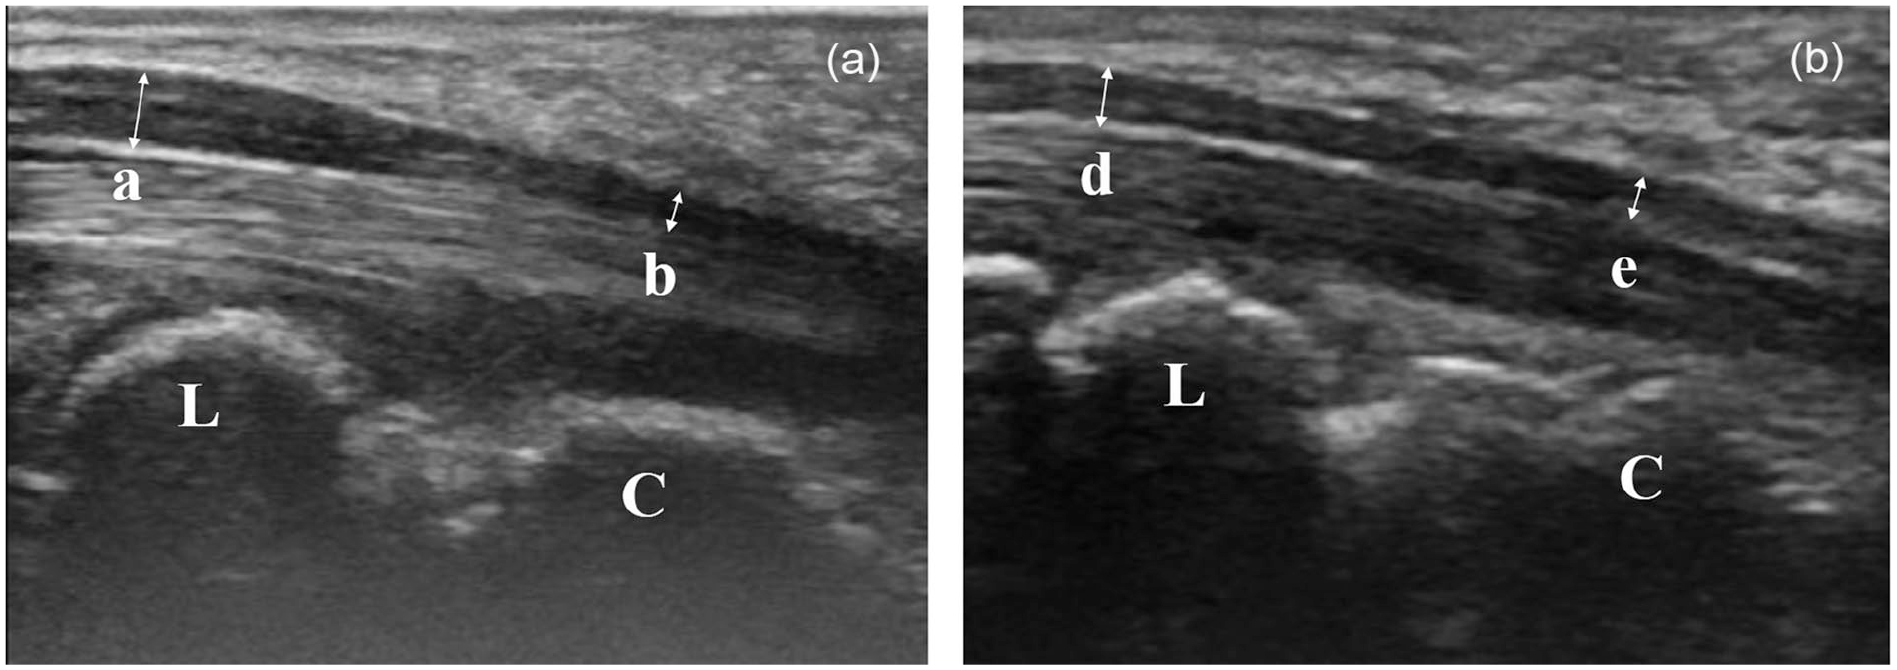
Longitudinal ultrasound images of the median nerves of a woman with CTS (a) and a healthy asymptomatic woman (b).
ROC curves were calculated to investigate the optimal cut-off values for useful ultrasonographic measurements (Table 2). The optimal cut-off value for CSA at the level of the pisiform was 0.111 cm2, with a sensitivity of 77.8%, specificity of 86.7%, and area under the ROC curve (AUC) of 0.841. The optimal cut-off value for the maximum MND on a longitudinal image was 0.23 cm, with a sensitivity of 66.7%, specificity of 88.3%, and AUC of 0.819. The optimal cut-off value for the minimum MND on a longitudinal image was 0.153 cm, with a sensitivity of 66.7%, specificity of 70.0%, and AUC of 0.702. The optimal cut-off value for the MNSR was 26.73%, with the highest AUC of 0.93, and a sensitivity and specificity of 91.1% and 80.0%, respectively.
Optimal Cut-Off Value, Sensitivity, and Specificity of the Ultrasonographic Measurements in Distinguishing Patients From Controls.
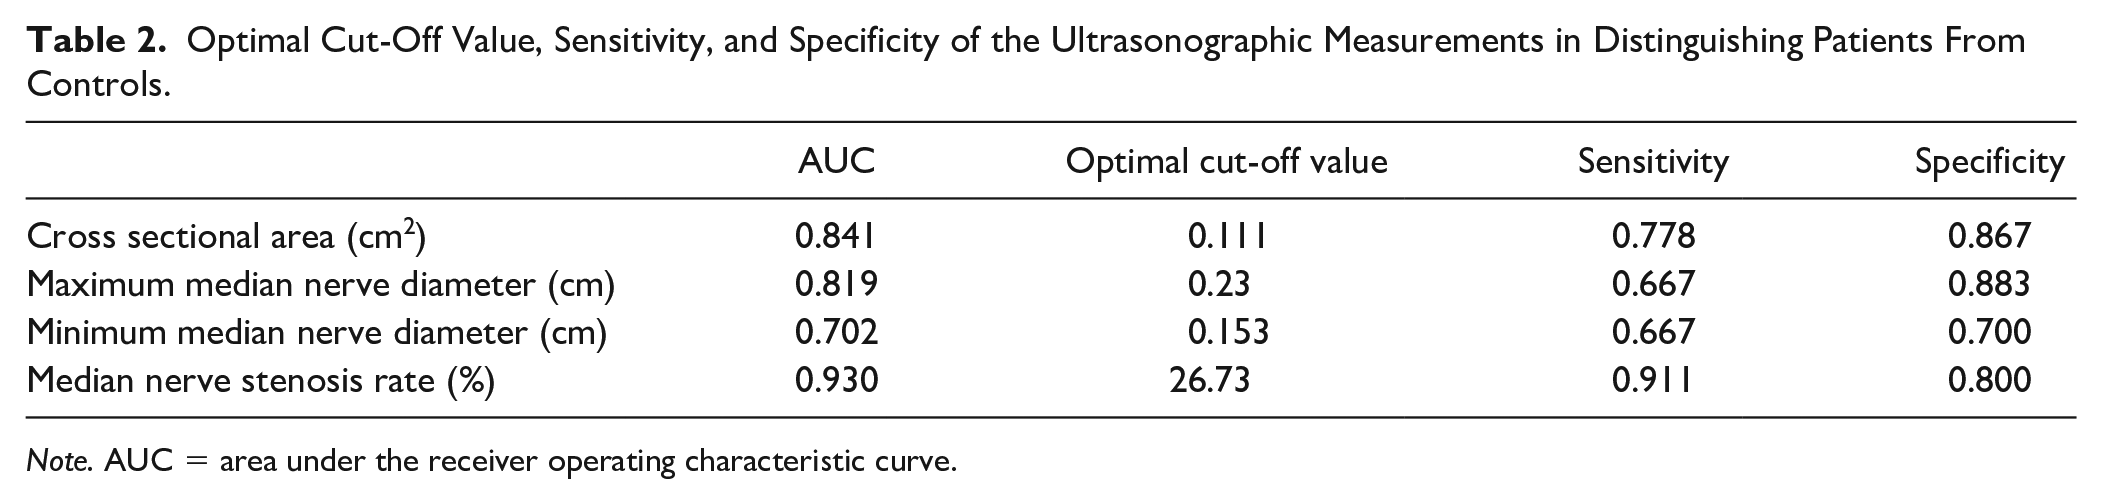
Note. AUC = area under the receiver operating characteristic curve.
The prevalence of CTS in the general population is reportedly 2.7% to 3.72%.13,14 Assuming that the prevalence of CTS is 3%, the MNSR of 26.73% had a positive predictive value of 12.35% and a negative predictive value of 99.66% when calculated using Bayesian statistics.
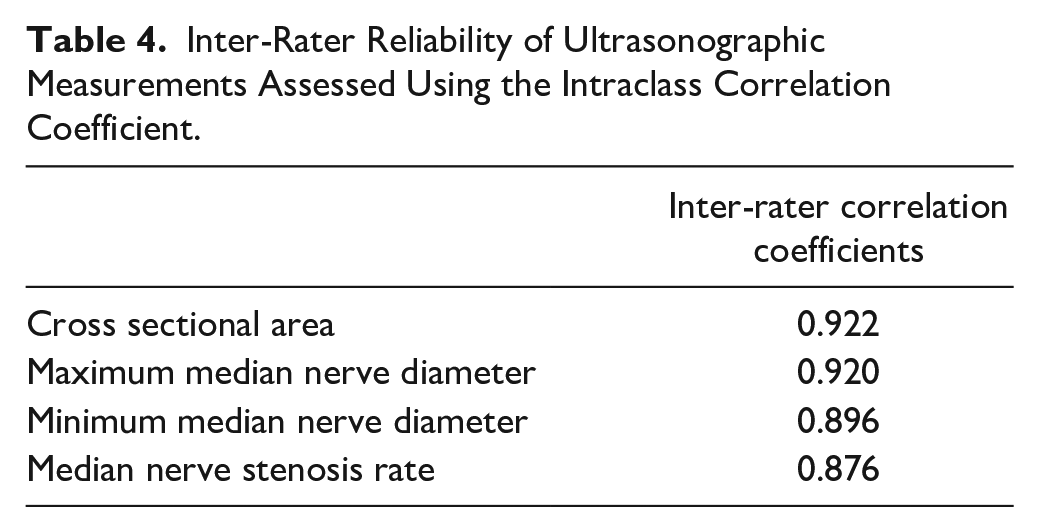
Intra- and inter-rater reliabilities are shown in Tables 3 and 4. The intra-rater correlation coefficients for the CSA were 0.953 and 0.949, respectively, for the 2 observers. The intra-rater correlation coefficients for the MNSR were 0.863 and 0.838, respectively, both of which were lower than the coefficients for the CSA. The inter-rater correlation coefficients for the CSA and the MNSR were 0.922 and 0.876, respectively. The coefficient value was higher for the CSA than for the MNSR in both the intra- and inter-rater correlation analyses.
Intra-Rater Reliability of Ultrasonographic Measurements Assessed Using the Intraclass Correlation Coefficient.
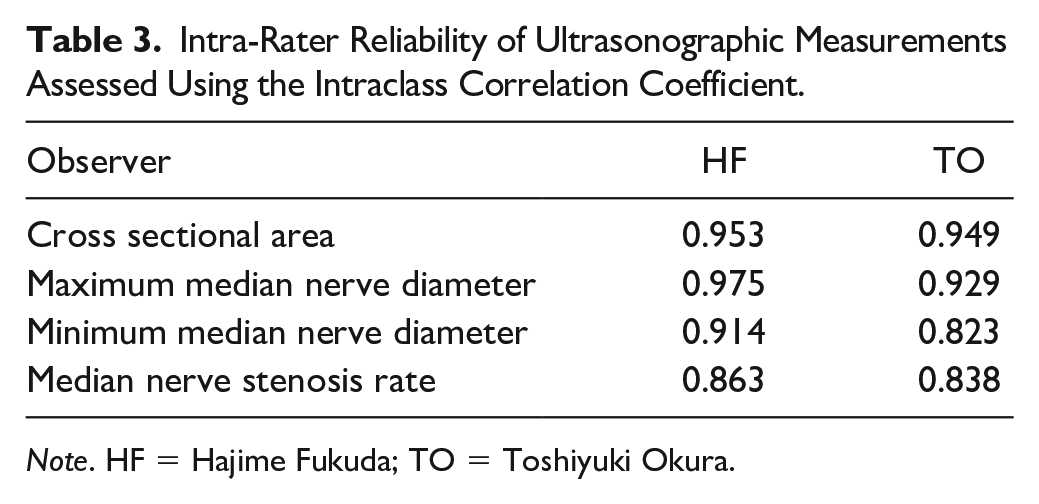
Note. HF = Hajime Fukuda; TO = Toshiyuki Okura.
Inter-Rater Reliability of Ultrasonographic Measurements Assessed Using the Intraclass Correlation Coefficient.
Discussion
We evaluated the usefulness of longitudinal and axial sonographic images of the median nerve in the diagnosis of CTS. On the longitudinal sonographic images, the CTS group had a significantly greater MNSR and maximum MND in the proximal portion of the carpal tunnel, and a significantly smaller minimum MND at the distal portion of the carpal tunnel than the control group. When the cut-off value of the MNSR was 26.73%, the sensitivity and specificity were 91.1% and 80%, respectively, and the AUC was higher than that of the CSA at the proximal portion of the carpal tunnel. Thus, the MNSR seems to be useful as an auxiliary method in the diagnosis of CTS. To the best of our knowledge, this is the first report to show the usefulness of the MNSR measured on longitudinal sonographic images of the median nerve in the diagnosis of CTS.
In the patients with CTS, we observed median nerve compression at the distal portion of the carpal tunnel and swelling of the median nerve at the proximal portion of the carpal tunnel on the longitudinal sonographic images. Our data showed that the mean maximum MND at the distal radioulnar joint level was 0.249 cm, and the average minimum MND at the middle of the capitate level was 0.149 cm. A previous MRI study reported that the most notable characteristics of CTS were median nerve compression at the distal carpal tunnel and prestenotic swelling in the proximal portion of the carpal tunnel on the longitudinal image, and that these changes were observed in 90% of patients with CTS. 8 Ultrasonographic studies have also reported changes in the median nerve on longitudinal images.12,15,16 Köroğlu et al 12 reported that the MND in the proximal carpal tunnel and the MND in the distal carpal tunnel measured on longitudinal sonographic images were useful for the diagnosis of CTS. They reported that a cut-off value of 2.235 mm for the MND at the distal radius level resulted in a sensitivity of 58.1% and specificity of 83.8%, while a cut-off value of 1.755 mm for the MND at the capitate level resulted in a sensitivity of 52.5% and specificity of 78.8%. 12 These previous findings are similar to our findings that a cut-off value of 0.23 cm for the MND at the distal radioulnar joint level resulted in a sensitivity of 66.7% and specificity of 88.3%, while a cut-off value of 0.153 cm for the MND at the middle of the capitate level resulted in a sensitivity of 66.7% and specificity of 70.0%. In the present study, we calculated the MNSR to quantify the morphological change of the median nerve in the carpal tunnel. Our results showed that the MNSR was useful in the diagnosis of CTS.
To examine the reliability of longitudinal sonographic examination of the median nerve in the diagnosis of CTS, we measured the intra- and inter-rater reliability. Both the intra- and inter-rater reliabilities were lower for the MNSR than for the CSA in the proximal portion of the carpal tunnel. Wiesler et al 17 reported that measurements of the median nerve on longitudinal images were somewhat inconsistent in the diagnosis of CTS. In the present study, the intra- and inter-rater reliabilities for the maximum MND were almost the same as the intra- and inter-rater reliabilities for the CSA. We believe that it is difficult to visualize the median nerve on a longitudinal sonographic image, especially in the distal portion of the carpal tunnel. Therefore, it is difficult to accurately visualize the median nerve on a longitudinal sonographic image compared with an axial sonographic image. However, the intra- and inter-rater reliabilities for the ultrasonographic measurements on a longitudinal image of the median nerve were greater than 0.8, suggesting that the reliability of the examination was almost perfect. 18 Although the MNSR measured using the longitudinal image of the median nerve was inferior to the CSA measured on the axial image of the median nerve in regards to intra- and inter-rater reliabilities, the AUC of the MNSR was higher than that of the CSA. Thus, the MNSR seems to be useful in the diagnosis of CTS.
The limitations of the present study were the small sample and the small number of examiners. Evaluations at other institutions, and investigations with more patients are necessary in the future.
Conclusion
We evaluated the usefulness of the MNSR measured on sagittal sonographic images of the median nerve in the diagnosis of CTS. Although the MNSR showed lower intra- and inter-rater reliabilities than the CSA, the MNSR showed higher AUC values than the CSA. When CTS was diagnosed using a MNSR of 26.73% as the cut-off value, the sensitivity was 91.1% and the specificity was 80%; thus, the MNSR may be useful as an auxiliary method for CTS diagnosis.
Footnotes
Acknowledgements
Ethical Approval
The present study was approved by the institutional ethics committee.
Statement of Human and Animal right
This article does not contain any study with human or animal subjects.
Statement of Informed Consent
Informed consent was obtained from all individual participants included in the study.
Declaration of Conflicting Interests
The author(s) declared no potential conflicts of interest with respect to the research, authorship, and/or publication of this article.
Funding
The author(s) received no financial support for the research, authorship, and/or publication of this article.