
Abstract
This study examined changes in body measurements among Korean adolescents aged 16–19 before and after the COVID-19 pandemic, using Size Korea data from 2015 and 2023. A total of 245 participants from each year (2015: n = 245; 2023: n = 245) were matched by age and sex to ensure comparability. Thirty-five anthropometric variables were analyzed using independent samples t-tests and two-way ANOVA to assess differences by year and sex. The results revealed significant structural changes characterized by an upper-body–centered shift in morphology, with notable increases in chest breadth and depth, waist and abdominal circumferences, and upper-arm girth. While height increased overall, arm and thigh lengths showed significant decreases, indicating restricted limb growth alongside torso-dominant development. Chi-square analyses further revealed significant post-pandemic shifts in BMI distributions, with a decrease in the proportion of normal-weight adolescents and an increase in overweight and obesity, particularly among males. Sex-specific differences were also evident: male adolescents experienced greater increases in torso breadths, depths, and body weight, whereas females showed marked gains in chest, waist, and hip circumferences with relatively stable BMI. These findings suggest that lifestyle disruptions during the pandemic, such as reduced physical activity and increased sedentary behavior, contributed not only to weight gain but also to altered body proportions that were not fully captured by BMI alone.
Introduction
The coronavirus disease (COVID-19), which first emerged in late 2019, rapidly spread across the globe and was officially declared a pandemic by the World Health Organization (WHO) in early 2020. In response, widespread public health measures were implemented to curb the transmission of the virus, leading to a dramatic shift in the global paradigm of daily life. Among the most affected were children and adolescents, who faced strict interventions such as school closures, remote learning, and restrictions on outdoor activities. These changes significantly impacted health-related behaviors, including dietary habits, physical activity, and sleep patterns. 1 As a result, concerns have been raised that such disruptions may have altered the developmental trajectory of adolescents during a critical growth period.2,3
Previous studies have reported that during the pandemic, physical activity levels among children and adolescents decreased by more than 50% on average, while screen time increased by over 2 h/day.4,5 Extended periods of online schooling and the reduction of physical education classes contributed to a more sedentary lifestyle, further reinforcing static habits. This shift led to decreased energy expenditure, irregular sleep patterns, altered meal timing, and changes in eating behaviors—all of which negatively affected overall health.6,7 These rapid lifestyle changes likely had a structural impact on the body measurement and physical constitution of adolescents. While several studies have examined how reduced outdoor activity due to remote working affected adult health and body during the pandemic, few have quantitatively investigated how these changes may have influenced adolescent body measurement across multiple body dimensions before and after the pandemic.8,9
Late adolescence (ages 16–19) represents a phase during which skeletal development and body measurement are nearly complete. Changes during this period not only affect short-term appearance but also have long-term implications for adult health and physical stability.10,11 Therefore, identifying changes that occur during this time is critical, as they may influence future obesity rates, physical function decline, and risks of musculoskeletal disorders. However, most existing studies have focused on limited indicators such as height, weight, and body mass index (BMI) to examine pandemic-related changes, which restricts understanding of the structural characteristics and context of body measurement changes.12 –14 Such limitations hinder applications that require precise body-shape information, including size customization in apparel production, where accurate anthropometric inputs are essential for garment fit and user comfort.15,16
BMI, calculated as weight (kg) divided by height squared (m²), is useful for comparing groups and estimating obesity. Yet, it is insufficient for capturing individual variations in fat distribution, body proportions, and muscle mass.17,18 For instance, two individuals with the same BMI may differ significantly—one may have visceral fat concentrated in the abdomen, while the other may have well-developed lower body muscles. Especially considering that the pandemic may have led to decreased muscle mass and increased abdominal fat due to reduced physical activity and dietary changes, detailed body measurements are necessary to assess structural changes in body measurement beyond BMI alone.
Adolescent body measurement is strongly influenced not only by genetic but also environmental factors. Habits such as physical activity, diet, sleep rhythm, and emotional state are crucial for physical development and were significantly altered during the COVID-19 pandemic. 19 Although the pandemic was a relatively short-term event, the associated lifestyle changes persisted and may have caused asymmetrical development in specific body regions such as the abdomen and upper torso. Moreover, individual variation in growth rate and direction is particularly pronounced during adolescence, making it essential to conduct multidimensional analyses of detailed anthropometric data.
Although the pandemic was officially declared over in 2023, its effects likely extended beyond temporary lifestyle changes and may have caused mid- to long-term structural changes in adolescent body measurement. Prior studies conducted during or immediately after the pandemic (2020–2021) primarily focused on short-term changes such as weight gain, increased BMI, and reduced physical activity. However, few comprehensive analyses have examined whether these changes persisted or evolved by sex and age group in the years following the pandemic. As the post-pandemic adolescent generation is likely to differ from previous cohorts in terms of body measurement characteristics and health needs, collecting high-resolution body measurement data is critical for the development of tailored policies and services. 20
While prior studies have largely examined pandemic-related changes in adolescents using BMI, weight, or waist circumference alone, few have adopted a multidimensional anthropometric perspective. To address this gap, the present study analyzes 35 detailed body measurements to provide a comprehensive account of structural changes before and after the COVID-19 pandemic. This approach extends existing health-focused research while also offering critical insights for fields such as apparel engineering, ergonomic design, and wearable technology.
Against this backdrop, the study specifically aims to investigate late adolescents (aged 16–19) with respect to upper-to-lower body balance, changes in key lengths and circumferences, and overall morphological shifts. The goal is to determine whether pandemic-related lifestyle disruptions translated into long-term structural changes in adolescent body configuration.
To achieve this, we conducted a comparative analysis of nationally representative body measurement survey data collected in 2015 (pre-pandemic) and 2023 (post-pandemic). In addition to height and weight, over 30 anthropometric items were examined, and subgroup analyses by sex and BMI were performed to capture group-specific characteristics. This comprehensive dataset provides a robust empirical foundation for advancing adolescent health management, apparel sizing systems, and the development of wearable and ergonomic products adapted to the evolving physiques of the post-pandemic generation.
Research methods
Participants and data source
This study employed a non-experimental, cross-sectional comparative research design, analyzing adolescent anthropometric data collected in 2015 and 2023. The objective was to observe population characteristics at two distinct time points and examine inter-variable differences. To empirically investigate body measurement changes in Korean adolescents before and after the COVID-19 pandemic, this study utilized nationally representative anthropometric datasets from the seventh (2015) and eighth (2023) waves of the “Size Korea” survey, provided by the National Statistical Portal.21,22
This was a secondary data analysis using publicly available Size Korea data, which contains no personally identifiable information. Seoul National University Institutional Review Board (IRB No. E2507/003-004) approval was therefore exempted. Size Korea is a nationwide anthropometric survey conducted every 5 years under the supervision of the Ministry of Trade, Industry and Energy of the Republic of Korea. It combines 3D body scanning and manual measurement to ensure high reliability and validity. The measurements follow ISO 20685 standards, and the dataset has been validated and widely used in prior studies related to body measurement analysis and wearable product development.23 –27 Adolescents aged 16–19 years were included, with 1690 participants in 2015 (852 males, 838 females) and 245 participants in 2023 (125 males, 120 females; Table 1).
Sample distribution by year, sex, and age group.

These samples were filtered from the original Size Korea datasets to include only those with no missing values for anthropometric items and with complete information on age and sex. Age was defined as chronological age at the time of measurement, and sex was categorized dichotomously (male/female).
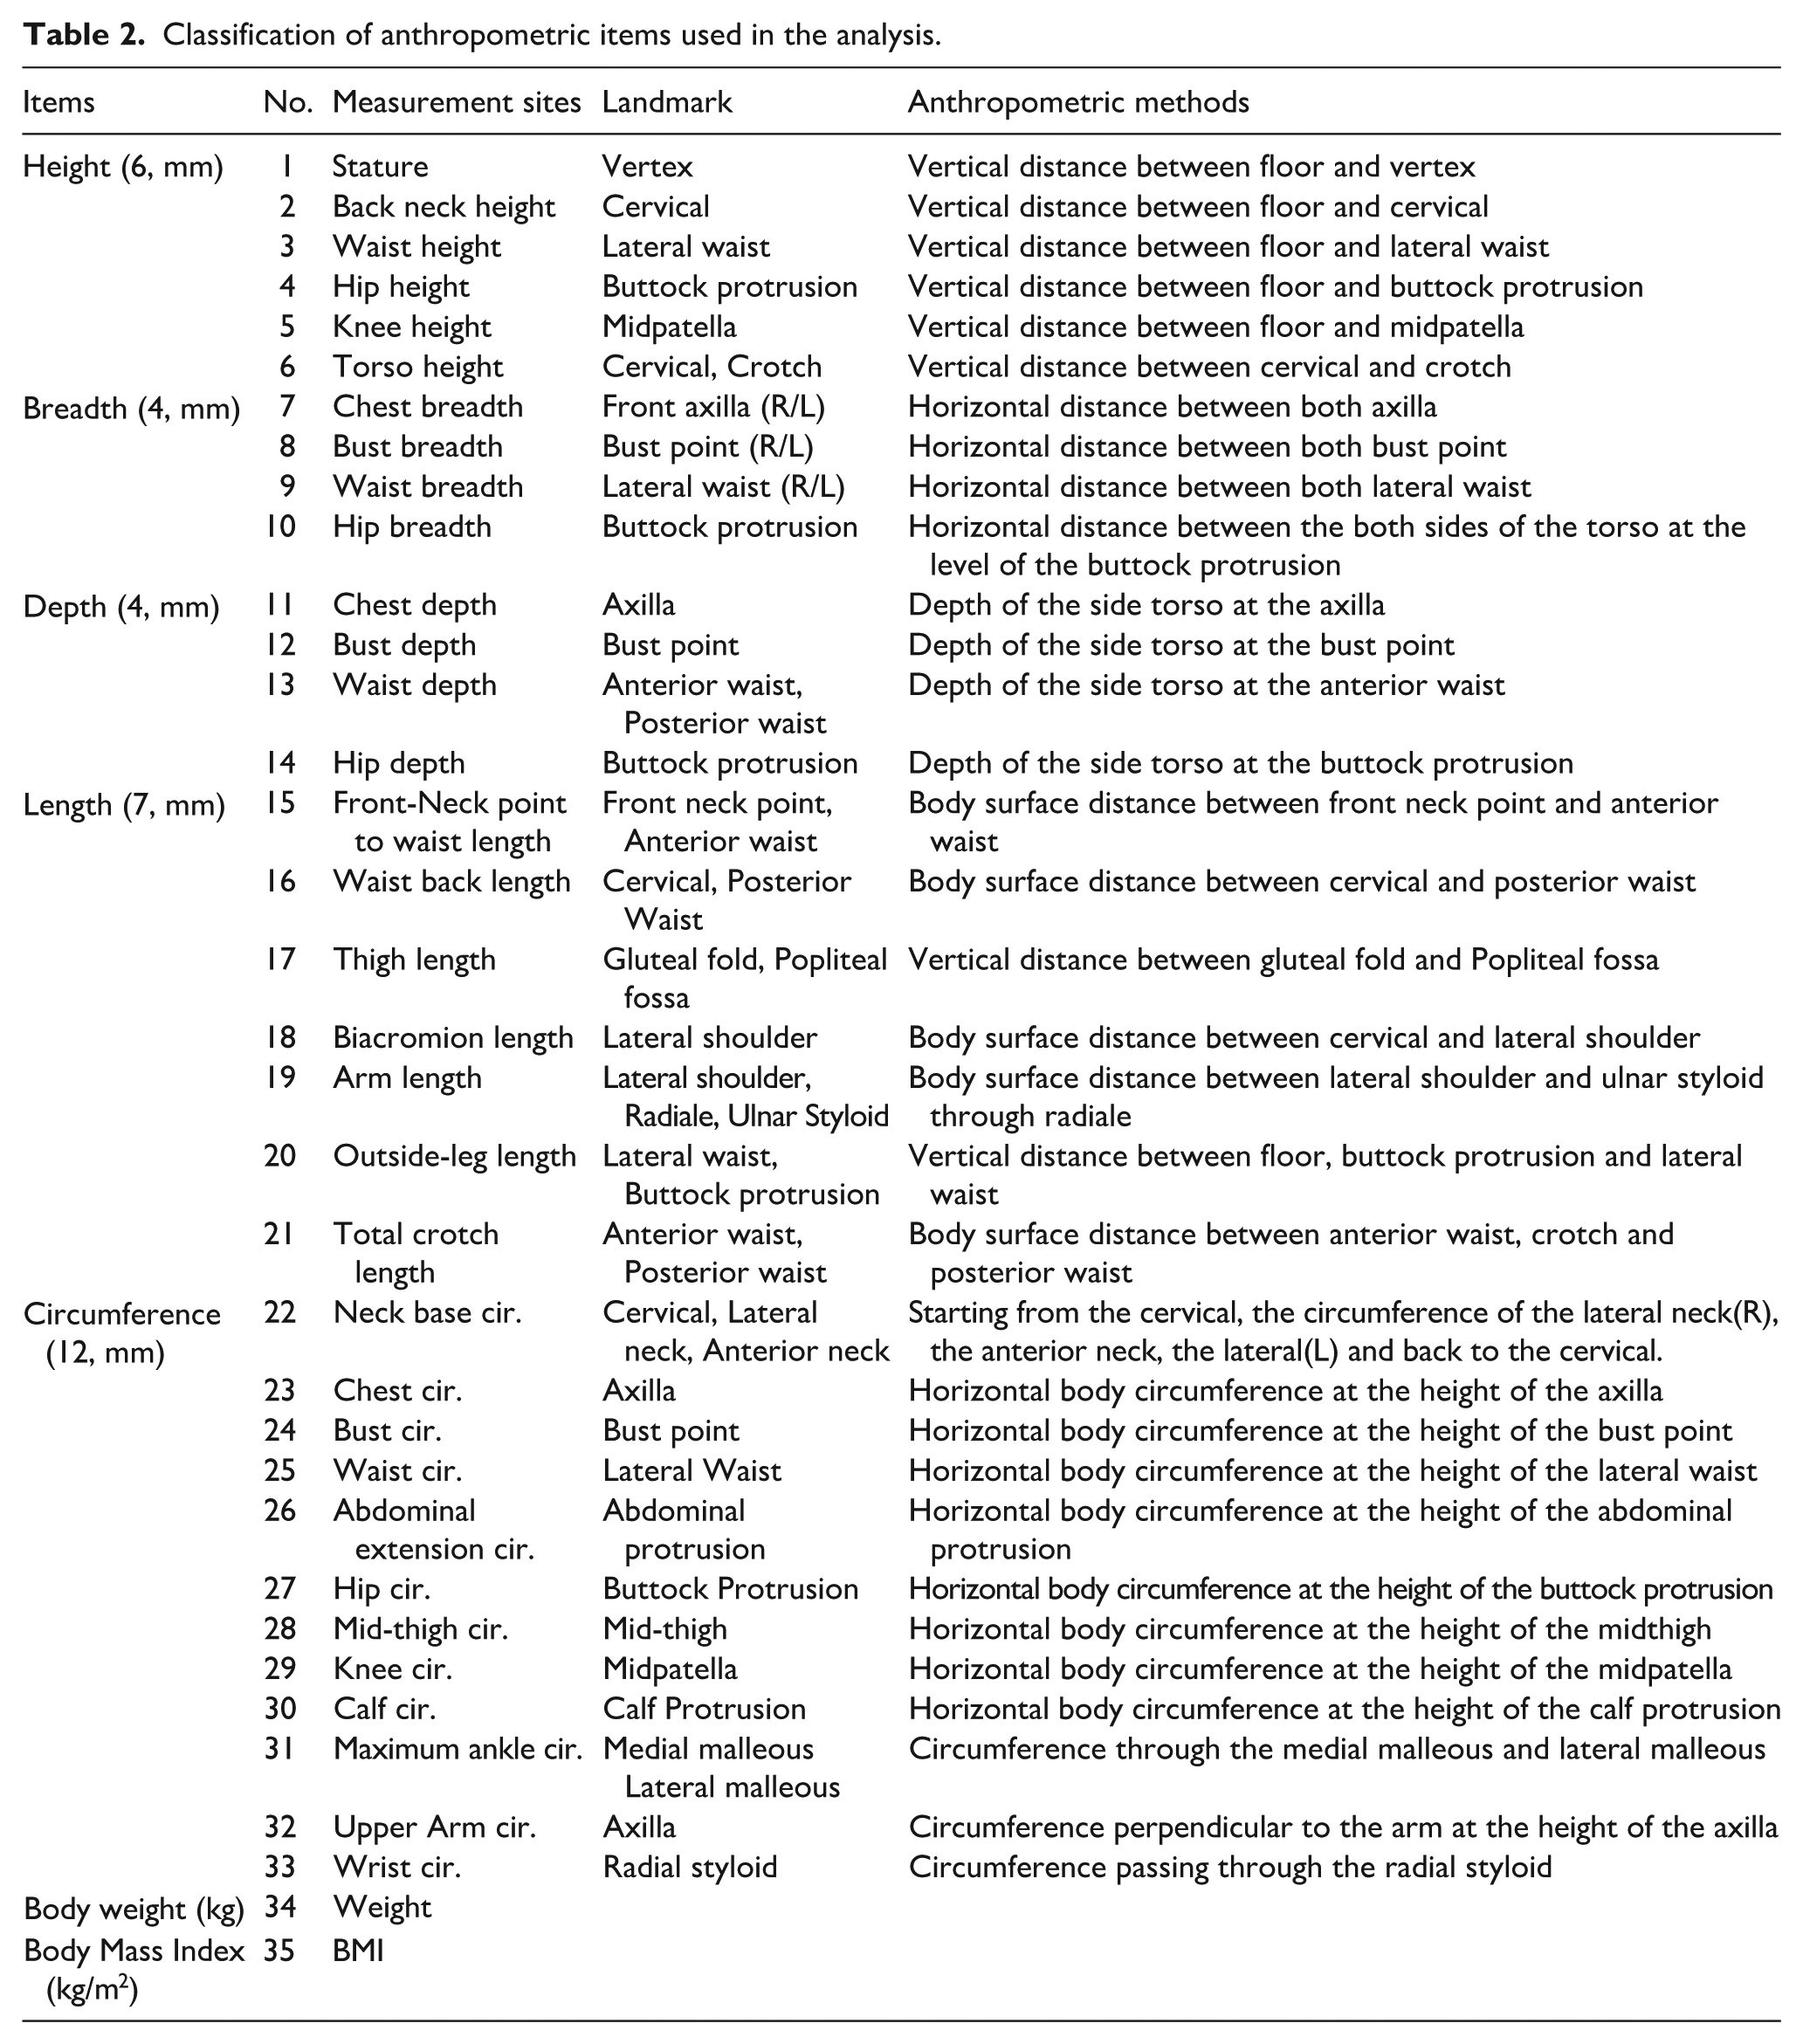
A total of 35 anthropometric variables were selected for analysis, encompassing height, breadth, depth, length, circumference, body weight, and body mass index (BMI; Table 2, Figure 1). The selection of these measurement points was grounded in both international standards and prior empirical research. Specifically, ISO 8559 provides standardized definitions for core anthropometric landmarks relevant to apparel sizing and ergonomic assessment. 28 In addition, this study adopted measurement items that have been widely used in previous research on body measurement changes and in studies addressing clothing production based on body measurement variations.27,29,30 By incorporating these categories, the study ensured that both overall growth trends (e.g. stature, weight) and region-specific structural changes (e.g. waist circumference, chest breadth, thigh length) were systematically captured. All variables were continuous and measured on a ratio scale: linear dimensions in centimeters (mm), weight in kilograms (kg), and BMI in kg/m². This multidimensional dataset thus provided a robust framework to detect not only general trends in adolescent body measurement changes before and after the pandemic, but also detailed shifts in the proportional distribution of body regions.
Classification of anthropometric items used in the analysis.

Location of anthropometric items.
Statistical analysis
For each year and sex, descriptive statistics (means and standard deviations) were calculated for 35 anthropometric variables.
Recognizing that the imbalance in sample sizes between the two time points could affect the results, reconstructing a 2015 sample that matched the 2023 group in size, age, and sex distribution. The 2023 dataset included 125 males and 120 females (N = 245). To create a comparable sample from 2015, random sampling was conducted from the original dataset while preserving the same age and sex structure. Random selection was executed using the RV.UNIFORM function in IBM SPSS Statistics, which assigned a random number (between 0 and 1) to each case. Cases were then sorted based on this number, and the top-ranked entries were selected. The final matched 2015 sample included: 64 males (ages 16–17), 61 males (ages 18–19), 62 females (ages 16–17), and 58 females (ages 18–19), totaling 245 participants.
After verifying normality, independent samples t-tests were performed to compare the matched samples. Additionally, two-way analysis of variance (Two-way ANOVA) was employed to investigate potential interaction effects between year (2015 vs 2023) and sex (male vs female) on body measurement indicators. This analysis aimed to determine whether the impact of the pandemic on adolescent body morphology varied by sex. To assess distributional changes in BMI categories, BMI was converted into a categorical variable using the following criteria: underweight (BMI < 18.5), normal (18.5 ⩽ BMI < 23), overweight (23 ⩽ BMI < 25), and obese (BMI ⩾ 25). Chi-square tests were conducted to assess differences in the distribution of BMI categories across years and sexes among male and female adolescents, in order to evaluate whether the prevalence of overweight and obesity increased after the pandemic.
All statistical analyses were performed using IBM SPSS Statistics version 29.0, with a significance level (α) set at 0.05. The overall research procedure is illustrated in Figure 2. Analytical results are presented in tables, including means (M), standard deviations (SD), t-values, and p-values.

Research flow.
Results
Descriptive statistics
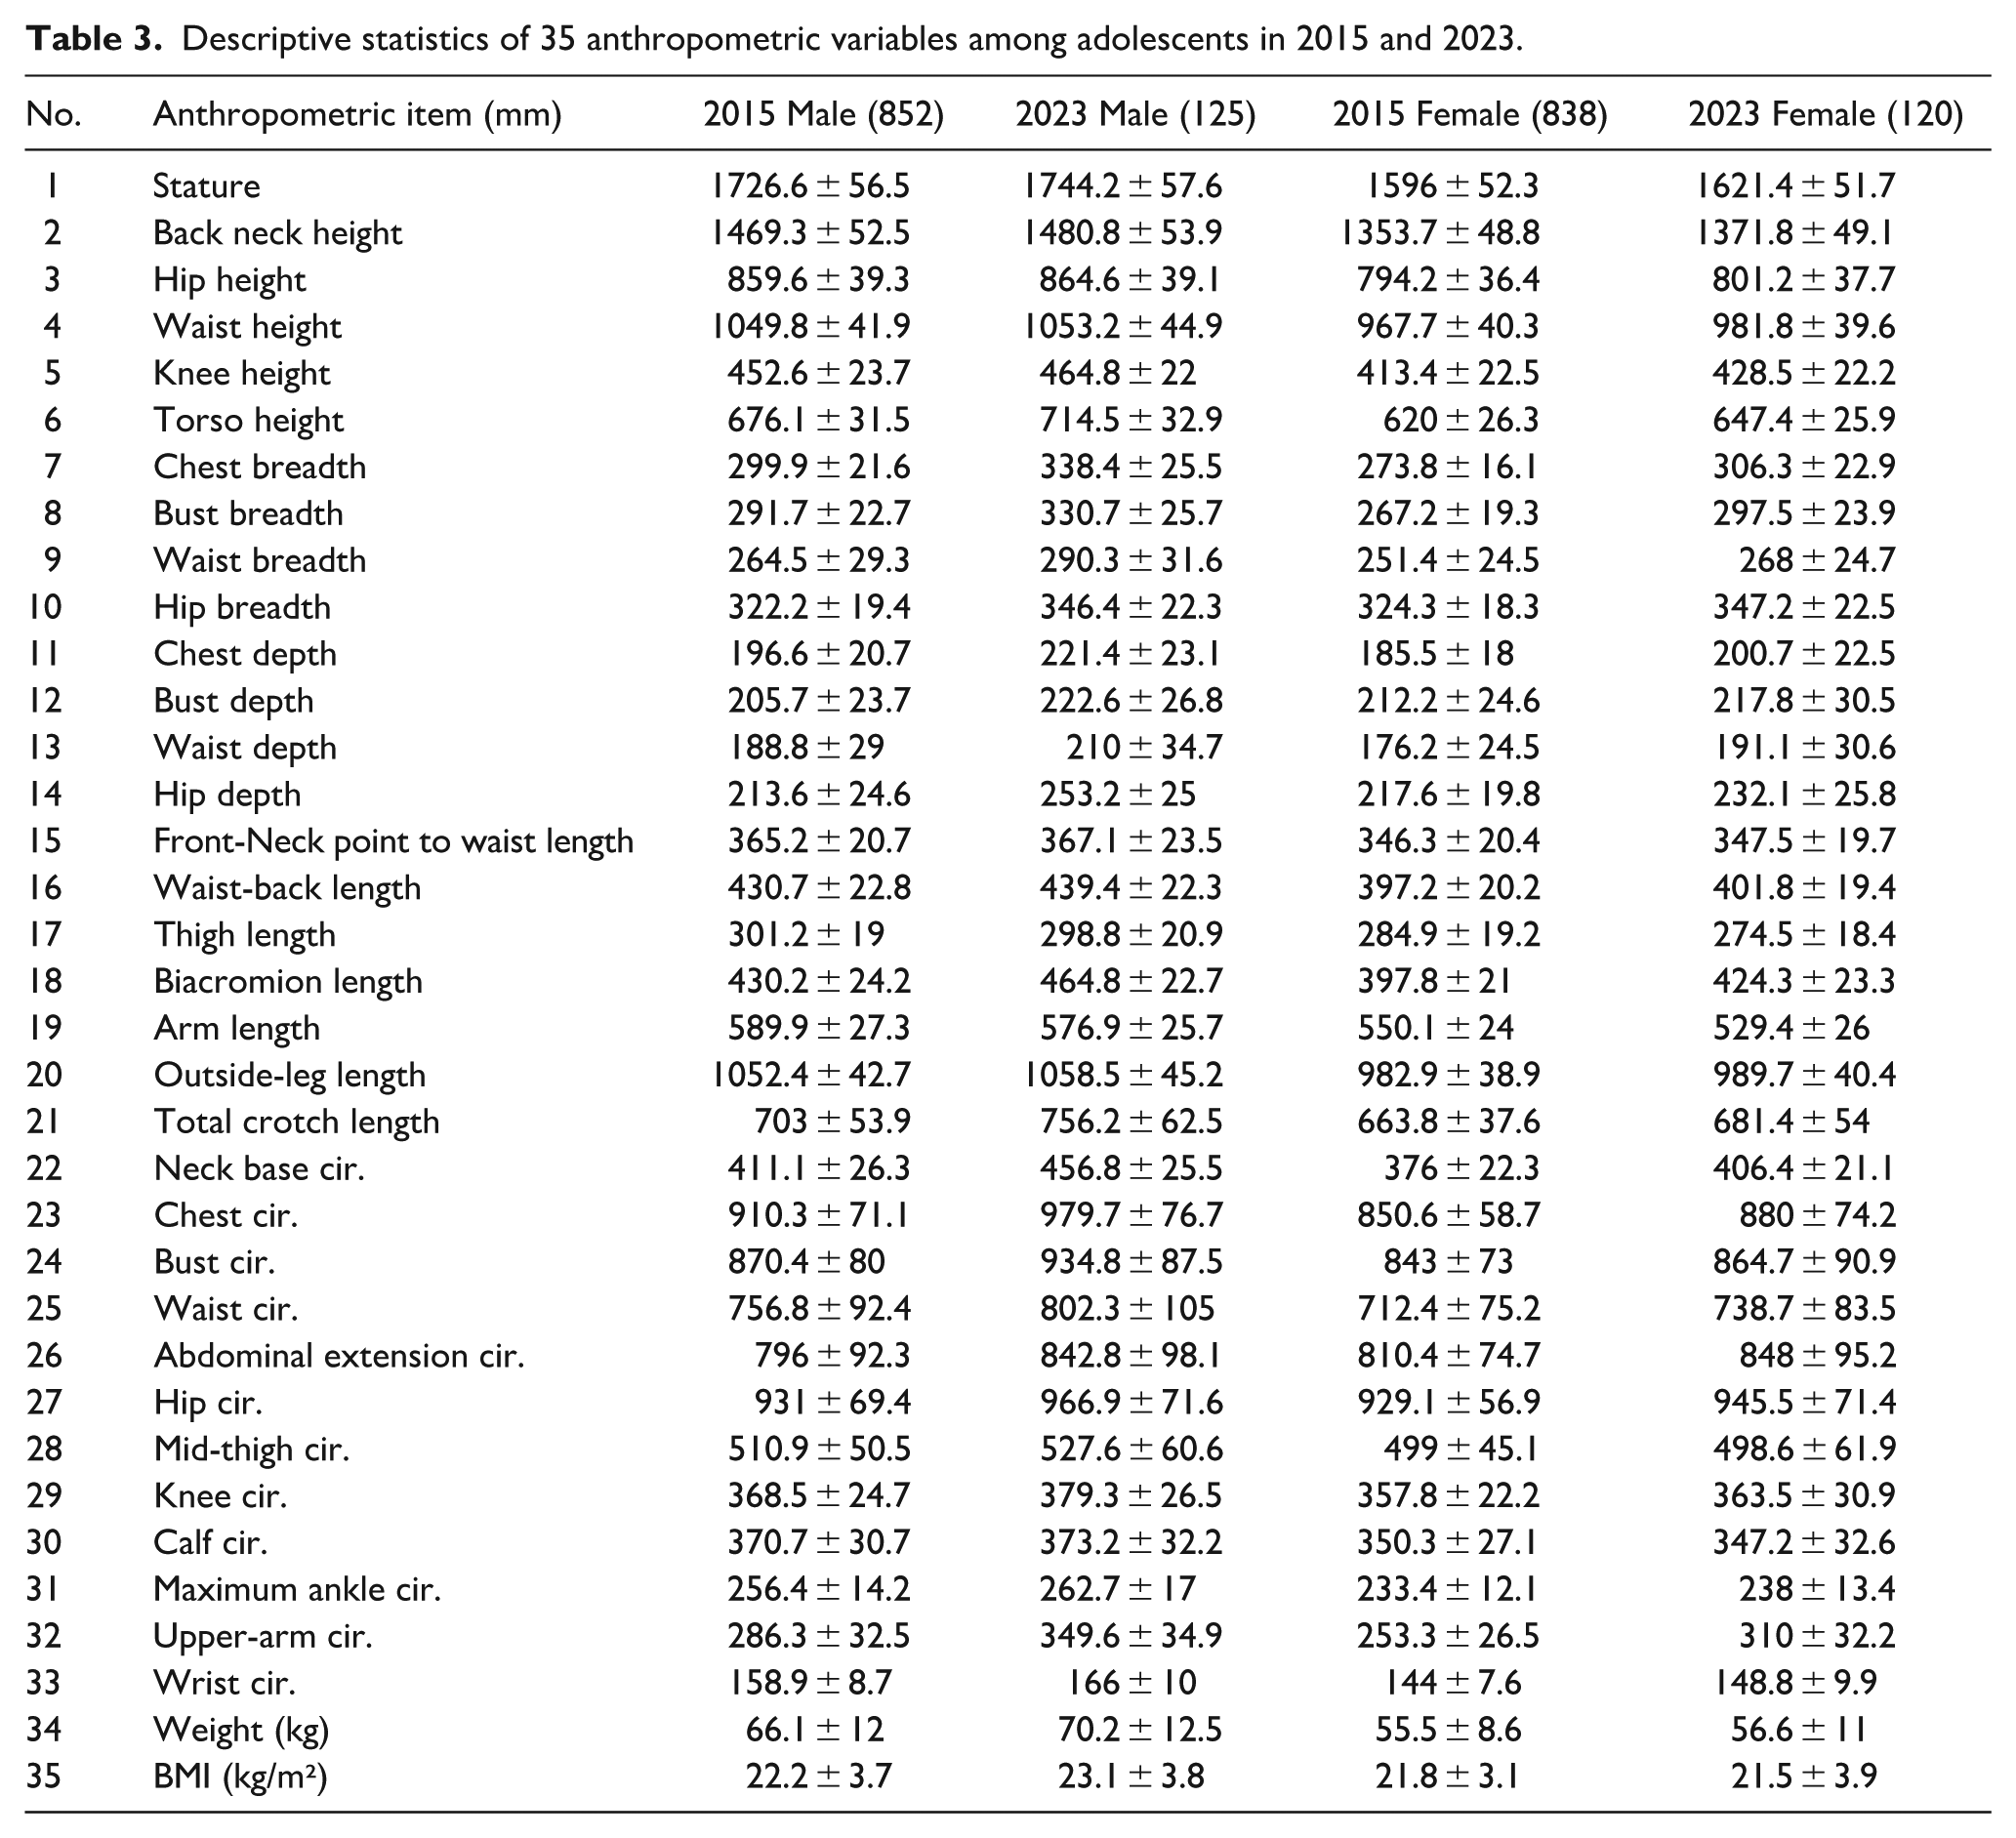
The measurement results of 35 anthropometric variables for male and female adolescents aged 16–19 (2015: n = 1690; 2023: n = 245) are presented in Table 3. The mean and standard deviation are provided for 6 height items, 8 breadth and depth items, 7 length items, 12 circumference items, as well as body weight and BMI.
Descriptive statistics of 35 anthropometric variables among adolescents in 2015 and 2023.
Random sampling-based comparative analysis
To ensure comparability between the 2015 and 2023 datasets, a random subsample was extracted from the 2015 data that matched the sex and age composition of the 2023 dataset. Specifically, a uniform random number between 0 and 1 was generated for each case in the 2015 dataset, which was then randomly sorted based on these values. For each sex–age combination (e.g. males aged 16–17, females aged 18–19), the top N individuals matching the 2023 sample sizes were selected, resulting in a subsample of 245 participants. This procedure enabled a balanced comparison across time points and allowed for a clearer analysis of sex-specific changes in adolescent body measurements before and after the pandemic.
Results of independent samples t-test (male adolescents)
To assess changes in body measurement among male adolescents before and after the pandemic, an independent samples t-test was conducted. Normality of the data distribution was confirmed, and the test results are presented in Table 4.
Comparison of anthropometric items among male before and after the COVID-19 (n = 250).

*p < 0.05. **p < 0.01. ***p < 0.001.
Bold values are significant.
Height significantly increased after the pandemic (p < 0.01), indicating a continued general growth trend. However, arm length decreased significantly (p < 0.001), and thigh length also showed a statistically significant reduction (p < 0.05). In contrast, torso height showed a marked increase (p < 0.001), suggesting that while limb growth was restricted, growth was concentrated in the torso.
Significant increases were also observed in the breadth and depth of the chest, waist, and hips (p < 0.001). For example, chest breadth and hip depth exhibited particularly notable changes, which can be interpreted as torso volume expansion due to increased sedentary behavior and reduced physical activity during the pandemic.
Across all circumference measurements, statistically significant increases were found, with upper-arm circumference showing the most dramatic change—an increase of approximately 24.8% after the pandemic. This change is more likely attributed to fat accumulation rather than muscular development. In addition, abdominal extension circumference, as well as chest, waist, and hip circumferences, increased significantly (p < 0.001), possibly resulting in asymmetrical, upper-body-dominant body measurements.
Body weight increased by an average of 6.3 kg (p < 0.001), and BMI also rose significantly (p < 0.001). Despite height increases, the larger gain in weight suggests an overall increase in body fat. Meanwhile, lower limb length and circumference changes were minimal or statistically insignificant. For instance, knee height significantly increased (p < 0.001), but outside-leg length showed no meaningful change. This pattern suggests that reduced physical activity during the pandemic primarily influenced upper-body and torso development rather than lower limb growth.
Results of independent samples t-test (female adolescents)
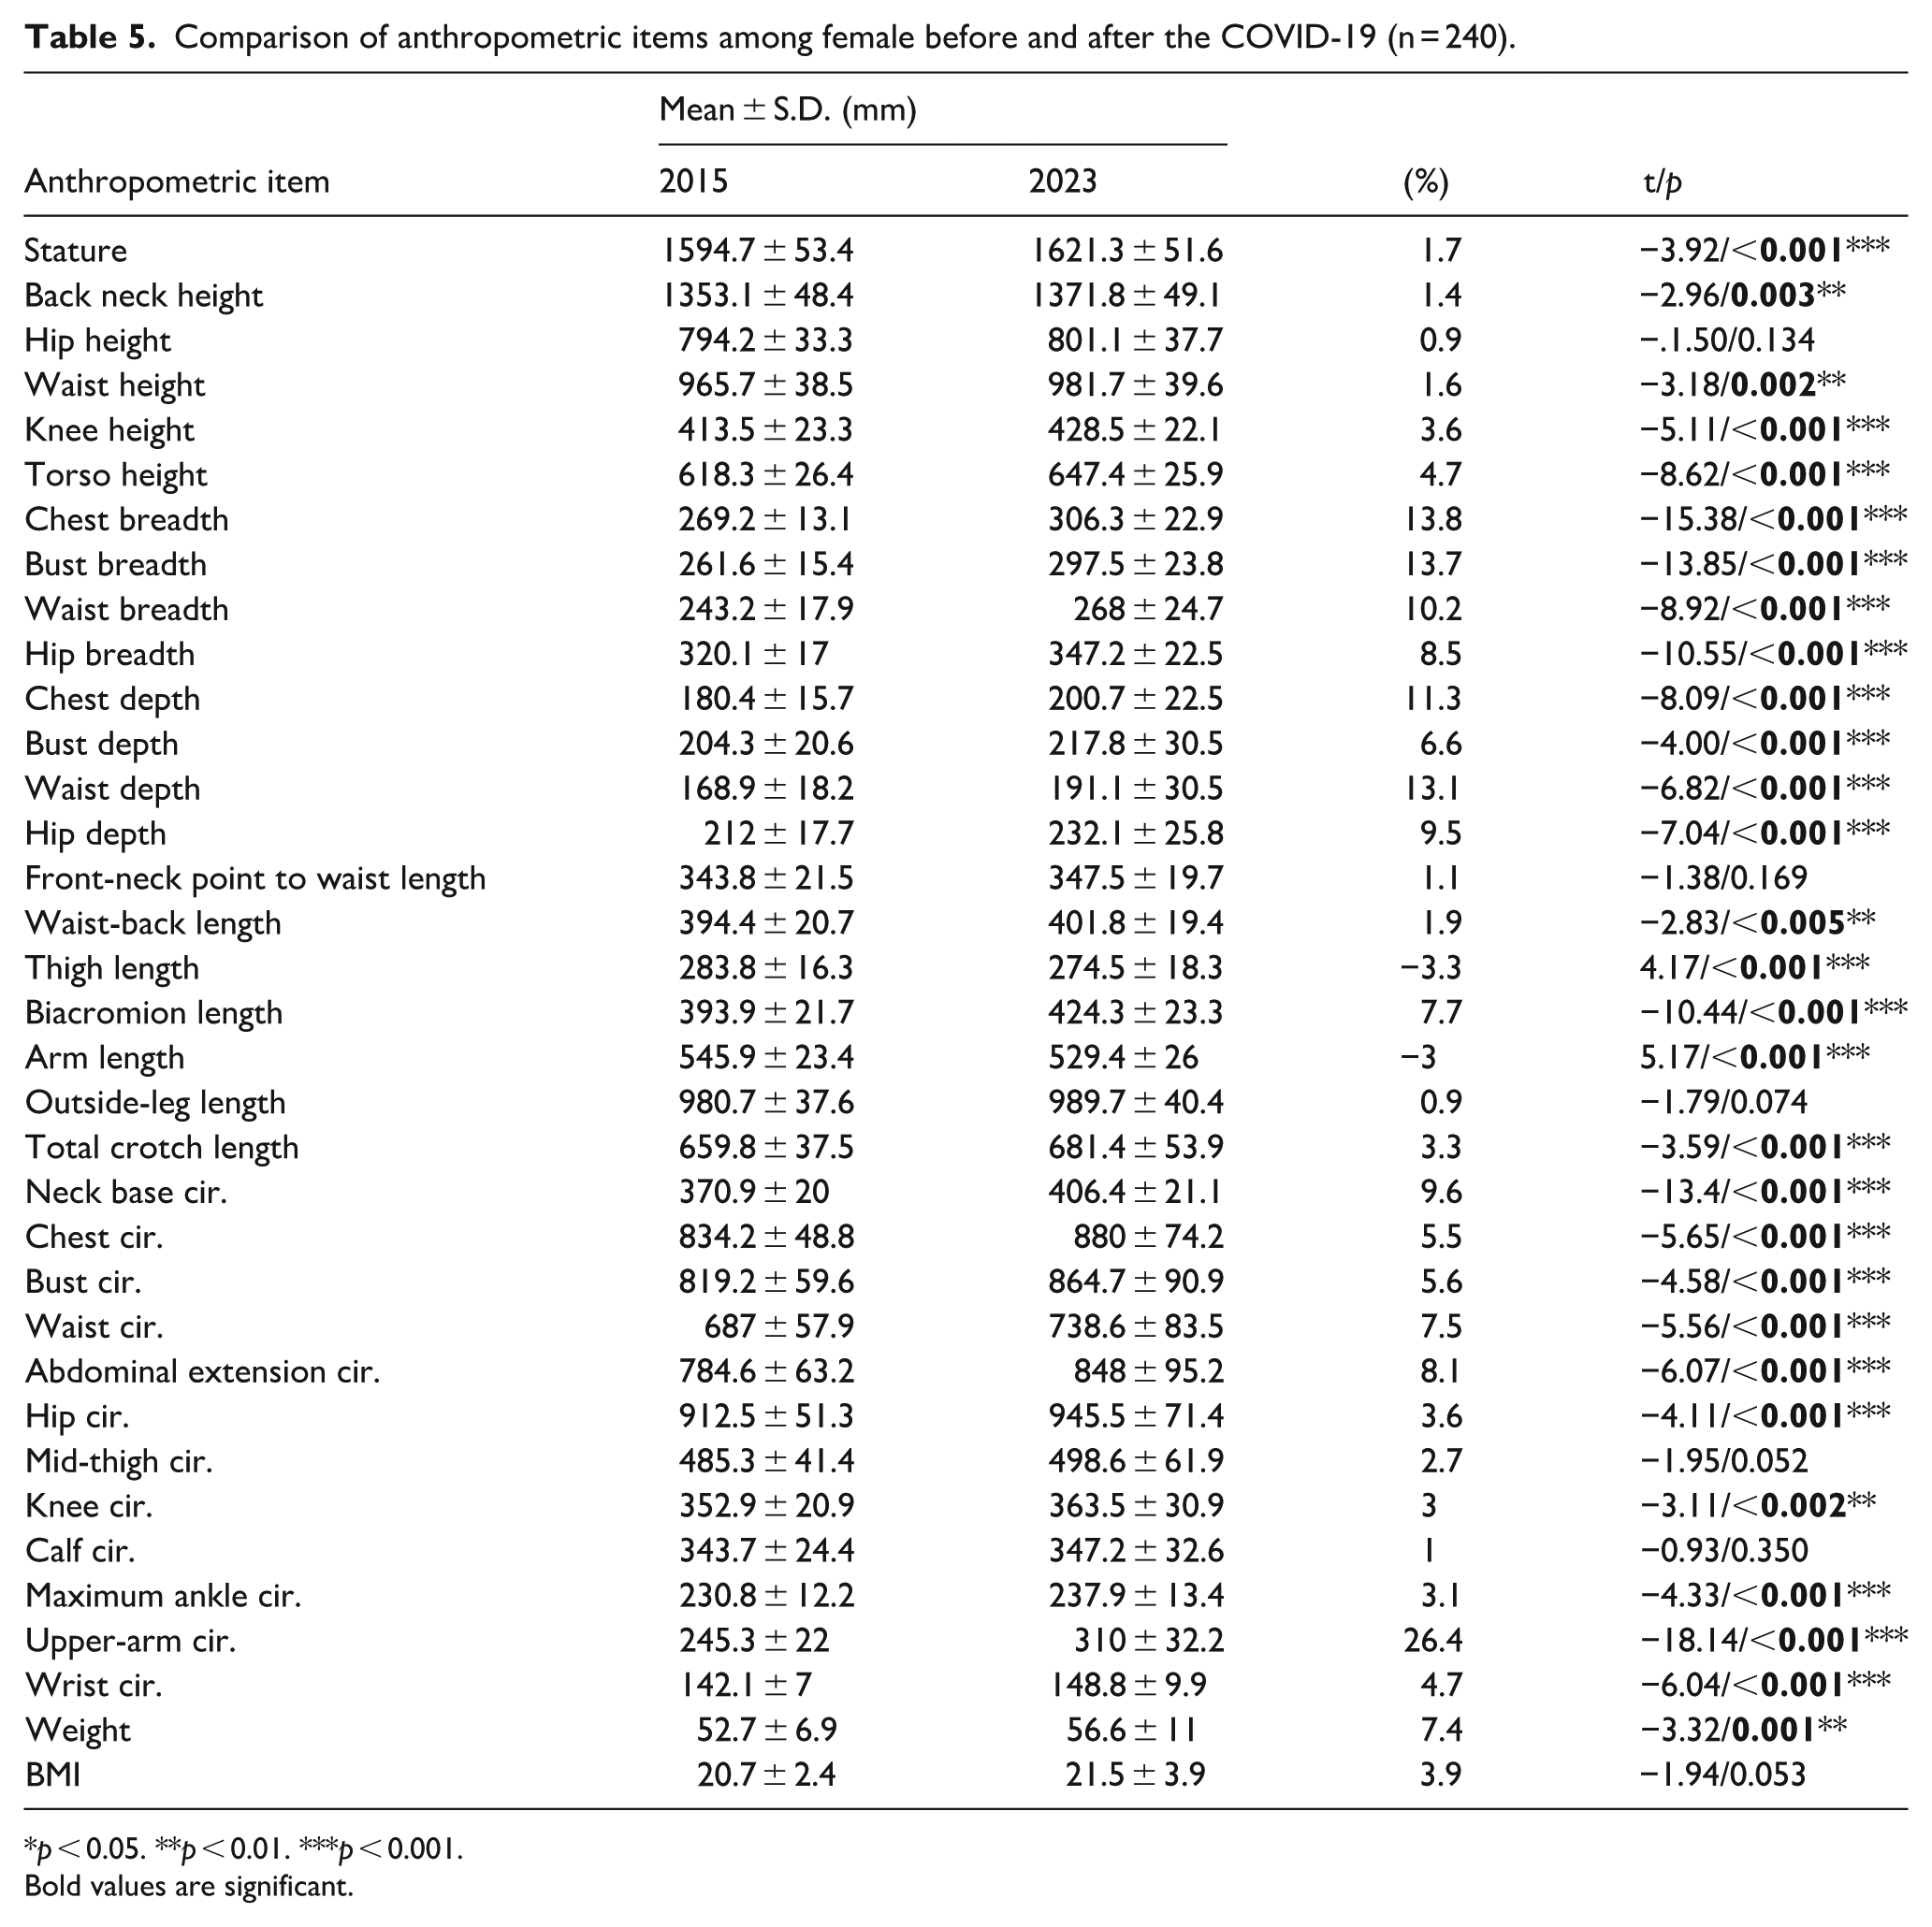
Independent samples t-tests were also conducted to examine changes in female adolescent body measurement before and after the pandemic, revealing several statistically significant differences (Table 5).
Comparison of anthropometric items among female before and after the COVID-19 (n = 240).
p < 0.05. **p < 0.01. ***p < 0.001.
Bold values are significant.
Height increased significantly post-pandemic (p < 0.001), suggesting that overall growth trends continued during the pandemic. However, both arm length and thigh length decreased significantly (p < 0.001), indicating limited limb growth despite increased height. Conversely, torso height increased significantly (p < 0.001), demonstrating a shift in growth orientation toward the torso rather than the lower limbs. Among lower limb variables, only knee height showed a significant increase (p < 0.001), while calf circumference and outside-leg length did not differ significantly. This suggests that the decline in physical activity during the pandemic had a limited effect on lower limb development but more pronounced effects on upper-body measurement.
Substantial increases were observed in torso breadth and depth, including the chest, waist, and hips (p < 0.001). For example, chest breadth increased by 13.8%, and hip depth by 9.5%, reflecting expanded torso volume likely due to increased sedentary behavior and decreased physical activity. Circumference variables also showed significant changes, with upper-arm circumference increasing by 26.4%, the most substantial change (p < 0.001). This likely reflects fat accumulation rather than muscular development. Significant increases were also observed in abdominal extension circumference, chest circumference, and waist circumference (p < 0.001), suggesting asymmetrical body measurement development focused on the upper body.
Body weight increased by an average of approximately 3.9 kg (p = 0.001), and BMI increased by 3.9% post-pandemic. However, this increase was only marginally non-significant (p = 0.053), slightly exceeding the 0.05 threshold. Nonetheless, when considering the concurrent increase in body weight, these results may still imply fat mass accumulation.
Results of two-way ANOVA (year × sex Interaction)
To examine interaction effects between year (2015 vs 2023) and sex (male vs female) on anthropometric variables, a two-way ANOVA was conducted. Significant interaction effects were found for several variables, indicating that the degree and pattern of body measurement change varied by sex even across the same time frame (Table 6). It should be noted that while the two-way ANOVA examined the combined interaction of year and sex, detailed sex-specific changes were separately reported through independent t-tests and chi-square analyses.
Summary of two-way ANOVA results for year × sex interaction (only significant items).

*p < 0.05. **p < 0.01. ***p < 0.001.
Bold values are significant.
Notable interaction effects were observed for limb length items such as arm length (F = 43.569, p < 0.001, η² = 0.082), waist-back length (F = 32.820, p < 0.001, η² = 0.063), and thigh length (F = 36.952, p < 0.001, η² = 0.071), suggesting sex-specific differences in growth patterns or physical activity levels during the pandemic. Significant interaction effects were also found in upper-body circumference measurements including neck base circumference (F = 98.572, p < 0.001, η² = 0.169), chest circumference (F = 91.575, p < 0.001, η² = 0.159), and bust circumference (F = 20.895, p < 0.001, η² = 0.041). These results imply that pandemic-related torso-centered body measurement changes may have been more pronounced in one sex than the other. Additional interaction effects were observed for hip depth, total crotch length, and abdominal extension circumference, indicating that lifestyle changes during the pandemic may have led to sex-specific patterns in body measurement change.
Distribution of BMI categories before and after the COVID-19 pandemic by sex
Chi-square tests were then conducted separately for male and female adolescents to examine differences in the distribution of BMI categories by year. This allowed us to assess whether the proportion of overweight and obese adolescents increased after the pandemic in each sex group.
The results indicated a statistically significant change in the distribution of BMI categories among male adolescents before and after the COVID-19 pandemic (χ² = 10.093, df = 3, p = 0.018). After the pandemic, the proportion of male adolescents classified as normal weight decreased (62.4% → 49.6%), whereas the proportions classified as overweight (12.8% → 24.0%) and obese (11.2% → 18.4%) increased. In particular, the prevalence of overweight nearly doubled, and obesity also showed a marked increase. These findings suggest that the prevalence of excess weight (overweight and obesity) significantly increased among male adolescents after the pandemic, likely due to lifestyle changes such as reduced physical activity and increased sedentary behavior (Table 7).
Distribution of BMI categories among male adolescents before and after the COVID-19 pandemic (N = 250).

Pearson’s χ² = 10.09, df = 3,
The results indicated a statistically significant change in the distribution of BMI categories among female adolescents before and after the COVID-19 pandemic (χ² = 8.131, df = 3, p = 0.043). After the pandemic, the proportion of female adolescents classified as normal weight decreased (65.8% → 58.3%), whereas the proportion classified as obese increased substantially (3.3% → 13.3%). Underweight prevalence showed a slight decrease (20.8% → 17.5%), while overweight remained relatively stable (10.0% → 10.8%). These findings suggest that the prevalence of obesity significantly increased among female adolescents after the pandemic, likely due to lifestyle changes such as reduced physical activity and increased sedentary behavior (Table 8). Although the independent t-test did not indicate a statistically significant increase in mean BMI among female adolescents, the chi-square test revealed a significant shift in the distribution of BMI categories. This suggests that, while the overall average BMI remained relatively stable, there was a meaningful redistribution within categories, with a decrease in the proportion classified as normal weight and a notable increase in the proportion classified as obese.
Distribution of BMI categories among female adolescents before and after the COVID-19 pandemic (N = 250).
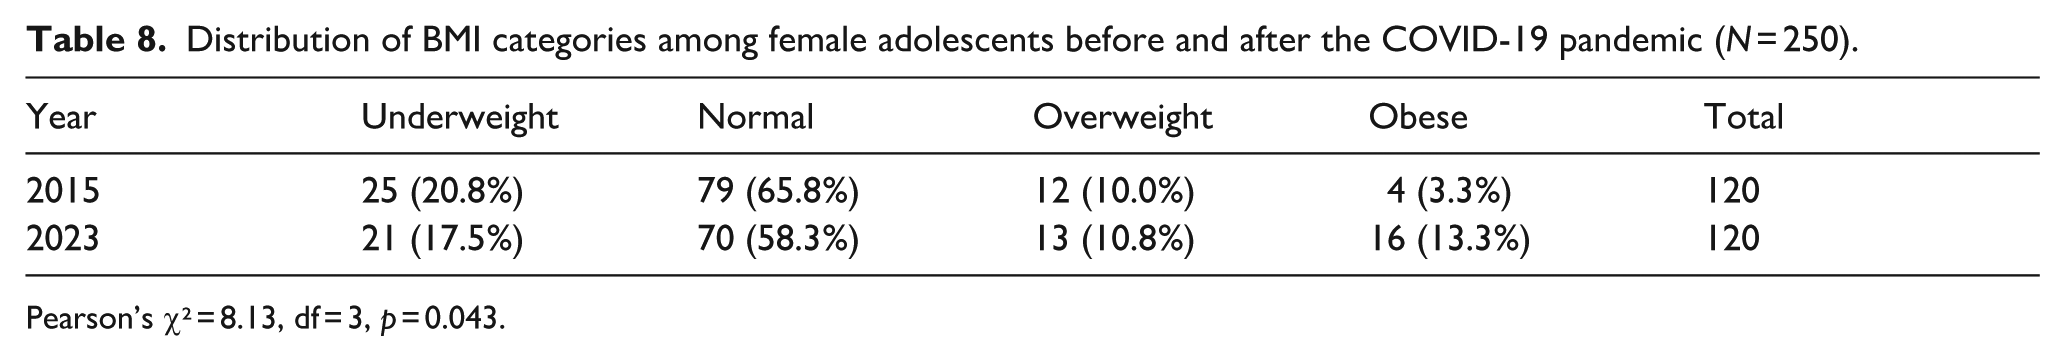
Pearson’s χ² = 8.13, df = 3, p = 0.043.
Discussion
This study quantitatively examined changes in adolescent body measurement before and after the COVID-19 pandemic by analyzing anthropometric data, thereby elucidating the physical impact of the pandemic based on objective body measurements.
Regarding weight gain and changes in obesity classification, this study found statistically significant increases in both body weight and BMI among adolescents after the pandemic. Notably, the proportion of individuals classified as overweight or obese increased substantially. These findings align with previous studies which reported a marked rise in adolescent obesity prevalence during the pandemic. 31 Similarly, previous study observed a sharp increase in BMI among children and adolescents in the United States during the pandemic, corroborating the present findings. 32 Sex-specific differences also mirrored trends reported in prior literature. In this study, the magnitude of increase in both weight and BMI was greater among male adolescents than females, and significant interaction effects between sex and time point were identified. Importantly, while the independent t-test did not reveal a statistically significant increase in mean BMI among female adolescents, the chi-square analysis demonstrated a significant redistribution of BMI categories, characterized by a decrease in the normal weight group and a marked increase in obesity prevalence. This indicates that even in the absence of a substantial shift in mean BMI, meaningful changes in weight status distribution occurred among female adolescents. This underscores the value of employing both continuous and categorical analyses, as mean-based tests alone may overlook distributional changes that carry significant public health implications. Supporting this interpretation, previous study found that male students experienced greater reductions in indoor physical activity compared to female students, rendering them more vulnerable to weight gain during the pandemic—consistent with the patterns observed in this study. 5
While many prior studies have focused primarily on limited indicators such as BMI, weight change, and physical activity levels, the present study stands out by comprehensively analyzing changes using 35 detailed anthropometric variables. Of particular note are the statistically significant increases observed in torso-related measures, including circumference, breadth, and depth of the abdomen and upper body. These changes indicate not only overall weight gain but also shifts in body proportions and measurement distribution.
In contrast, the observed shortening of arm and thigh lengths should be interpreted with caution. While reduced physical activity and prolonged sedentary behavior during the pandemic may have contributed to attenuated limb development, as suggested by prior studies on declines in adolescent physical activity levels during COVID-19, alternative explanations are also possible.33,34 The apparent reduction in limb length may partly reflect the influence of increased BMI on body posture during scanning, or challenges in consistently identifying anthropometric landmarks. 35 These methodological factors could contribute to measurement variability and warrant careful consideration in interpreting the results.
Taken together, these findings are consistent with prior research that reported increases in waist circumference and torso fat distribution after the pandemic.13,36 Whereas earlier studies typically documented such changes using a limited set of indicators, the present study advances the literature by quantifying alterations across multiple anthropometric dimensions, thereby expanding and refining our understanding of how the pandemic affected adolescent physical structure.
This study contributes to both academic and societal domains in several ways:
First, by comparing adolescents of the same age group before and after the pandemic and utilizing 3D anthropometric data for quantitative measurement analysis, the study presents an alternative approach to conventional BMI-centric research. Through in-depth analysis not only of height, weight, and BMI but also of structural changes in the torso—such as the abdomen and thorax—it allows for a more nuanced understanding of the direction and characteristics of adolescent body measurement change. Second, the study applied a range of statistical techniques including Welch’s t-test, two-way ANOVA, and Chi-square test, thereby ensuring robust and sex-specific analysis rather than relying on pooled comparisons. Third, the findings provide empirical evidence of physical changes during adolescence in the post-pandemic period, offering a valuable foundation for improving school health screening systems, developing obesity prevention programs, and designing physical activity interventions for youth. Fourth, updated body measurement information has direct and practical implications for the apparel industry. Specifically, the documented changes in torso dimensions, limb proportions, and circumference items are critical for garment sizing, structural design, and ergonomic fit. These results support the refinement of school uniform standards, sportswear, and undergarment sizing, and they provide a foundation for the development of customized and wearable fashion technologies. In this sense, the study not only contributes to academic knowledge but also supplies data-driven insights that are immediately applicable to clothing production, ensuring better comfort, performance, and inclusivity in apparel systems.
Nonetheless, the study has the following limitations:
First, it did not control for various external factors that may influence body measurement, such as dietary habits, psychological stress, and family environment. The absence of behavioral and environmental variables beyond anthropometric data limits the scope of interpretation. Second, as a cross-sectional analysis comparing two different cohorts at separate time points, the study cannot establish causal relationships with the same rigor as a longitudinal study that directly tracks changes in individuals over time. Third, the anthropometric data used was limited in representativeness by time point, highlighting the need to expand future analyses to nationwide coverage and adolescents from diverse socio-cultural backgrounds. Fourth, the apparent reduction in limb length should also be interpreted in light of potential measurement limitations. Increased BMI may influence body posture during scanning, and inconsistencies in locating anthropometric landmarks may introduce variability in limb length estimates. These methodological issues highlight the need for cautious interpretation and suggest that future studies should refine landmarking protocols and validate 3D scanning methods across different body types.
Conclusion
This study conducted a detailed comparison of 35 anthropometric measurements among Korean adolescents aged 16–19 before (2015) and after (2023) the COVID-19 pandemic. The analysis revealed not only general growth trends but also structural changes such as an upper body–centered shift in morphology and significant fat accumulation. While height increased, arm and thigh lengths decreased, and torso dimensions—including chest, waist, and abdomen—expanded significantly. In addition, chi-square analyses demonstrated significant shifts in BMI category distributions, with decreases in the proportion of adolescents classified as normal weight and increases in overweight and obesity. These changes were more pronounced among males, whereas females exhibited relatively stable mean BMI but showed significant redistribution across weight status categories. This highlights the necessity of multidimensional anthropometric analysis beyond conventional indicators such as mean BMI.
The findings provide valuable data for adolescent health management, physical education, and product design. Most importantly, the updated anthropometric profiles present a critical empirical foundation for apparel-related industries. By integrating these post-pandemic body measurement characteristics into school uniforms, sportswear, and wearable technologies, garment fit, comfort, and performance can be significantly enhanced. From a public health perspective, the observed rise in overweight and obesity further underscores the need for school- and community-based interventions aimed at promoting physical activity and preventing excessive weight gain in adolescents. This demonstrates the study’s direct contribution to advancing size customization and structural garment design tailored to the post-pandemic adolescent population.
Footnotes
Ethical considerations
This study was approved by the Seoul National University Institutional Review Board (IRB No. E2507/003-004).
Funding
The author disclosed receipt of the following financial support for the research, authorship, and/or publication of this article: This work was supported by the National Research Foundation of Korea(NRF) grant funded by the Korea government(MSIT) (RS-2025-00515729) and the BK21 Four Program (5199990814084) of the National Research Foundation of Korea (NRF) funded by the Ministry of Education.
Declaration of conflicting interests
The author declared no potential conflicts of interest with respect to the research, authorship, and/or publication of this article.