
Abstract
This pilot study evaluates the reliability and systematic bias of CAD-based 3D body-scan anthropometry (3DM) for electrode-referenced measurements in smart clothing applications. Anthropometric data from 24 male participants were obtained using both manual measurement (MM) and CAD-based analysis of 3D scan data across five dimensions relevant to EMG-enabled garments. Reliability was assessed using intraclass correlation coefficients (ICC), and agreement was examined through Bland–Altman analysis. The results demonstrated excellent reliability for all measurements (ICC > 0.9), indicating strong consistency between MM and 3DM. However, systematic biases were observed: 3DM underestimated biacromion length, primarily due to standardized scanning posture, and overestimated waist circumference, reflecting the absence of soft-tissue compression in non-contact scanning. In contrast, short surface paths between anatomical landmarks and electrode sites exhibited minimal bias and high agreement. These findings suggest that while CAD-based 3D scan anthropometry provides stable and reproducible electrode-referenced measurements, certain dimensions require careful interpretation due to posture- and curvature-related effects. This methodological evaluation establishes a foundation for the informed use of 3D scan–derived anthropometric data in future smart clothing and wearable system development.
Introduction
With the advance of wearable technology, smart clothing has become an emerging field that integrates electronics and textiles to provide various functions, such as health monitoring, motion tracking, and muscle stimulation.1–3 The performance of smart clothing and the accuracy of biometric signal acquisition largely depend on the precision of electrode placement.4,5
Recent developments in three-dimensional (3D) body scanning technology and computer-aided design (CAD) programs have provided new possibilities for accurate anthropometric measurements and apparel design.6–8 The adoption of 3D scanning and CAD-based measurement methods has significant advantages over traditional manual measurement techniques. Manual measuring methods often rely on measuring tapes and calipers, which are prone to error due to variations in application pressure, measurement points, observer skill level, and subject posture.9,10 In contrast, 3D scanning provides a highly detailed digital representation of the human body without physical contact and enables a more standardized approach to anthropometric analysis in a short time. Despite their potential, the reliability of measurements derived from 3D scan data remains a concern. Measurement errors can arise from various factors, such as scanner accuracy, differences in measurement software, operator skill level, subject’s posture variations, and measurement environment.6,11 Ensuring consistency and accuracy in these measurements is essential for the successful implementation of smart clothing.
Smart clothing has gained increasing attention due to its wide range of applications, including performance enhancement, posture correction, and injury prevention. Among various biosignal technologies, electromyography (EMG) is particularly valuable because it enables real-time monitoring of muscle activity during exercise or daily movements.2,12 To achieve reliable signal acquisition in such systems, accurate electrode placement is essential, as even small positional deviations can directly affect signal quality. However, EMG electrode locations vary among individuals due to differences in body shape and anthropometric dimensions, posing a major challenge for developing size-specific or customized smart garments. 13 Importantly, this variability is not entirely random; rather, it may be systematically associated with measurable anthropometric characteristics. However, most previous EMG studies have focused on identifying optimal electrode placement for signal quality,2,14,15 rather than examining how these sites relate to apparel‐relevant anthropometric landmarks. As a result, there is little evidence on how EMG electrode locations correspond to body measurements typically used in garment pattern development, leaving a gap in applying EMG research directly to smart clothing design.
The specific aim of this pilot study is to evaluate the methodological feasibility of using CAD-based 3D scan data as a direct input for smart garment pattern engineering. Unlike previous general anthropometric studies, this research focuses on five critical landmarks essential for EMG sensor placement. By identifying the systematic offsets between 3DM and MM, we aim to provide the necessary calibration data for digital garment construction, ensuring that 3D scan-derived coordinates can be reliably translated into functional, precision-fit smart clothing.
Literature review
Reliability of anthropometric data with 3D body scanners
Manual measurements and 3D body-scanner maximum permissible errors (Unit: mm).
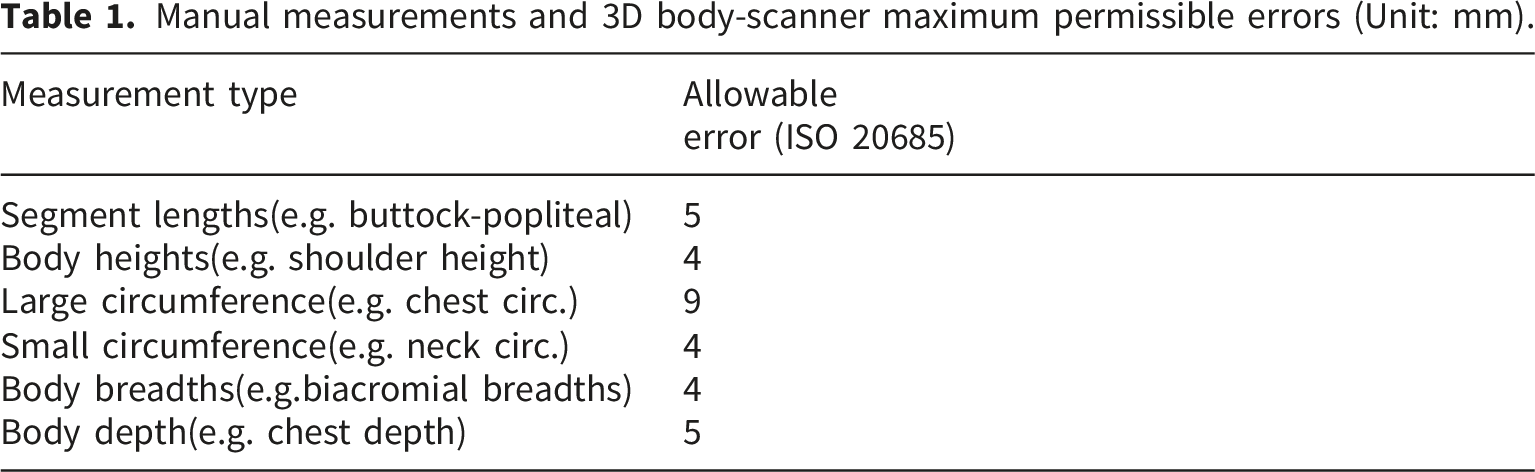
Several studies have addressed these concerns by comparing 3D scan-based anthropometric data with traditional manual measurements. Han & Nam, 19 using data from the 5th Korean Anthropometric Survey, analyzed discrepancies between 3D scan-derived and manually collected measurements among adults aged 20 to 75 years. Istook et al. 7 examined ten women in their 20s and 30s, reporting differences between automated 3D extraction and manual tape measurements. Park & Nam 20 used a standardized dress form to compare manual and scan-derived measurements. These studies reported general agreement across many measurement items but identified systematic discrepancies in girth-related measures, biacromion length, and measurements near the crotch, which were attributed to difficulties in scanning highly curved regions and participant posture variability. McKinnon & Istook 21 emphasized the limitations of scan-based data interpretation, noting that while “most scan-derived measures are very reliable, girth measurements and highly curved areas are more susceptible to errors.” Kuehnapfel et al. 22 reported excellent intra-observer reliability (ICC > 0.9) for 3D laser scanning, but found significant inter-method differences in the chest, waist, and hip circumferences, which is consistent with ISO 20685-1 guidance on allowable differences between manual and scan-derived measurements (particularly for large circumferences).
Smart clothing design using 3D body-scan data
Three-dimensional (3D) body scanning technology has gained significant traction in garment design and smart clothing applications owing to its efficiency and ability to capture the surface geometry of the body in a non-invasive manner. One critical factor influencing the scan reliability is the accuracy of anatomical landmark placement. Kouchi & Mochimaru 11 reported that “errors in landmarking were larger than those in body dimensions,” highlighting landmark misplacement as a major contributor to anthropometric discrepancies. The recent advances in CAD-based measurement techniques offer a potential solution to these limitations. Kouchi & Mochimaru 11 and Istook et al. 7 have shown that manual landmark-based measurement of 3D scanned data using CAD software can enhance precision by circumventing the errors inherent in automatic detection and measurement algorithms. These approaches provide a practical balance between automation and measurement fidelity, making them particularly suitable for applications requiring high anatomical accuracy, such as sensor placement in smart garment design. These studies affirm the viability of 3D scanning technology for anthropometric measurement and caution against sole reliance on automated measurements. They advocate for hybrid methods incorporating manual expertise, particularly in regions prone to curvature, occlusion, or motion-related distortion.
Unlike automated full-body scanners that rely on preprogrammed algorithms for landmark recognition and dimension calculation, handheld scanners require manual post-processing using 3D CAD software. This manual method allows the user to control the landmark placement and measurement paths but introduces potential variability due to operator skill, scan consistency, and interpretation of anatomical points. 23 Despite this, these devices are useful in research and development settings requiring precise localization, such as smart clothing or sensor-integrated garments where capturing body curvature and surface details is essential. Nevertheless, the shift from automated to manual CAD-based measurement underscores the need to validate the reliability and accuracy of the extracted anthropometric values. Studies have suggested that while structured light scanners can provide detailed scans, consistent landmarking and standardized measurement protocols are critical to minimizing error and enhancing usability. 24 Accordingly, this study highlights the need to validate scan-derived measurements at electrode-referenced landmarks as potential design inputs.
Definition and measurement method of EMG
Electromyography (EMG) records the electrical activity generated by skeletal muscle during neuromuscular activation. EMG is commonly used to quantify activation timing and amplitude, and assess fatigue. 5 To improve the efficiency of fitness activities, EMG‐measuring smart clothing is being developed that can monitor muscle activation and balance during exercise. 14 Commercial products acquire muscle-activity signals via surface EMG (sEMG) electrode integrated on the inner face of the garment. However, sEMG has a smaller amplitude than signals such as ECG and is susceptible to external noise; movement can displace the electrode from the muscle belly and generate dynamic artefacts. In addition, cyclic skin contraction/relaxation and soft-tissue deformation can increase measurement error, and cross-talk from adjacent muscles may contaminate the target signal. 5 Accurate placements tailored to the target muscle and the measurement protocol is therefore critical.5,25
sEMG electrode placement follows established recommendations, including alignment with muscle-fiber direction, maintenance of inter-electrode distance (typically ≈20 mm), and centering over the muscle belly. 5 To implement such placement consistently in garments, candidate electrode sites should be palpated and marked prior to 3D scanning, and distances (or surface arcs) from nearby anthropometric landmarks (APs) should be digitized. Even within a single garment size, vertical and horizontal variability in anatomical landmark locations can be substantial, and traditional grading rules alone may not guarantee landmark–sensor alignment. 26 Consequently, analyses across diverse body shapes and validation of measurement reliability are required, with priority given to assessing whether landmark-to-electrode distances derived from scan data are sufficiently reliable for use as design inputs.
Experimental
Subjects
Twenty-four males in their 20s and 30s were recruited (height = 175.8 ± 4.3 cm; body weight = 74.5 ± 8.9 kg; body fat = 20.0 ± 4.9 %; waist circumference = 81.2 ± 5.9 cm). This study was approved by the Institutional Review Board of Korea National Institute for Bioethics Policy (Approval No. P01-202005-23-002) on May 20, 2021. All participants provided written informed consent prior to enrollment in the study. The research was conducted in accordance with the ethical principles for research involving human subjects as outlined in the World Medical Association Declaration of Helsinki.
Measurement procedure
The experimental procedures followed the protocol illustrated in Figure 1. Anthropometric measurements were obtained using manual measurement with a tape measure (MM) and measurement based on 3D body scan data using CAD software (3DM). Before the measurements, the anthropometric points (AP) and electromyography (EMG) electrode points (EP) were marked manually on the body of each participant. MM was conducted first, followed by 3D scanning using the same APs and EPs. Participants wore only tight-fitting shorts to minimize the measurement distortions caused by clothing. A trained expert marked nine APs and two EPs. A measuring tape was used for MM to obtain measurements based on the landmarks. Manual measurements followed the ISO 8559-1 definition of anthropometric items, where circumferences and arcs were measured along the body surface, and linear distances were measured as straight lines between two points. For 3DM, the participants maintained a standardized posture as defined by ISO 20685-1 with their feet positioned 20 cm apart and arms abducted at approximately 20°. A handheld 3D scanner, Eva (Artec Europe, Luxembourg), was used to scan the entire body while the expert moved 360° around the subject. Each scan session lasted approximately one to three minutes, and each participant underwent two to three scan repetitions to prevent data loss due to motion artifacts or errors in scan merging. Special attention was taken to ensure complete surface coverage during scanning to avoid missing data in complex regions such as the armscye and crotch. The scan-derived measurements were calculated using the Sculpt software (3D Systems Inc., Rock Hill, SC, USA) by measuring the distances between predefined landmarks on the scan data. 3DM measurements were extracted along the same paths and definitions used for MM to ensure comparability. This 3DM method was used to minimize the common errors associated with automatic landmark generation and automated measurement functions in conventional 3D body scanning systems, as reported by Kouchi & Mochimaru
11
and Qi et al.
27
Process of measuring, including two methods: manual measurements and 3D body scan measurements.
Landmarks and measurements
To evaluate the reliability of 3D scan–derived anthropometric measurements for EPs, this study focused on the measurable relationships between selected APs and EPs. Measurement items were chosen to represent key dimensions relevant to garment design—specifically, the distances and surface paths connecting APs and EPs.
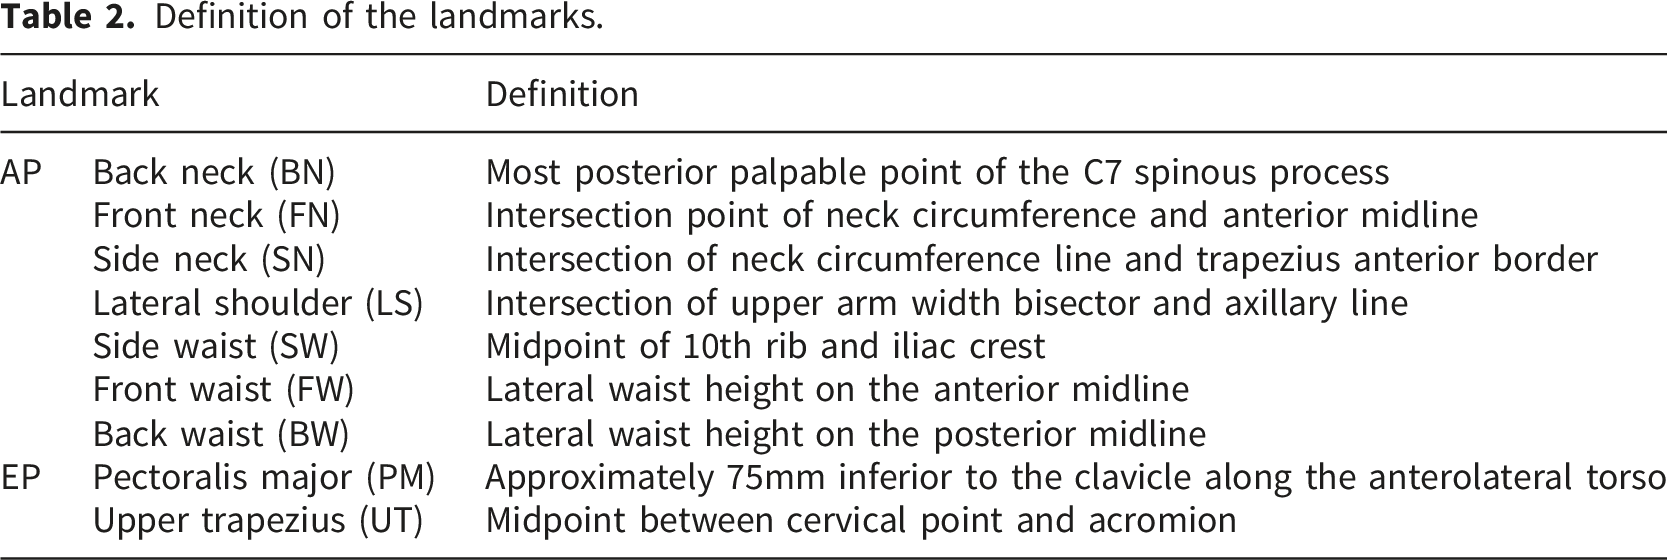
Definition of the landmarks.
The measurement items consisted of circumference, arcs (surface path length), and linear distances (Figure 2). The EP–AP arc items were selected based on practical relevance for pattern design and the palpation procedure used for identifying electrode locations. Accordingly, two representative surface paths were included: FN to PM and SN to UT. The FN–PM path reflects the commonly referenced anterior landmark for positioning the PM electrode, whereas the SN–UT path was chosen as the nearest pattern-design landmark to the UT, which is defined at the midpoint between BN and LS. To concurrently assess the reliability of standard anthropometric variables, waist circumference, back length, and biacromion length were also included. Extracted landmarks, including nine anthropometric points and two EMG electrode attachment points. The yellow lines (AP) and white lines (EP) indicate the measurement paths for four arc lengths and one circumference, respectively.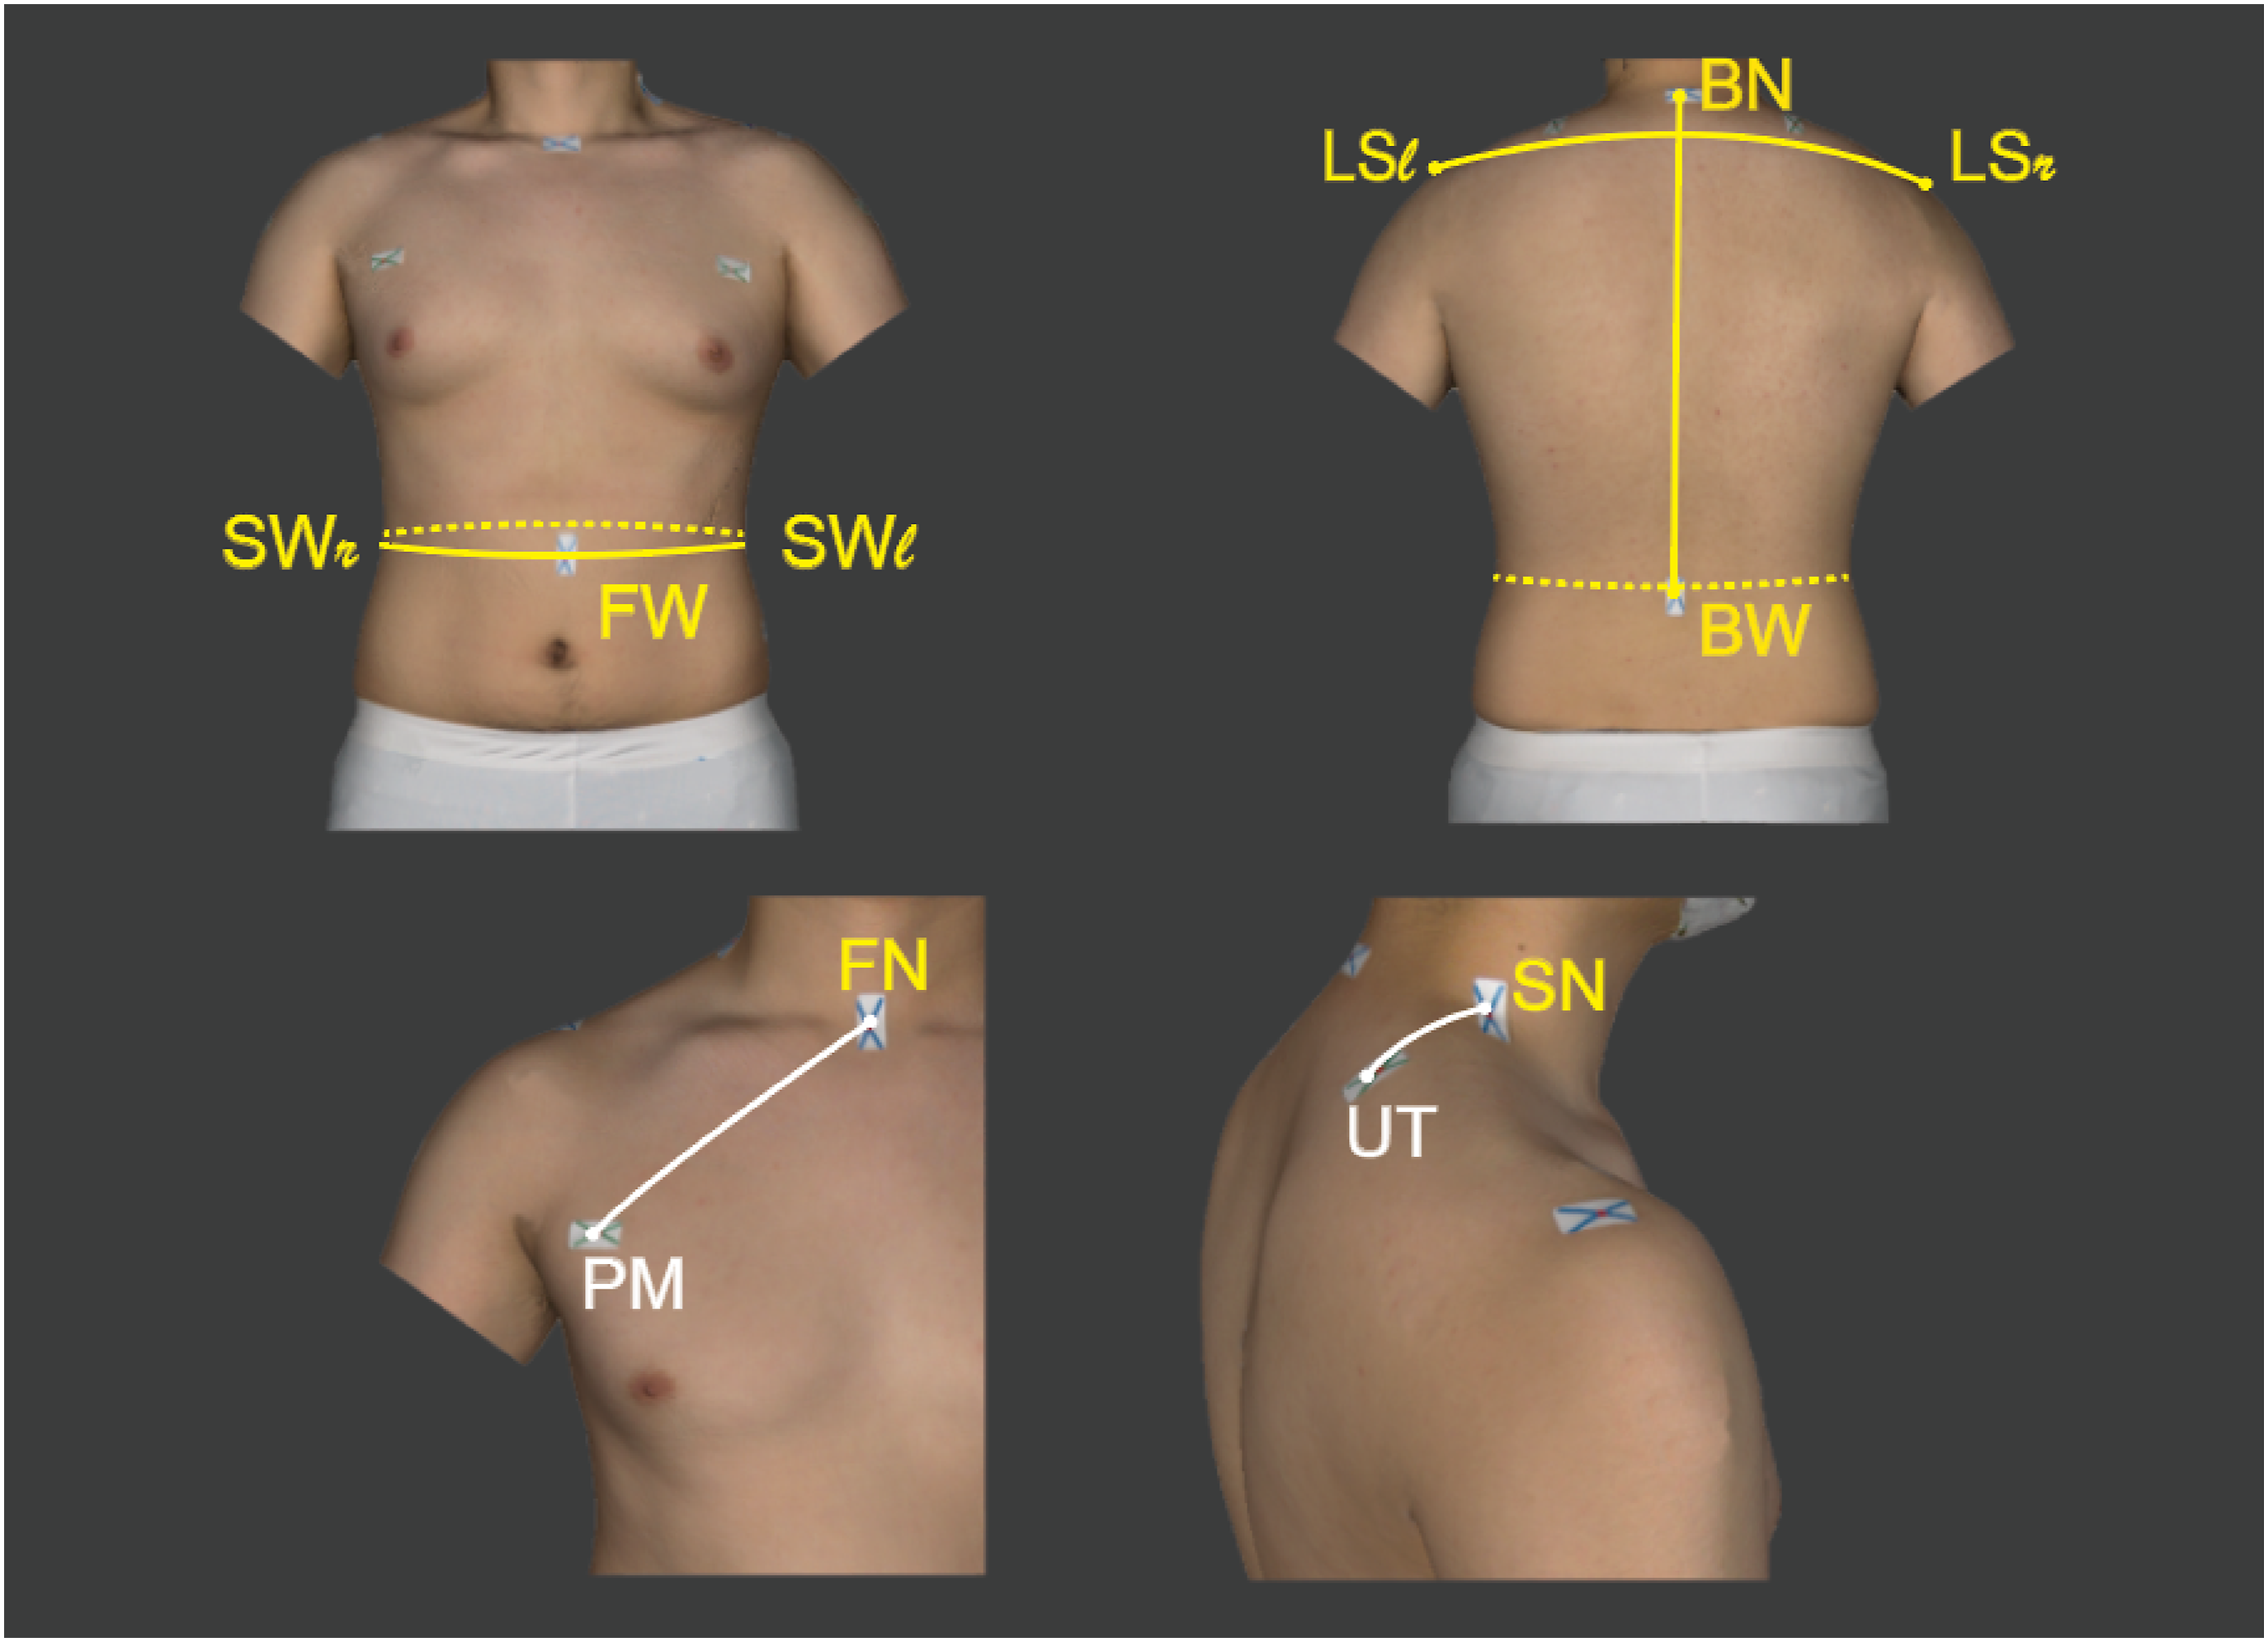
Data analysis
The reliability of anthropometric measurements derived from 3D body scan data was evaluated. A t-test and ICC analysis were conducted to compare the two measurement methods, and Bland–Altman analysis was performed. All statistical analyses were conducted using SPSS for Windows (IBM Corp., Armonk, NY, USA).
Results and discussion
Descriptive comparison of the measurement values
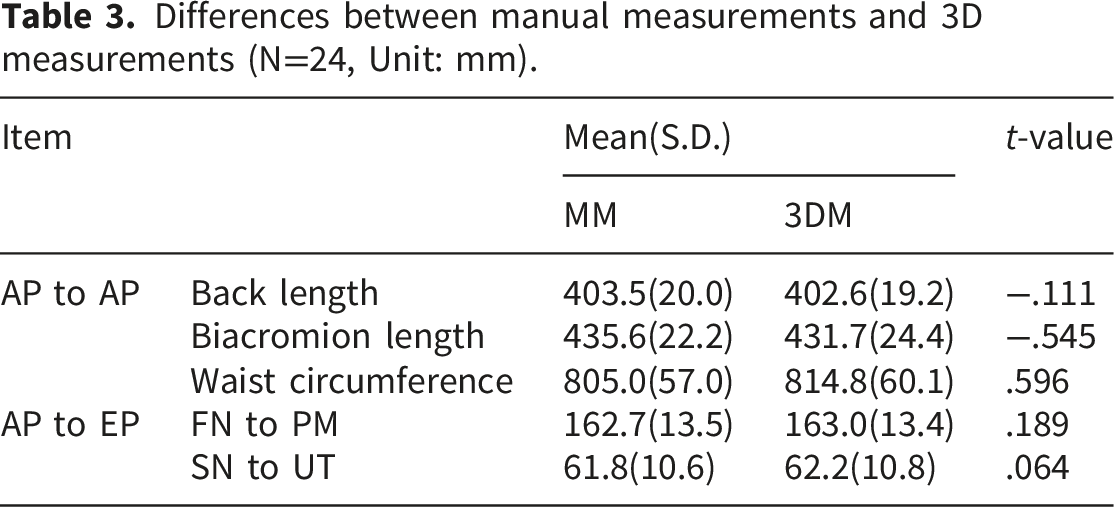
Differences between manual measurements and 3D measurements (N=24, Unit: mm).
Other studies, such as Bougourd et al. 33 and Kuehnapfel et al. 22 cautioned that while average agreement may be statistically acceptable, region-specific discrepancies can occur especially in girth and curved surface areas like the waist. These variations are often linked to posture differences during scanning, landmarking inconsistencies, and the influence of soft tissue. Therefore, although 3DM showed strong potential as an alternative to MM in capturing the mean anthropometric values, care must be taken in interpreting the measurements from anatomically complex regions.
Error analysis of 3DM and MM
Comparison of the measurement errors between manual and 3D (N=24, Unit: mm).
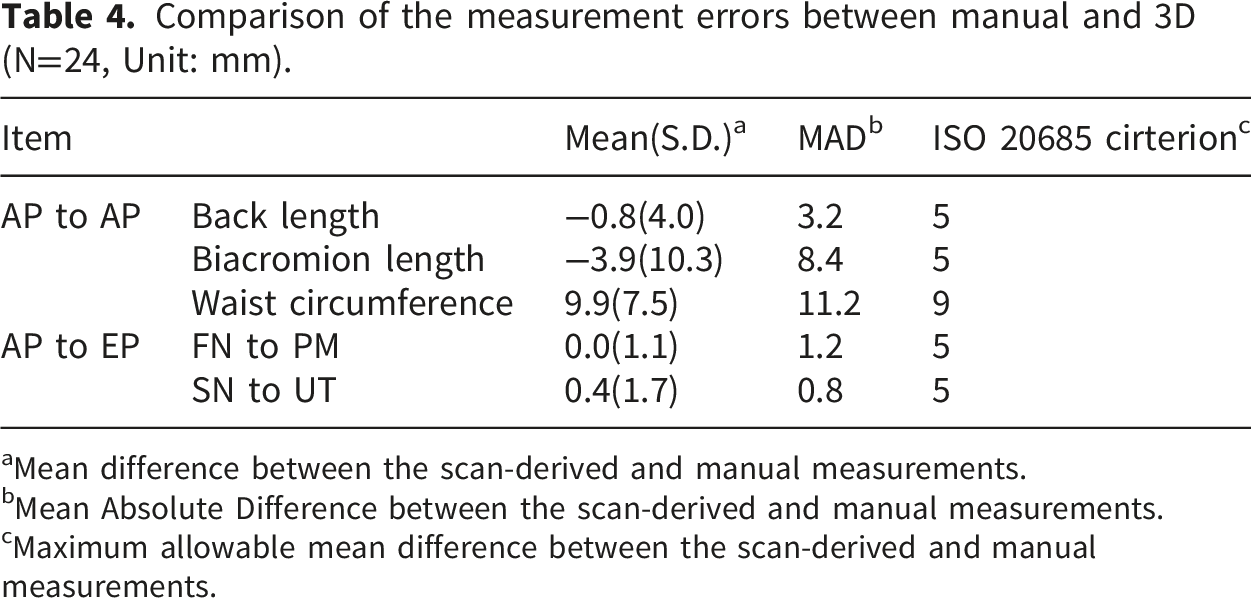
aMean difference between the scan-derived and manual measurements.
bMean Absolute Difference between the scan-derived and manual measurements.
cMaximum allowable mean difference between the scan-derived and manual measurements.

Differences between 3DM and MM.
Research by Hashemi-Nejad et al.
35
showed that larger anatomical landmarks with higher curvature and flexibility are more susceptible to measurement discrepancies between manual and scan-based methods. In this study, the biacromion length is seen as a difference according to the posture maintenance of the arm during the scan, and the waist circumference also differs according to breathing and posture maintenance, but it is believed that the difference from MM occurs because the 3DM measurement reflects all human flexions, as shown in Figure 4. The scan-derived waist circumference reflects the full curvature of the torso surface, capturing subtle undulations and body contours that are often overlooked in manual tape measurements.
36
This comprehensive surface tracking tends to produce systematically larger values than MM, particularly in areas affected by soft tissue deformation or changes in posture. In addition, the waist region was reported to be particularly susceptible to variations because of respiratory movement and postural sway.11,34,35 The discrepancies between the MM and 3D scan-derived measurements (3DM) in this study appear to result from these physiological and procedural factors. Comparison of the waist circumference measurement between MM and 3DM.
Similarly, the differences in biacromion length can be attributed to a combination of methodological and postural factors (Figure 5). In manual measurements, participants maintained a relaxed standing posture with their arms naturally at their sides, and the distance between the left and right acromion points was measured using a tape, typically following a relatively straight path along the visually apparent shoulder contour. In contrast, 3D scanning was performed with the arms abducted by approximately 20° to prevent data occlusion in anatomically complex regions such as the axilla, in accordance with ISO 20685-1 protocols.11,20 This standardized arm position induces a slight superior and medial shift of the acromion process, which contributes to the systematic bias observed in 3DM. Rather than representing a measurement error, this discrepancy reflects a postural offset inherent to standardized scanning conditions that should be considered when translating 3D scan–derived data into static garment patterns. In addition, CAD-based measurements trace a curved surface path between shoulder landmarks, whereas manual measurements typically approximate a straight-line distance. As a result, 3DM tends to yield longer biacromion values than MM. Collectively, the observed differences in biacromion length are likely attributable to (1) variations in arm posture during measurement and (2) differences in measurement path definitions between manual and scan-based techniques. These findings highlight the need to account for posture- and curvature-related effects when interpreting scan-derived anthropometric measurements. Comparison of the biacromion length measurement between MM and 3DM.
Reliability of the measurement method using 3D CAD
Intraclass correlation coeffcients (ICC) between manual and 3D measurements (N=24).
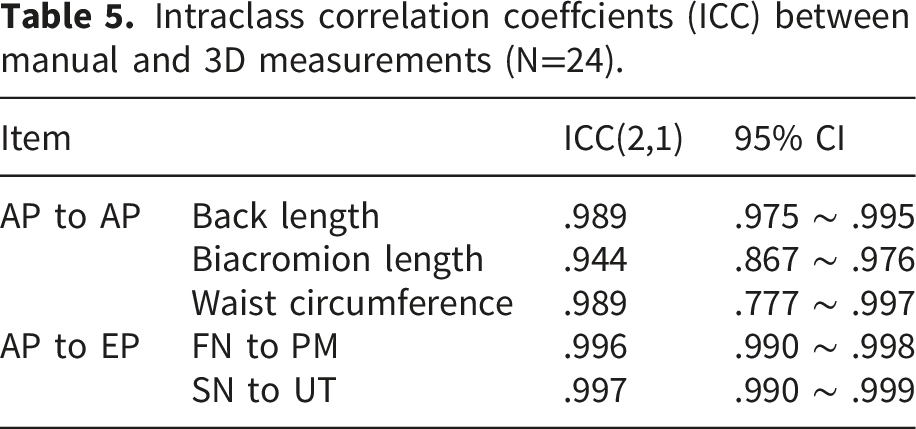
Although the waist circumference and biacromion length exceeded the ISO tolerance range, the overall ICC values for all measurement items still met the criteria for “excellent reliability.” However, since ICC reflects consistency rather than absolute agreement, it may remain high even in the presence of systematic bias. Therefore, the Bland–Altman analysis was additionally used to identify such bias, particularly for biacromion length and waist circumference, where larger deviations were observed.
The Bland–Altman plots showed that differences between MM and 3DM for most items were distributed symmetrically around the mean, particularly the back length, FN to PM, and SN to UT, suggesting minimal bias (Figure 6). In particular, FN to PM and SN to UT, which are short surface lengths along relatively flat body regions, showed high consistency between measurements. This suggests that distances referenced to nearby anthropometric landmarks such as FN or SN can be used as measurement inputs when designing electrode positions in smart clothing. Bland–Altman plots comparing the 3DM and MM for five anthropometric measurements: (a) back length, (b) biacromion length, (c) waist circumference, (d) front neck point to the pectoralis major, (e) side neck point to the upper trapezius.
Nevertheless, the biacromion length and waist circumference showed systematic bias, with 3DM consistently underestimating the biacromion length and overestimating the waist circumference. These trends are consistent with the results from Kuehnapfel et al., 22 who reported that the 3D scan-based waist circumference was significantly overestimated because of breathing and abdominal expansion during scanning. This discrepancy was partly attributed to how scan-derived measurements reflect the full body surface curvature, capturing subtle undulations that tape measurements may bypass. Simmons et al. 10 reported that “some scan-derived circumferences tended to be larger than manual measurements because of the inclusion of all surface undulations,” while Xia et al. 23 also reported greater variability in highly curved areas, such as the waist and bust, due to difficulties in landmark localization and scanning angle.
Short surface paths (e.g., FN–PM and SN–UT) showed excellent reliability, with ICC values above 0.9 and minimal measurement bias. However, in highly curved or deformable body regions (such as the biacromion length and waist circumference), systematic bias was more pronounced despite the high ICC values, indicating the need for caution when interpreting scan-derived data. Nevertheless, when posture is standardized and measurement conditions are properly adjusted in the CAD environment, the 3DM approach remains sufficiently robust and practical for smart garment development.
Practical calibration for smart clothing
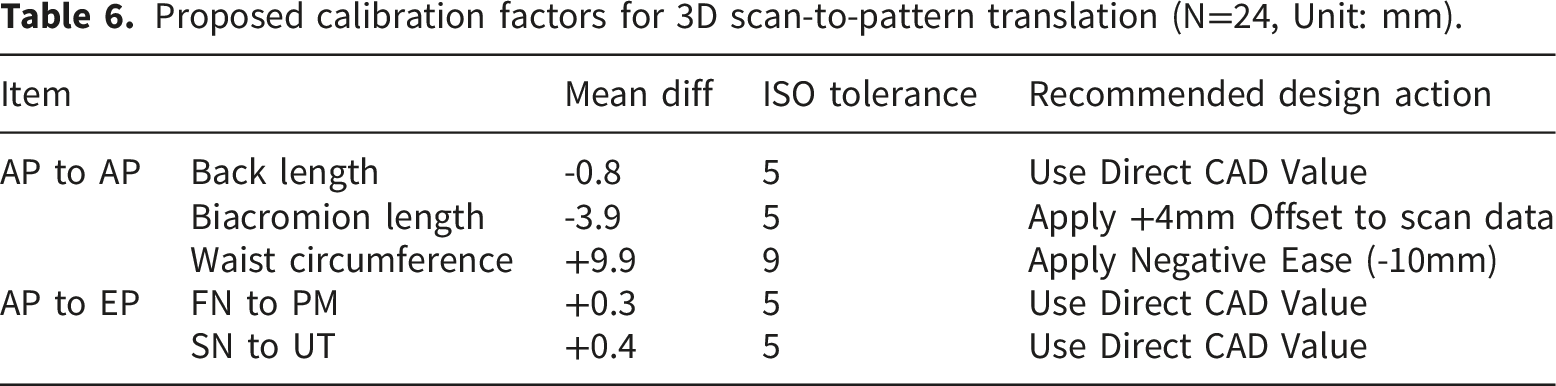
Proposed calibration factors for 3D scan-to-pattern translation (N=24, Unit: mm).
Conclusions
This pilot study validated both the methodological feasibility and practical applicability of using 3D scan–derived anthropometric data for precise electrode positioning in smart clothing development. High reliability was confirmed across all five measurement dimensions, with ICC values exceeding 0.9, demonstrating that 3D measurement (3DM) can serve as a stable alternative to manual measurement. In particular, electrode-referenced short surface paths located on relatively flat regions (FN–PM and SN–UT) exhibited excellent agreement with minimal measurement bias in Bland–Altman analysis, supporting their direct use as primary pattern-level coordinates in CAD-based garment design workflows without additional adjustment.
In contrast, systematic discrepancies were observed in biacromion length and waist circumference, primarily attributable to postural variation and physiological effects such as arm abduction and soft-tissue deformation during scanning. Although these dimensions also demonstrated high ICC values, they exceeded the tolerance limits specified in ISO 20685-1, indicating the necessity for targeted calibration strategies. Specifically, underestimation of shoulder width should be compensated through positive offsets, while overestimation of girth measurements requires negative ease allowances to account for the absence of tissue compression in scan-derived data. Establishing these initial calibration trends provides a foundational framework for translating 3D digital human models into functional, mass-customized smart garments.
Overall, the findings indicate that 3DM-derived anatomical point–to–electrode point (AP–EP) distances achieve sufficient precision and stability to support reliable EMG electrode placement within a digital 3D-to-pattern workflow. While this preliminary validation was limited to a restricted set of measurement items and male participants, the results demonstrate the potential for scalable digital apparel engineering driven by accurate anthropometric data. Future research will expand the landmark–electrode dataset, incorporate more diverse body types and dynamic postures, and develop automated predictive models for sensor placement, thereby enabling large-scale industrialization of data-driven smart textiles.
Footnotes
Author note
Authors’ information:
Acknowledgements
The authors acknowledge the financial support from the Korea Institute of Industrial Technology.
Ethical considerations
This study was approved by the institutional Review Board of Korea National Institute for Bioethics Policy (Approval No. P01-202005-23-002).
Funding
The authors disclosed receipt of the following financial support for the research, authorship, and/or publication of this article: This study has been conducted with the support of the Korea Institute of Industrial Technology as Development of microfactory-based technology for future smartwear manufacturing (KITECH EH-26-0006).
Declaration of conflicting interests
The authors declared no potential conflicts of interest with respect to the research, authorship, and/or publication of this article.
Data Availability Statement
The datasets used and/or analyzed during the current study are available from the corresponding author on reasonable request.